Herschel111Herschel is an ESA space observatory that has science instruments provided by European-led Principal Investigator consortia with important participation from NASA. Reveals Massive Cold Clumps in NGC 7538
Abstract
We present the first overview of the Herschel observations of the nearby high-mass star-forming region NGC 7538, taken as part of the Herschel imaging study of OB Young Stellar objects (HOBYS) Key Programme. These PACS and SPIRE maps cover an approximate area of one square degree at five submillimeter and far-infrared wavebands. We have identified 780 dense sources and classified 224 of those. With the intention of investigating the existence of cold massive starless or class 0-like clumps that would have the potential to form intermediate- to high-mass stars, we further isolate 13 clumps as the most likely candidates for followup studies. These 13 clumps have masses in excess of 40 M⊙ and temperatures below 15 K. They range in size from 0.4 pc to 2.5 pc and have densities between cm-3 to cm-3. Spectral energy distributions are then used to characterize their energetics and evolutionary state through a luminosity-mass diagram. NGC 7538 has a highly filamentary structure, previously unseen in the dust continuum of existing submillimeter surveys. We report the most complete imaging to date of a large, evacuated ring of material in NGC 7538 which is bordered by many cool sources.
1 Introduction
The European Space Agency’s Herschel Space Observatory (Pilbratt et al., 2010) probes the cold, dusty precursors of stars in unprecedented numbers and detail. Herschel’s submillimeter and far-infrared wavebands span the peak of the spectral energy distribution (SED) where cold cores emit the bulk of their radiation. The combination of Herschel’s spectral coverage and high angular resolution allows, for the first time, the identification of large numbers of potential star-forming cores (0.1 pc) and clumps (0.5 pc) in high-mass star-forming regions and to measure their dust properties. In this paper, we report the first Herschel results on the nearby high-mass star-forming region NGC 7538 observed as part of the Herschel imaging study of OB Young Stellar Objects (HOBYS, Motte et al. 2010) Key Programme. At a trigonometric parallax distance of only 2.7 kpc from the solar system (Moscadelli et al., 2009), NGC 7538 (catalog ) is a relatively nearby region of high-mass star formation and an excellent place to search for the precursors of future high-mass stars.
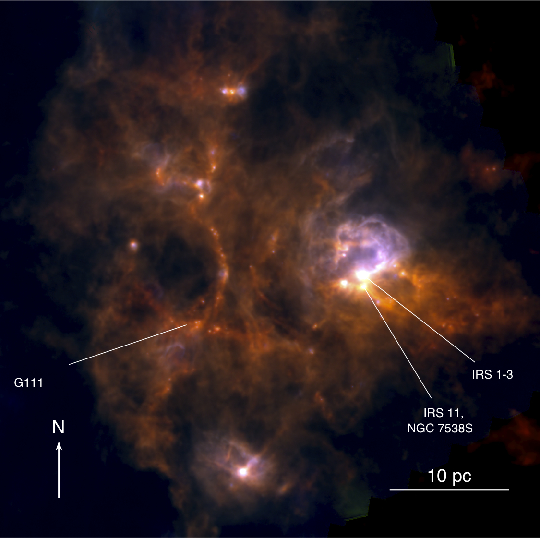
Although NGC 7538 (catalog ) is best known for the bright H II region surrounding the source known as IRS 5 (Crampton, Georgelin, & Georgelin, 1978), star-formation is distributed widely throughout the larger molecular cloud. Each of the three brightest infrared sources IRS 1, 2, and 3 has its own associated compact H II region (Wynn-Williams, Becklin, & Neugebauer, 1974). Collectively, these three sources are embedded in a region rich with outflows and photodissociation fronts (Davis et al., 1998). Observations of a 12′8′ region at 850 m (Reid & Wilson, 2005) showed that all of these sources are embedded in an extensive network of filaments and compact sources comprising several thousand solar masses of gas and dust. Elsewhere in the region, Frieswijk et al. (2007) found a filamentary complex in an 18′18′ map of C18O(2–1) around the cold cloud G111.80+0.58 (at (J2000) = 23:16:22, 61:22:47; G111 hereafter). The G111 complex contains about a dozen candidate cold, high-mass clumps, several with masses exceeding 100 M⊙ (Frieswijk et al., 2007). All of these regions are labeled in Figure 1.
The Herschel data presented here expand our spatial coverage of this region by nearly an order of magnitude, revealing the full extent of the filamentary structure in the area as well as a large population of compact, potentially star-forming sources. Herschel’s ability to both detect and characterize cold, high-mass sources make it an especially exciting tool for the study of high-mass star formation in nearby regions such as NGC 7538.
2 Observations
2.1 Herschel Data
The observations of a portion of NGC 7538 (catalog ) were made by Herschel on 14 December 2009 as part of the HOBYS Key Programme. The data were acquired using the PACS (Poglitsch et al., 2010) and SPIRE (Griffin et al., 2010) cameras working in parallel mode with a scanning speed of 20″/second (OBSIDs: 134218808, 1342188089). Images were obtained simultaneously with PACS at 70 m and 160 m and SPIRE at 250 m, 350 m, and 500 m. These five wavebands range in angular resolution from 5.6″ at 70 m to 36″ at 500 m. The calibration and deglitching of the Level 0 PACS and SPIRE data were done using HIPE222HIPE is a joint development software by the Herschel Science Ground Segment Consortium, consisting of ESA, the NASA Herschel Science Center, and the HIFI, PACS, and SPIRE consortia. version 9.0. The level 1 data were then used to produce maps with version 18 of the Scanamorphos software package (Roussel, 2012). Figure 1 shows a three-color image made from SPIRE and PACS data. The stretch and contrast of each waveband have been manipulated slightly to accentuate color variations. The bright region which dominates the western half of the image coincides with the void in the H II region. This bright complex contains the aforementioned IRS sources as well as the young stellar object NGC 7538S ( (J2000)= 23:13:45, +61:26:51). The two brightest emission peaks in the image saturated the detectors in the SPIRE 250 m band. These peaks are coincident with IRS 1–3 (at (J2000)= 23:13:45, +61:28:10) and IRS 11 (at (J2000)= 23:13:44, +61:26:49). Both peaks were re-observed with Herschel in bright source mode to fill in the holes in the map (OBSID: 1342239268). These observations were taken on 13 Feb 2012 and the saturated pixels were replaced in the images using the method described in Nguyen Luong et al. (subm.). Figure 1 also highlights the highly filamentary nature of the emission.
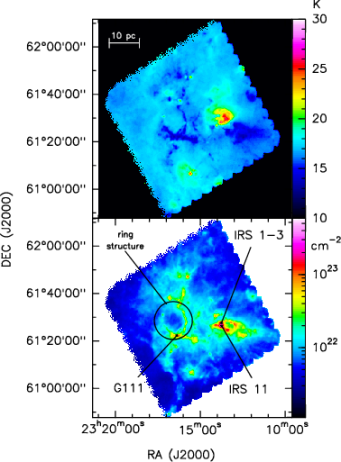
Using the 160 m, 250 m, 350 m, and 500 m data, we constructed H2 column density and dust temperature maps of the region using the IDL minimization fit routine mpfitfun. These maps are shown in Figure 2 and include labels of all of the sources mentioned above.
2.2 JCMT data
To obtain CO(3–2) emission observations, we observed NGC 7538 with the HARP instrument at the James Clerk Maxwell Telescope333The James Clerk Maxwell Telescope is operated by the Joint Astronomy Centre on behalf of the Science and Technology Facilities Council of the United Kingdom, the National Research Council of Canada, and (until 31 March 2013) the Netherlands Organisation for Scientific Research. (JCMT). HARP is a 4 4 array of heterodyne receivers that can observe 325-375 GHz. HARP was tuned to observe CO(3–2) at 345.7959899 GHz (Pickett et al., 1998), and the JCMT’s ACSIS correlator was configured to observe the line over a 1 GHz wide band with 2048 channels having a velocity resolution of 0.42 km s-1 channels. The NGC 7538 region was divided into 36 fields each 12′ 12′ in size, and spaced in R.A. or decl. by 10′, that covered essentially the same region observed by Herschel. Each field was observed in on-the-fly mode using an offset position found to be free of CO(3–2) emission located at 23h20m55.72s, +60∘50′00.4′′ (J2000). After each scan along the length of a field, the array was moved in either R.A. or decl. by 1/4 of its extent (i.e., 30′′) between scans to obtain samples of each position by several receivers. The observations were obtained throughout semesters 07B, 09B, and 10B.
The JCMT data were reduced using standard procedures within the Starlink package. Integrations from each receiver were checked visually for baseline ripples or extremely large spikes, and any such affected data were removed from the ensemble. Each integration had its baseline subtracted, its frequency axis converted to velocities in the local standard of rest frame, and its outer velocities trimmed using scripts kindly supplied by T. Van Kempen. The data for each field were co-added into final spectral cubes, and then arranged into a final mosaic of all fields of about 1∘ 1∘ in extent. The typical 1 rms sensitivity reached was 0.6 K per channel on the scale. Spectra were converted to main beam brightness temperature using an efficiency measured from planetary observations of 0.75 (P. Friberg, private communication).
3 Results
3.1 SED Fitting
Figure 2 shows the column density (N) and dust temperature maps of NGC 7538. To produce these maps, we corrected the arbitrary zero-point flux offset for each PACS and SPIRE map with data from the IRAS and Planck telescopes (see Bernard et al., 2010). After applying the offsets, each PACS and SPIRE map was convolved to the 500 micron beam size (36) and regridded to the same pixel resolution as the 500 m map. We used the IDL routine mpfitfun to fit a modified blackbody function to each pixel, assuming the dust spectral index, =2.0 and the dust opacity per unit mass column density, =0.1 cm2/g for a reference wavelength of 300 m. For these fits, we exclude the 70 m data since the emission from this short wavelength more likely results from warmer material rather than the cold dust component traced by the longer wavelengths which we are most interested in (e.g. Hill et al., 2011). For the NGC 7538 region, line-of-sight dust temperatures predominantly range between 12 K and 25 K with a mean temperature of 17 K and column densities vary from 31021 cm-2 to 41023 cm-2. From the column density map, we calculate a total mass of the region to be nearly 4105 M⊙ which is in agreement with Ungerechts, Umbanhowar, & Thaddeus (2000). Over half of this mass is contained in high-column density structures (1022 cm-2).
3.2 The Ring Structure
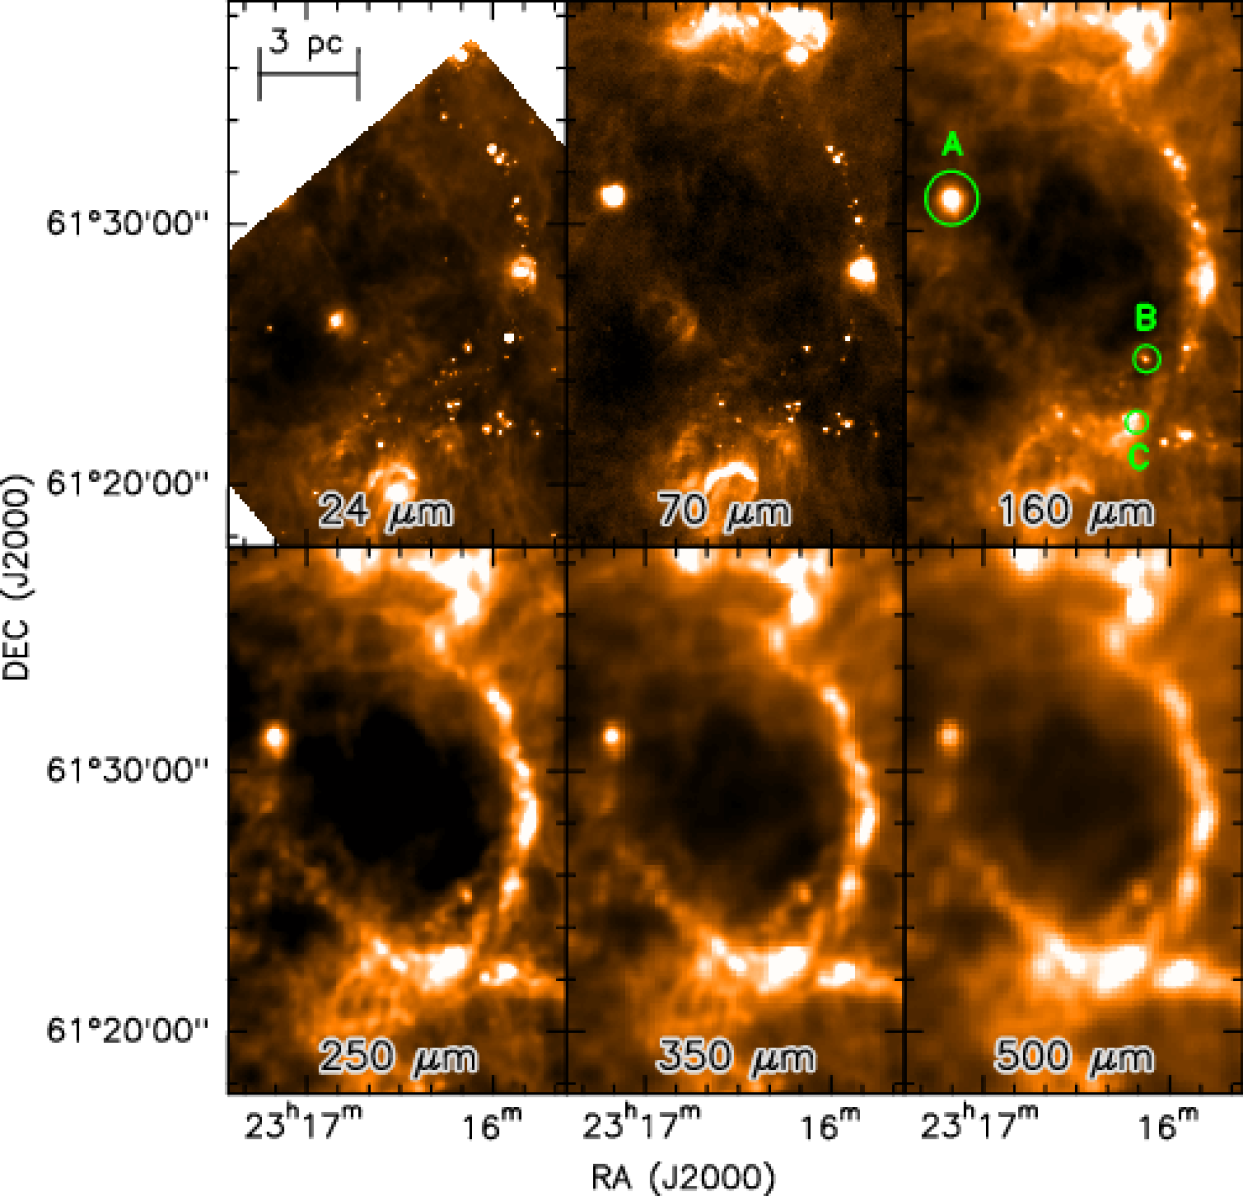
A striking feature of the NGC 7538 maps is the existence of ring-like features, especially the nearly complete ring which dominates the eastern section of the Herschel map (see Figure 1). A zoomed-in view of this region is shown in Figs. 3 and 4. Portions of this ring were previously detected by Frieswijk et al. (2007) in C18O(2–1) emission and by Frieswijk et al. (2008) in the Spitzer continuum bands. Here, we also present JCMT CO(3–2) data which include the entire ring structure. Such a large, well-defined ring has not been seen in the other regions observed in the HOBYS survey, e.g., Rosette (Schneider et al., 2010), W48 (Nguyen Luong et al., 2011), or Cygnus X (Hennemann et al., 2012), emphasizing the peculiarity of this feature444Note that small, less prominent bubbles were observed by Zavagno et al. (2010) in RCW120 and by Anderson et al. (2012), and that Churchwell et al. (2006) provide a catalog of bubbles seen with Spitzer in the Galactic plane. However, as we do not see evidence for spherical symmetry in NGC 7538, the ring structure may be a different type of object. Some less clean rings are observed in M16 (Hill et al., 2012) and W3 (Rivera-Ingraham et al., 2013)..
As shown in Figure 3, the ring is prominent in thermal dust emission at wavelengths of 160 m and longer. It is visible as a string of point sources in the PACS 70 m image and the Spitzer MIPS 24 m image (see Figure 3). The ring is a nearly complete ellipse with major and minor axes of approximately 10.6 pc and 7.4 pc, respectively. The ring may be the edges of a bubble produced by an internal energetic source, but its origin is not yet clear. According to an exhaustive catalog of both known and candidate O and B stars (Reed, 2005)555Vizier catalog V/125, no such stars lie within the ring. Although there is an A0 type star within the ring, the nearest known massive star is a B star about 4 pc east of the ring. A search of archival data has so far revealed no MSX, IRAS, or radio continuum sources within the ring which might account for its existence.
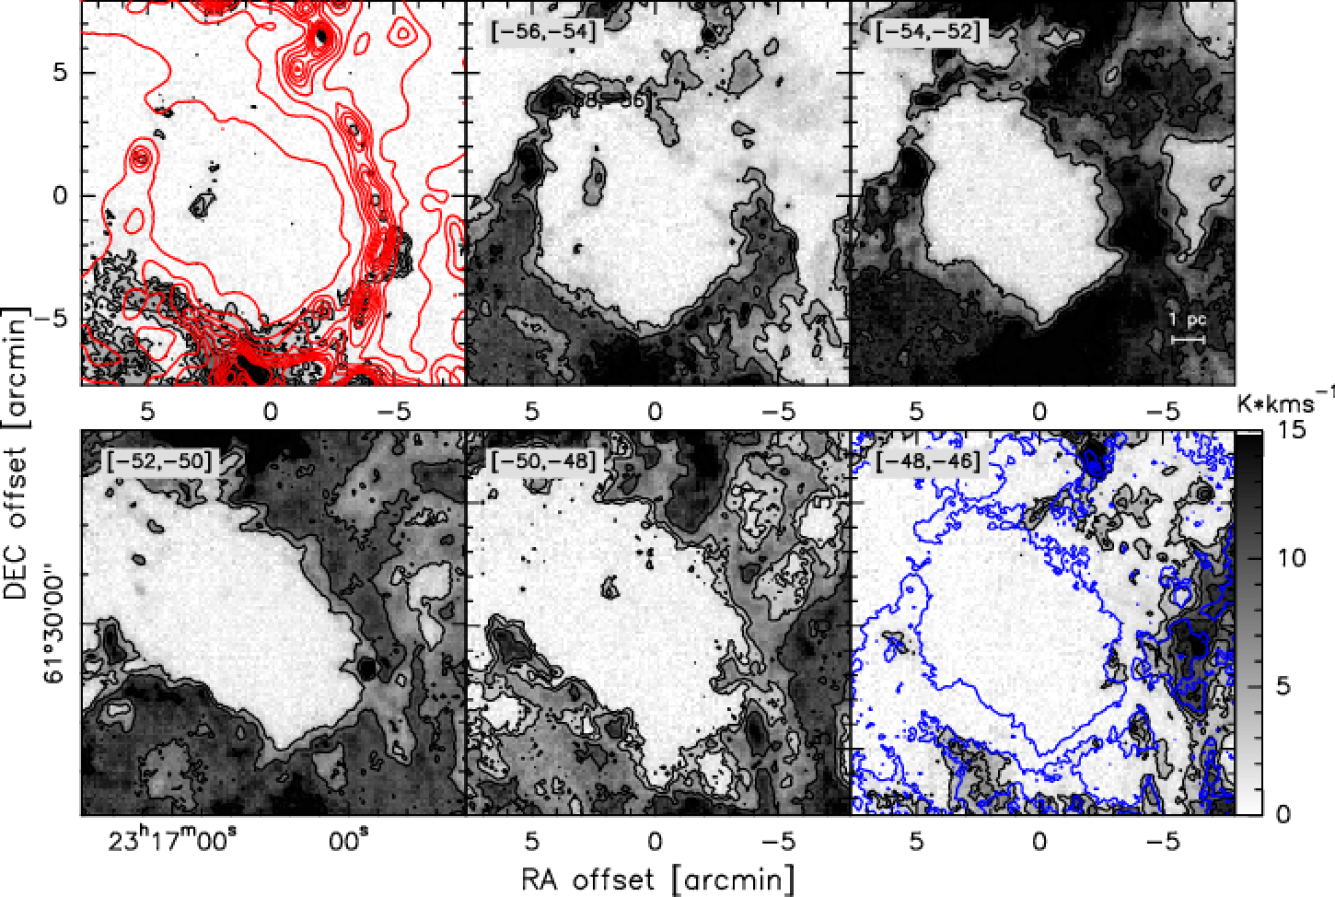
The JCMT CO(3–2) data also show no indication of objects present that may be responsible for forming the ring. In the channel map presented in Figure 4, the emission from the channels spanning the ring’s velocity range is shown. At this longer wavelength (870 m), a driving source is still not evident.
Aside from a small feature most prominent in the [-56,-54] km s-1 channel, the region within the ring appears completely devoid of material in its entire 17 km s-1 velocity range. A spherically symmetric object such as a bubble would likely exhibit emission within the ring at the higher velocities in the channel map, which we do not see. It is more likely that we are observing a bubble that has broken out of the molecular cloud, producing a ring of CO emission (similar to smaller molecular rings seen by Beaumont & Williams (2010) around the Churchwell Spitzer bubbles.) Such a void (with a typical column density of 61022 cm-2) is in stark contrast to the rest of the NGC 7538 region as well as the other HOBYS fields which are dominated by low levels of diffuse emission (typically higher than 1022 cm-2) throughout the maps. This lack of diffuse continuum and line emission indicates that the ring was created through different mechanisms than the methods by which other filaments in these star formation regions formed. Of course, it is possible that the ring could be a coincidental alignment of curved filaments, but the lack of diffuse gas within the ring would suggest otherwise.
While the ring appears elliptical in the Herschel data and at the redder velocities in the CO data, it becomes even more elongated in the northeast-southwest direction at the bluer CO velocities. The integrated intensity contours overplotted in the bottom right panel of Figure 4 retain this dominant oblong shape. Although the ring is brightest at the southern end closest to G111, these integrated intensity contours establish the nearly-closed morphology of this ring structure.
3.3 Source Extraction
To identify compact sources in the field, we used version 1.120916 of the getsources algorithm (Men’shchikov et al., 2010, 2012). Since the PACS and SPIRE instruments are so sensitive, we detect significant extended, diffuse emission which makes source extraction more difficult. Rather than subtract a global background from the entire image, as is sometimes done, getsources separates emission across a wide range of angular scales and then uses this information to identify sources as peaks relative to their local backgrounds. Thus, compact sources are extracted without imposing any parametrization on either their structure or that of the diffuse background. The algorithm assigns, to each source identified in each waveband, a shape, size, peak flux, total flux and significance value. Note that it is possible for sources detected at longer wavelengths to be resolved into multiple objects at shorter wavelengths due to increasing resolution. However, getsourcespasses information on from the higher resolution images to the extractions of lower resolution images. For each object detected in the higher resolution maps, the final catalog assigns a single non-overlapping flux value at all the wavelengths for which a significant detection is made. The significance parameter is analogous to a signal-to-noise value in a single waveband.
Using this method, we have preliminarily identified 780 compact sources in NGC 7538. Of these, many were detected in fewer than the five possible wavebands. In such cases, the subset of wavebands in which the sources were detected varied. A common pattern was that sources were detected with SPIRE, but not with PACS. This result is partly due to the low luminosity of cold sources in the PACS wavebands and partly due to the wide range of angular resolutions among the five wavebands.
For our analysis, we consider only those sources which could be identified with getsources in at least two different wavebands with a significance of at least 7. Before fitting a modified black body function to the SED to a source, we additionally stipulated that a source must be detected in at least one more waveband with a significance of at least 5. These criteria were satisfied by 224 of the 800 sources.
Figure 5 shows the molecular hydrogen column density image overlaid with the sources extracted by getsources. The image shows that the compact sources divide into two groups: tight clusters of point-like sources which are bright at 70 m (blue and green in Figure 5) and long, filamentary chains of sources which are typically brighter at the longer wavelengths (red in Figure 5). Observations by Schneider et al. (2012) support the idea that the most massive YSOs preferentially form in clusters at the junction of filaments. However, the observed distribution of sources in this region may be due more to their proximity to high-mass versus low-mass sites of star formation.
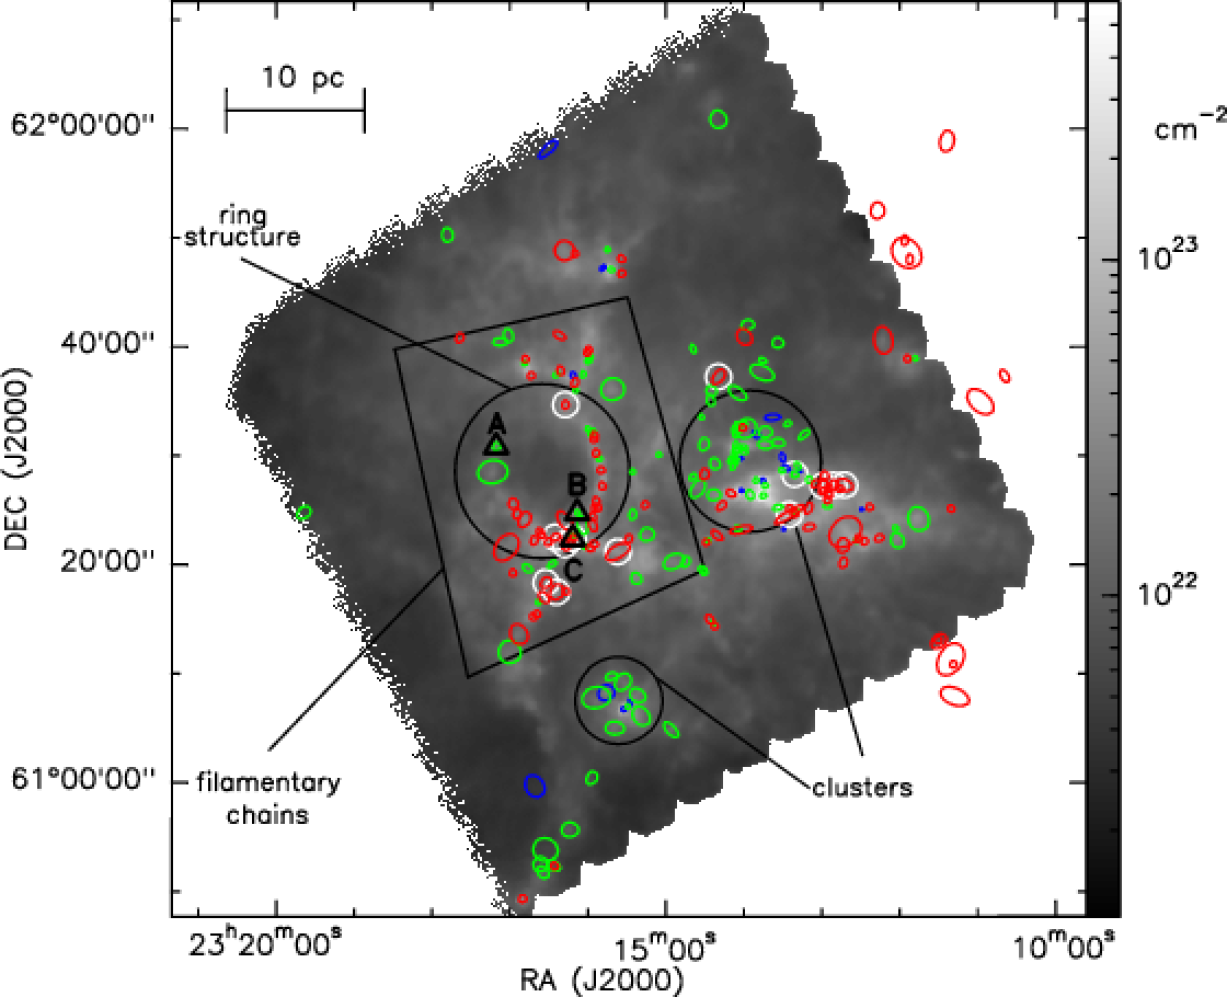
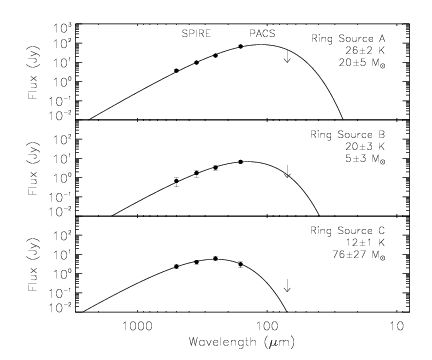
Figure 6 shows the SEDs of three sources identified in NGC 7538 and labeled with triangles in Figure 5. These sources are a representative sample of the sources which define the ring structure in eastern NGC 7538 discussed in Section 3.2 and are well-fit by single-temperature grey body SEDs. Source A ( (J2000) = 23:17:10.3, +61:31:14) is luminous ( L⊙) and extended (diameter 0.6 pc). We estimate its mass to be 205 M⊙, which, combined with its high temperature of 262 K, suggests it might be forming a high-mass star or a small cluster. Source B (at (J2000) = 23:16:07.5, +61:25:14) is a more typical low-mass core, with a luminosity and diameter of 38 L⊙ and 0.4 pc, respectively. Having a relatively high temperature of 203 K, it is likely already undergoing star formation. Source C (at (J2000) = 23:16:10.8, +61:22:52) is one of the candidate cold, high-mass clumps identified in this study and is listed in Table 1 as HMDC 8. With a luminosity and diameter of 18 L⊙ and 0.4 pc, respectively, it has a mass of 7627 M⊙, and a temperature of 121 K. Thus, it is within the L⊙/M⊙ regime where unevolved high-mass sources are thought to lie (see Section 4.2 below). Note that because it is cold, Source C is barely visible in the 70 m image (see Figure 3) but becomes much brighter at longer wavelengths.
4 Discussion
4.1 The Ring
We determine an order-of-magnitude estimate of 500 M⊙ for the mass of the ring by assuming a temperature of 15 K and converting the observed 250 m flux in the ring based on a dust opacity at 250 m of 2 as given by Hildebrand (1983). Using a simple order-of-magnitude energy calculation, we determine that the energy required to move that mass from a centrally concentrated sphere out to a spherical shell of radius 8 pc based on an assumed expansion rate of 1 km s-1 would be on the order of 1045 erg. While the observations suggest that a two dimensional geometry may be more appropriate, we choose spherical symmetry for this simple illustrative first-order approximation. The assumed expansion rate of 1 km s-1 is typical for a supernova remnant near the end of the radiative expansion phase when the expansion rate becomes that of the sound speed of the ambient medium. This energy is several orders of magnitude lower than the erg released in a typical supernova collapse of a massive star (Wilson, 1985). It may instead be similar to the amount of energy contributed by the stellar wind of a massive star, but we see no indication for the presence of such a source within the ring. We also look into the possibilities that a runaway O star that may have originated from within the ring, or alternatively, that a nearby windy O-star blew out the cavity within a bubble. The strongest candidate for either of these scenarios is HIP 115424, an O8 star approximately 50′ (40 pc) northeast from the center of the ring. This star is classified as a runaway star with a peculiar tangential velocity of 30 km s-1 (Moffat et al., 1998). Despite its relative proximity, the position and kinematics of this star make it unlikely that it originated within the ring. At its present location, the winds of an O8 star are likely too weak to have had much influence on the ring. Investigation into the accuracy of the spectral type classification of this star is necessary to explore this possibility further.
Based on its geometry, we suggest that this ring might be an example of triggered star formation. Although there is no H II region associated with this ring as in the case of the triggered star formation in the HOBYS study of N49 (Zavagno et al., 2010), for example, Figures 3 and 5 show that most of the ring is delineated by compact sources and cool dust and show that it is a coherent velocity structure. Our SED fits show that very few of these sources have temperatures exceeding 30 K and that many are somewhat colder. Several of our massive cold clumps—sites with the potential for intermediate- to high-mass star formation—lie along the ring and especially in the cluster of sources to the south. Frieswijk et al. (2007) also located several candidate sites of early high-mass star formation in this cluster. This cluster of sources make up the Infrared Dark Cloud (IRDC) G111.80+0.58 (Frieswijk et al., 2008). Our data reveal that this IRDC is not merely part of a filament, but actually at the intersection of a ring-like structure with surrounding filaments.
4.2 Source Properties and Energetics
Given the wide range of angular resolutions, and the likely presence of thermal substructure within each source, each waveband is sensitive to slightly different physical components within each source. For example, the warmer and more compact central regions of protostellar objects would be more prominent at shorter wavelengths within the smallest beams, while longer wavelengths with their larger beams are more sensitive to their cooler and more extended envelopes. To account for this size-wavelength dependence, we adopt the scaling prescription of Motte et al. (2010), which was elaborated further by Nguyen Luong et al. (2011). In general, this technique is applied to the regions in the HOBYS program because of the large distances involved, but it is unnecessary for resolved cores in the nearby low-mass star formation clouds. According to this prescription, we set the deconvolved source size using a fit to the 160 m image and then scale the 250 m, 350 m, and 500 m fluxes down according to
| (1) |
where is the deconvolved radius of the source over which the flux, , is integrated. This flux scaling method assumes that the source size obtained in the 160 micron image is accurate, that the emission at the longer wavelengths (250 m, 350 m, and 500 m) is optically thin, and that the flux varies linearly with angular radius. For dense cores and clumps, it is reasonable to assume that they are optically thin at these wavelengths. Likewise, the linear variation of the flux is a good approximation, at least until the point that an Hii region forms. Although testing non-linear models is beyond the scope of this paper, if the flux variation does not vary linearly with angular radius, it is likely that the temperature would be overestimated and consequently the mass would be underestimated.
After scaling the source fluxes in this way, we find that 224 sources out of the nearly 800 preliminary sources are well fit by a single-temperature grey body SED. Under the assumption that the data are accurately represented by the given SED function, we define a good fit such that there is a 95% chance that the calculated will be less than the value expected from random variations in the data (i.e. at the p-value statistical significance level.) We fit a SED of the form
| (2) |
where is the total mass of the source, kpc is the distance to the cloud, is the the dust opacity per unit (gas + dust) mass at 300 m, is the frequency corresponding to a wavelength of 300 m, is the dust emissivity index, and is the Planck function for dust temperature . We adopt a dust opacity of = 0.1 cm2 g-1 and a fixed dust emissivity index of . These values are derived from Hildebrand (1983) and are consistent with those used in other HOBYS studies (e.g., Motte et al. (2010)) as well as other SPIRE Galactic key programmes. Note, however, that the dust opacity and emissivity index, , are likely to vary with environment (Ossenkopf & Henning, 1994) which may imply non-systematic uncertainties in our measured dust masses (e.g., see Sadavoy et al. 2013, submitted). We assume a gas-to-dust ratio of 100. The total amount of mass associated with these 224 sources is on the order of 1104 M⊙. The overwhelming majority of this mass is contained within sources having temperatures less than 20 K.
We do not include the 70 m data in the SED fitting (see Hill et al. (2012) for further discussion). At wavelengths shorter than 100 m, the emission may require an additional temperature component to properly include the contribution from the warmer material associated with the protostar. Also, the 70 m emission may arise from very small dust grains (VSG) thereby changing the dust opacity law in this regime. Thus, in cases where the inner warm envelope material or VSG emission dominate the 70 m flux associated with the bulk envelope (the material primarily traced by the 160 m bands), the observed 70 m emission is typically higher than the SED fits at that wavelength.
With flux scaling applied to remove some of the influence of each source’s cold outer envelope, the SED fits are more representative of the interior parts of the sources where star formation, if present, would occur. For the purposes of assessing the evolutionary states of these sources, the conditions in their interiors are more important than those in their envelopes. For example, a cool interior is a more indicative sign of youth than a cool envelope.
In the future, we could leverage the information about each source’s emission on multiple spatial scales to construct more sophisticated, multi-temperature models, but for the present purpose of developing an overall picture of the star-formation activity in NGC 7538, we maintain this simple approach. Note that this procedure underestimates the source masses because it excludes flux from the outer envelope of each source as well as flux from wavelengths longer and shorter than those observed with Herschel. We deem this approach to be acceptable for our purposes since we are trying to identify conservatively sites of high-mass star formation.
Having derived each identified source’s temperature and mass from Equation 2, we compute their Herschel grey body luminosities as:
| (3) |
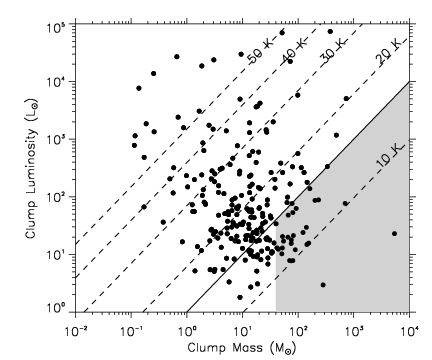
In Figure 7, we plot the luminosity of each source versus its total mass. The luminosity plotted here is that derived from the SED which, for cool, starless sources, should be similar to its bolometric luminosity. By taking the ratio of each source’s luminosity to its mass, we can assess the degree to which it is affected by internal heating, and therefore the likelihood that it is already forming stars (e.g. André et al., 2008; Motte et al., 2010).
The evolutionary state of a low-mass protostellar core is typically defined according to a scheme of classes, between Class 0 and Class III, using a combination of infrared and submillimeter observations (e.g. Lada, 1987; André, Ward-Thompson, & Barsony, 1994). This technique is generally less applicable to high-mass star formation for several reasons. First, the technique relies on positional coincidence to establish whether or not an infrared source is embedded within a given molecular cloud core. True physical association of infrared sources with dusty clumps is difficult to establish in high-mass star-forming regions, however, because these regions are typically distant and in clustered environments. Second, if a low-mass core contains an infrared point source, it is reasonable to assume that star formation is already underway and the star being formed is likely going to be the largest in the system. In a high-mass core, however, the high-mass star may not be the first star in the cluster to form. The presence of an infrared point source in a high-mass core may result from one or several low-mass protostars that formed before the most massive star in the cluster, and does not necessarily correspond to what will become the most massive star in the cluster.
For the above reasons, we employ the mass-luminosity diagram as a tool for characterizing the evolutionary states of the compact sources in NGC 7538. The mass-luminosity diagram helps separate sources according to their energetics and can be useful for separating Class I YSOs from Class 0 protostars and prestellar cores in the low mass regime and infrared-bright massive YSOs from infrared-quiet protostellar objects and starless dense cores in the high mass regime (Bontemps et al., 1996; Molinari et al., 2008; Hennemann et al., 2010; Roy et al., 2011). Due to their high opacities, unevolved dusty clumps with no internal heat source ought to be a few degrees colder than the ambient temperature of their parent molecular clouds, having temperatures of about 15 K and luminosity-to-mass ratios 1 L⊙/M⊙ (Roy et al., 2011). Indeed, Roy et al. divided high-mass sources in Cygnus X into two evolutionary categories: “Stage E,” denoting externally-heated sources, and “Stage A,” denoting sources at or above the ambient temperature due to heating by accretion. Stage E overlaps with the prestellar and Class 0 stages in the low-mass paradigm. In the mass-luminosity diagram, Stage E sources lie below L⊙/M⊙, while Stage A sources lie strictly above L⊙/M⊙.
To the Stage E classification, we add the additional requirement that a source must have a mass of at least 40 M⊙. Given a star formation efficiency of 30% or greater (Lada & Lada, 2003), a core would require on the order of 20 M⊙ to form a high-mass star. In their study of Cygnus X, Motte et al. (2007) use a criterion of 40 M⊙ as the mass required for a core to form a high-mass star. In the study of several other HOBYS fields (Rosette, W48 and RCW 120), Motte et al. (2010) and Nguyen Luong et al. (2011) use a lower criterion of 20 M⊙ to enlarge the census to cores able to form an intermediate-mass star. Most of those objects are more compact (on the order of 0.1 pc compared to 0.7 pc for the objects in this study), however, so we choose a more conservative lower limit of 40 M⊙ in order to isolate the highest mass objects in the NGC 7538 region.
We find 27 compact objects in NGC 7538 that satisfy the criteria M⊙ and L⊙/M⊙. These high-mass precursor candidates occupy the shaded region in Figure 7. Applying the further criteria that a source must be located within the region mapped by both PACS and SPIRE, that its temperature must be greater than 10 K, and that it be undetected at 24 m, 13 sources remain. A list of properties for these 13 sources is given in Table 1. As source extraction techniques evolve, this initial list of sources will need to be confirmed with a second detection method. These 13 sources range in diameter from 0.4 pc to 1.1 pc in mass from 40 M⊙ to a few hundred solar masses, and in density from cm-3 to cm-3. Their median diameters, masses, and densities are 0.7 pc, 80 M⊙, and cm-3 respectively. We define the deconvolved diameter of a source using the major and minor axes measured at the shortest wavelength at which the source was resolved (which is 160 m in all 13 cases. Its volume is defined as that of an ellipsoid having the same major and minor axes as the source, plus a third axis whose length is the arithmetic mean of the lengths of the other two.
Higher resolution data may reveal fragmentation within some of these sources, but we still present them here as a first cut of the potential intermediate and high mass star forming sites in NGC 7538. While many of these sites don’t fulfill the criteria set by Kauffmann & Pillai (2010), they still appear to be cold clumps of significant mass and are worthy of further investigation.
| HMDC | RA | Decl. | Mass | L/Maa luminosity/mass; clump diameter; temperature; volume density | Sizeaa luminosity/mass; clump diameter; temperature; volume density | Tempaa luminosity/mass; clump diameter; temperature; volume density | Densityaa luminosity/mass; clump diameter; temperature; volume density |
|---|---|---|---|---|---|---|---|
| h:m:s | d:m:s | M⊙ | L⊙/M⊙ | pc | K | cm-3 | |
| 1 | 23:12:42.5 | 61:27:47.9 | 200 | 0.43 | 0.9 | 13 | 8 103 |
| 2 | 23:12:51 | 61:27:46.7 | 80 | 0.66 | 0.7 | 14 | 8 103 |
| 3 | 23:12:58.9 | 61:27:44.1 | 150 | 1.2 | 0.8 | 15 | 9 103 |
| 4 | 23:13:20.7 | 61:28:47.7 | 40 | 0.85 | 0.4 | 14 | 2 104 |
| 5 | 23:13:25 | 61:25:6.6 | 340 | 0.99 | 1.0 | 15 | 7 103 |
| 6 | 23:14:19.5 | 61:37:45.4 | 82 | 0.26 | 0.8 | 12 | 5 103 |
| 7 | 23:15:36.4 | 61:21:38.9 | 140 | 0.21 | 1.1 | 11 | 4 103 |
| 8bb This is source ‘C’ indicated in Figs. 3 and 5 and discussed in Sec. 3.3. | 23:16:10.8 | 61:22:52.4 | 76 | 0.24 | 0.4 | 12 | 4 104 |
| 9 | 23:16:16.8 | 61:22:16.9 | 160 | 0.10 | 0.5 | 10 | 4 104 |
| 10 | 23:16:17.6 | 61:35:7.1 | 70 | 0.11 | 0.5 | 10 | 2 104 |
| 11 | 23:16:23 | 61:17:55.1 | 75 | 0.21 | 0.6 | 11 | 1 104 |
| 12 | 23:16:24.3 | 61:22:56.2 | 42 | 0.31 | 0.5 | 12 | 1 104 |
| 13 | 23:16:31.3 | 61:18:46.9 | 81 | 0.10 | 1.1 | 10 | 6 103 |
These 13 high-mass Stage E sources are distributed spatially throughout NGC 7538. They are generally visible as the reddest objects in Figure 5 and are highlighted with white circles in that same figure. A more detailed analysis of the cloud structure and source distribution in NGC 7538 is beyond the scope of this first-look paper, but would be interesting to look into in a followup study.
5 Conclusions
We have reported the first results of the Herschel HOBYS observations of the nearby high-mass star-forming region, NGC 7538. The thermal dust emission shows many compact sources distributed along filaments. We have detected nearly 800 compact sources and characterized the SEDs of 224 of them. Of these latter sources, we identify 13 as high-mass dense clump candidates, potential sites of future intermediate- to high-mass star formation. We present the characteristics of these select high-mass dense clump objects which require further follow-up observations to confirm that star formation is underway and determine the source kinematics.
We also report the discovery of a ring of cool thermal dust emission of as-yet unknown origin. With additional data from the JCMT, we further characterize the ring and determine properties of the ring such as its extent and energetics. We look into several possible origin scenarios for the ring, none of which provide a satisfactory explanation. We detect a large number of cold sources along the ring’s filamentary edge.
References
- Anderson et al. (2012) Anderson, L. D., et al. 2012, A&A, 542, 10
- André, Ward-Thompson, & Barsony (1994) André, P., Ward-Thompson, D., & Barsony, M. 1993, ApJ, 406, 122
- André et al. (2008) André, Ph., et al. 2008, A&A, 490, L27
- Beaumont & Williams (2010) Beaumont, C. N., & Williams, J. P. 2010, ApJ, 709, 791
- Bernard et al. (2010) Bernard, J.-P., et al. 2010, A&A, 518, L88
- Bontemps et al. (1996) Bontemps, S., André, P., Terebey, S., & Cabrit, S. 1996, A&A, 311, 858
- Churchwell et al. (2006) Churchwell, E., et al. 2006, ApJ, 649, 759
- Crampton, Georgelin, & Georgelin (1978) Crampton, D., Georgelin, Y. M., & Georgelin, Y. P. 1978, A&A, 66, 1
- Davis et al. (1998) Davis, C. J., Moriarty-Schieven, G., Eislöffel, J., Hoare, M. G., & Ray, T. P. 1998, AJ, 115, 1118
- Frieswijk et al. (2007) Frieswijk, W. W. F., Spaans, M., Shipman, R. F., Teyssier, D., & Hily-Blant, P. 2007, A&A, 475, 263
- Frieswijk et al. (2008) Frieswijk, W. F., et al. 2008, ApJ, 685, L51
- Griffin et al. (2010) Griffin, M., et al. 2010, A&A, 518, L3
- Hennemann et al. (2010) Hennemann, M., et al. 2010, A&A, 518, L84
- Hennemann et al. (2012) Hennemann, M., et al. 2012, A&A, 543, L3
- Hildebrand (1983) Hildebrand, R. H. 1983, QJRAS, 24, 267
- Hill et al. (2011) Hill, T., et al. 2011, A&A, 533, 94
- Hill et al. (2012) Hill, T., et al. 2012, A&A, 542, 114
- Kauffmann & Pillai (2010) Kauffmann, J., & Pillai, T. 2010, ApJ, 723, L7
- Lada (1987) Lada, C. J. 1987, IAUS, 115, 1
- Lada & Lada (2003) Lada, C. J., & Lada, E. A. 2003, ARA&A, 41, 57
- Men’shchikov et al. (2010) Men’shchikov, A., et al. 2010, A&A, 518, L103
- Men’shchikov et al. (2012) Men’shchikov, A., et al. 2012, A&A, 542, 81
- Minier et al. (2013) Minier, V., et al. 2013, A&A, 550, 50
- Moffat et al. (1998) Moffat, A. F. J., et al. 1998, A&A, 331, 949
- Molinari et al. (2008) Molinari, S., et al. 2008, A&A, 481, 345
- Moscadelli et al. (2009) Moscadelli L., et al. 2009, ApJ, 693, 406
- Motte, André, & Neri (1998) Motte, F., André, P., & Neri, R. 1998, A&A, 336, 150
- Motte et al. (2001) Motte, F., et al. 2001, A&A, 372, L41
- Motte et al. (2007) Motte, F., Bontemps, S., Schilke, P., Schneider, N., Menten, K. M., & Broguière, D. 2007, A&A, 476, 1243
- Motte et al. (2010) Motte, F., et al. 2010, A&A, 518, L77
- Nguyen Luong et al. (2011) Nguyen Luong, Q., et al. 2011, A&A, 535, 76
- Ossenkopf & Henning (1994) Ossenkopf, V., & Henning, T. 1994, A&A, 291, 943
- Pickett et al. (1998) Pickett, H. M., et al. 1998, JQSRT, 60, 883
- Pilbratt et al. (2010) Pilbratt, G. L., et al. 2010, A&A, 518, L1
- Poglitsch et al. (2010) Poglitsch, A., et al. 2010, A&A, 518, L2
- Reed (2005) Reed, B. C. 2005, AJ, 130, 165
- Reid & Wilson (2005) Reid, M. A. & Wilson, C. D. 2005, ApJ, 625, 891
- Rivera-Ingraham et al. (2013) Rivera-Ingraham, A., et al. 2013, ApJ, 766, 85
- Roussel (2012) Roussel, H. 2012, arXiv:1205.2576v1
- Roy et al. (2011) Roy, A., et al. 2011, ApJ, 727, 114
- Schneider et al. (2010) Schneider, N., et al. 2010, A&A, 518, 83
- Schneider et al. (2012) Schneider, N., et al. 2012, A&A, 540, L11
- Ungerechts, Umbanhowar, & Thaddeus (2000) Ungerechts, H., Umbanhowar, P., & Thaddeus, P. 2000, ApJ, 537, 221
- Wilson (1985) Wilson, J. R. 1985, in Numerical Astrophysics, ed. J. M. Centrella, J. M. Leblanc, & R. L. Bowers (Boston: Jones & Bartlett), 422
- Wynn-Williams, Becklin, & Neugebauer (1974) Wynn-Williams, C. G., Becklin, E. E., & Neugebauer, G. 1974, ApJ, 187, 473
- Zavagno et al. (2010) Zavagno, A. et al., 2010, A&A, 518, L81