Anomalous metallic state and anisotropic multiband superconductivity in Nb3Pd0.7Se7
Abstract
We report the discovery of superconductivity in Nb3PdxSe7 with a -dependent superconducting transition-temperature as high as K for (middle point of the resistive transition). Needle-like single crystals display anisotropic upper-critical fields with an anisotropy as large as 6 between fields applied along their needle axis (or axis) or along the axis. As for the Fe based superconductors is temperature-dependent suggesting that Nb3Pd0.7Se7 is a multi-band superconductor. This is supported by band structure calculations which reveal a Fermi surface composed of quasi-one-dimensional and quasi-two-dimensional sheets of hole character, as well as three-dimensional sheets of both hole- and electron-character. Remarkably, is observed to saturate at T which is where is the Pauli-limiting field in the weak-coupling regime. The synthesis procedure yields additional crystals belonging to the Nb2PdxSe5 phase which also becomes superconducting when the fraction of Pd is varied. For both phases we find that superconductivity condenses out of an anomalous metallic state, i.e. displaying above similarly to what is observed in the pseudogap-phase of the underdoped cuprates. An anomalous metallic state, low-dimensionality, multi-band character, extremely high and anisotropic s, are all ingredients for unconventional superconductivity.
I Introduction
The Fe chalcogenide compounds, such as Fe1+δSe, Fe1+δSexTe1-x, or the AxFe2-ySe2 (A = Tl, Rb or K) display remarkable superconducting properties. For example, the tetragonal phase of Fe1+δSe (i.e. when displays superconductivity at K only when mcqueen , although it was recently shown that intercalation with Lix(NH2)y(NH3)1-y or K leads to a dramatic enhancement in up to 43 K lucas and 44 K zhang , respectively. For the Fe1+δSexTe1-x series, recent angle resolved photoemission studies suggest a ratio for the superconducting gap to the Fermi energy placing this system at the BCS to BEC crossover, or equivalently, that these are very strongly coupled superconductors kanigel . Finally, the AxFe2-ySe2 is claimed to be close to an orbital-dependent Mott transition yi indicating a certain resemblance with the cuprates, although several studies support the microscopic coexistence of superconductivity with magnetism and concomitant insulating states may .
Recently, we reported the discovery of yet a new transition-metal based anisotropic multi-band superconductor, i.e. Nb2Pd0.81S5, which displays extremely large upper critical fields alan . In contrast to the Fe chalcogenides, this compound crystallizes in the lower symmetry space-group which, according to band structure calculations, leads to a complex Fermi surface (FS) composed of both two-dimensional (2D) and quasi-one-dimensional (Q1D) sheets. The Pd stoichiometry is predicted to play a major role since the calculations indicate that it displaces the Fermi-level favoring nesting among the Q1D FS-sheets for particular wave-vectors, and this would lead to electronic instabilities and possibly to itinerant magnetism alan . Therefore, the Pd fraction is expected to play a role similar to that of F or Co and K in the “1111” and “122” Fe-arsenides respectively, chen ; sefat ; gfchen where variations in their stoichiometry is observed to induce superconductivity or increase the superconducting transition temperature in detriment of antiferromagnetism.
Given its composition and electronic anisotropy, one could expect Nb2Pd0.81S5 to display physical similarities with transition-metal dichalcogenides such as 2-NbS2 or 1-TaS2, or some of the transition metal trichalcogenides as NbSe3. The former two compounds display a charge-density wave (CDW) transition followed by superconductivity at lower temperatures tissen ; ritschel . While the latter displays two transitions towards CDW-phases upon cooling monceau . However, we did not detect any sharp anomaly that could indicate a transition akin to a Peierls instability in Nb2Pd0.81S5, hence we have no evidence for the coexistence of superconductivity with a density-wave like state which is claimed to enhance the superconducting upper-critical fields () in the aforementioned compounds ausloos . Furthermore, and despite the similar values of , Nb2Pd0.81S5 displays remarkably larger s (by a factor of two or more depending on orientation) when compared to either NbS2 pfalzgraf or NbSe2 sanchez and, in contrast to both compounds, it also displays a clear concave down curvature in for -axis. These observations, indicate few similarities between Nb2Pd0.81S5 and the dichalcogenide or trichalcogenide compounds. In addition, as we will see below, the properties of the metallic state of new compounds emerging from Nb2Pd0.81S5 by replacing S with Se are non-Fermi liquid like in the region of temperatures just above in contrast to the aforementioned compounds. This behavior is very prominent in a very narrow range of values for the fraction of Pd, or when , where one observes the emergence of superconductivity from the non-superconducting compounds.
In this manuscript, we show that new families of compounds can be created by varying the chemistry of Nb2Pd0.81S5, leading to new superconducting compounds such as Nb2PdxSe5 and Nb3PdxSe7. It turns out, as shown below, that Nb2PdxSe5 for displays a crossover from metallic to “non-metallic” upon cooling, therefore we show that superconductivity in this compound emerges from an anomalous metallic state upon cooling. This crossover like temperature is observed to decrease as increases (upon variation of ), with the metallic state displaying non-Fermi liquid behavior as a function of the temperature, i.e. with ranging from to . In contrast, the Nb3Pd0.7Se7 compound, with a middle point superconducting transition temperature K, do display Fermi-liquid like metallic behavior (or above 150 K. Nevertheless a mild anomaly centered around 110 K is observed in the resistivity, suggesting also a crossover or perhaps an electronic instability. Although in this compound increases with x or the Pd content, the position of this anomaly remains unaffected by it. Similarly to the Nb2PdxSe5 compounds, superconductivity in the Nb3PdxSe7 series also emerges from a state displaying “non-metallic” character (or ).
For these new chalcogenides, low dimensionality, multi-band effects, anomalous metallic behavior, and as will be discussed below for the case of Nb3Pd0.7Se7, anisotropic and extremely high upper critical fields, suggest an unconventional superconducting state. Here, we focus on the superconducting phase-diagram of Nb3Pd0.7Se7. A detailed account on the dependence of the superconducting phase-diagrams of Nb2PdxSe5 and Nb3PdxSe7 on or the Pd content, will be given elsewhere.
II Experimental
Nb3Pd0.7Se7 was grown via a solid state reaction under an Ar atmosphere: Nb (99.99 %), Pd (99.99 %), and Se (99.999 %) well mixed powders in the ratio of 4:1:10 were heated to a peak temperature of 850 ∘C at a rate of 100 ∘C/h in sealed quartz ampoules, kept for 48 hours and subsequently quenched to room temperature. The obtained single crystals formed thin long needles several millimeters in length, but with cross-sectional areas ranging from m2 up to m2. The stoichiometric composition was determined by energy dispersive X-ray spectroscopy and single-crystal X-ray structure refinement. Two distinct crystallographic phases were identified as resulting from the growth conditions, namely Nb3PdxSe7 and Nb2PdxSe5, with showing superconducting transition temperatures ranging from K up to and K, respectively. The detailed results of our refinements, including the respective atomic positions for typical single-crystals of each phase is given in Appendix A. A conventional four terminal configuration was used for the resistivity measurements which were performed under magnetic-field either by using a Physical Parameter Measurements System (also for heat capacity measurements) or a superconducting magnet coupled to a dilution refrigerator.
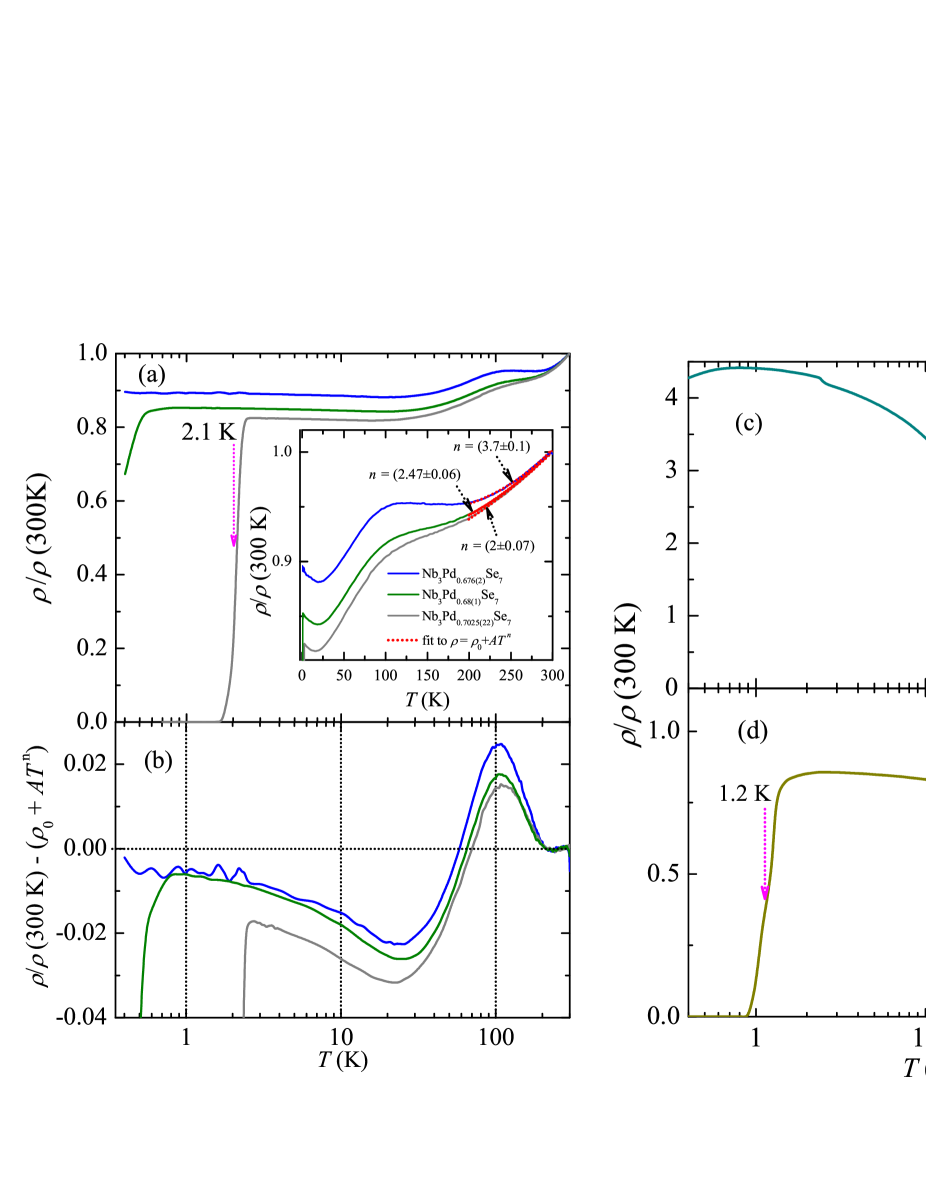
Figures 1 (a) to (d) shows the resistivity normalized by its value at room temperature, i.e. as a function of the temperature (in a logarithmic scale) for five single-crystals resulting from the same synthesis process. These crystals were analyzed through single-crystal -ray diffraction measurements to reveal both their composition and their crystallographic structure. Traces in Figs. 1 (a) and (b) were obtained from crystals belonging to the Nb3PdxSe7 phase, whose Pd content was refined as (blue trace), (green trace), and (grey trace), respectively. The room temperature resistivity of these crystals was found to oscillate between several tenths of cm to a few hundreds of cm. This variability in the actual values of the resistivity can be attributed to the error bars in the determination of their geometrical factors, particularly their thickness which, for example, is approximately 1 m for the superconducting single-crystal shown in Figs. 1 (a) and (b). As seen in the inset of Fig. 1 (a), a broad anomaly is observed in the resistivity around K, indicating either an electronic phase-transition akin to a spin-density wave state seen in the Fe-pnictide superconductors liu or a crossover towards a new electronic regime, such as the pseudogap observed in the cuprates timusk . Notice also that just above the superconducting transition displays an uncharacteristic -dependence for a metal, i.e. with a negative , indicating the existence of a prominent quasiparticle scattering mechanism. Red lines are fits to the power law which yields exponents ranging from 3.7 for the non-superconducting sample, to 2 for the superconducting one, thus suggesting that the superconducting sample displays Fermi-liquid behavior already at high temperatures. The higher exponents for the non-superconducting samples result from the pronounced upturn in the resistivity observed around 110 K. The overall behavior seen in Figs. 1 (a) and (b), i.e. a pronounced change in slope at higher temperatures followed by an uncharacteristic “non-metallic” like behavior at lower temperatures, is remarkably similar to what is seen in the underdoped regime of, for example, La2-xSrxCuO4 takagi , although the resistivity in those compounds follows a linear dependence on temperature at higher temperatures.
Figures 1 (c) and (d) show for two Nb2PdxSe5 single crystals, i.e. respectively for and resulting from the same synthesis process. Notice the pronounced but progressive increase in resistivity below K for the sample, suggesting again a continuous or second-order like electronic phase-transition or perhaps a crossover towards a pseudogap-like regime. Therefore, for both compounds defines a threshold concentration separating superconducting from non-superconducting samples. Remarkably, while the increase in beyond 0.7 induces superconductivity in Nb3PdxSe7 it is observed to suppress superconductivity in Nb2PdxSe5. This suggests that superconductivity is stabilized by small displacements of the Fermi level, or equivalently that in both compounds the Fermi level is located in close proximity to a van Hove singularity. For the Nb2PdxSe5 compounds, we found that the exponent in the power law describing at high temperatures (150 K 300 K) evolves from a value close to 1 when , to in the superconducting samples (or when ) which corresponds to non-Fermi liquid behavior, and cannot be easily ascribed to scattering by phonons. Furthermore, the superconducting transition for Nb2Pd0.67Se5 is preceded by an upturn in the resistivity starting at K. Therefore, for both compounds and for superconductivity condenses out of an unconventional metallic state.
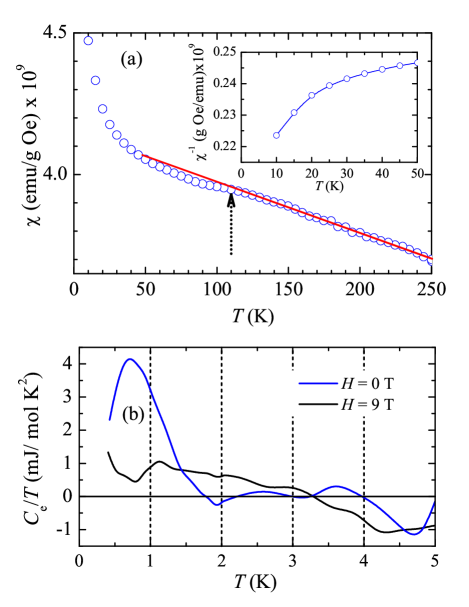
As discussed below as well as in Ref. alan, , the geometry of the FS of these compounds is complex and contains quasi-one-dimensional sheets which are the necessary ingredient for a Peierls-like instability which could lead to itinerant magnetism. The broad anomaly seen around 110 K in Nb3Pd0.7S7 single-crystals could correspond to evidence for such a transition and therefore in Fig. 2 (a) we show the magnetic susceptibility as a function of the temperature for a batch containing hundreds of randomly oriented single-crystals. We used hundreds of crystals, given that a typical individual single-crystal, whose data are shown above, weights only g. We found that this particular batch is composed almost exclusively of crystals belonging to the Nb3PdxSe7 phase. As seen, at higher temperatures varies little showing an unexpected linear dependence in temperature which could be an indication for Pauli-like susceptibility, but with a temperature-dependent density of states at the Fermi level. Around 110 K one observes just a mild deviation from linearity as indicated by the arrow, hence it does not represent a clear evidence for an electronic or magnetic phase-transition. For K, displays a sharp upturn which, as seen in the inset, does not correspond to a Curie tail: the inset plots the inverse of in a limited temperature, i.e. for K, and as seen it is not linear in temperature. Consequently, this upturn cannot be attributed to the presence of impurities and most likely corresponds to evidence for magnetic correlations. A fit to a power law yields a very small exponent suggesting a divergence. Fig. 2 (b), on the other hand, shows the electronic contribution to the heat capacity normalized by the temperature , after the subtraction of a term and for two values of the field, respectively and 9 T. Again, hundreds of single-crystals from one synthesis batch ( mg), therefore of varying stoichiometry, were used for these measurements. A broad anomaly in emerges below K and peaks at K, with its width determined by the distribution of s, as seen in the upper panel. This anomaly is suppressed by the application of an external magnetic-field, as expected for bulk superconductivity. Therefore, our observations clearly indicate bulk superconductivity. We emphasize that the data shown in Fig. 1 corresponds to crystals displaying among the highest s within the batches synthesized by us. In contrast, the heat capacity yields an average value for .
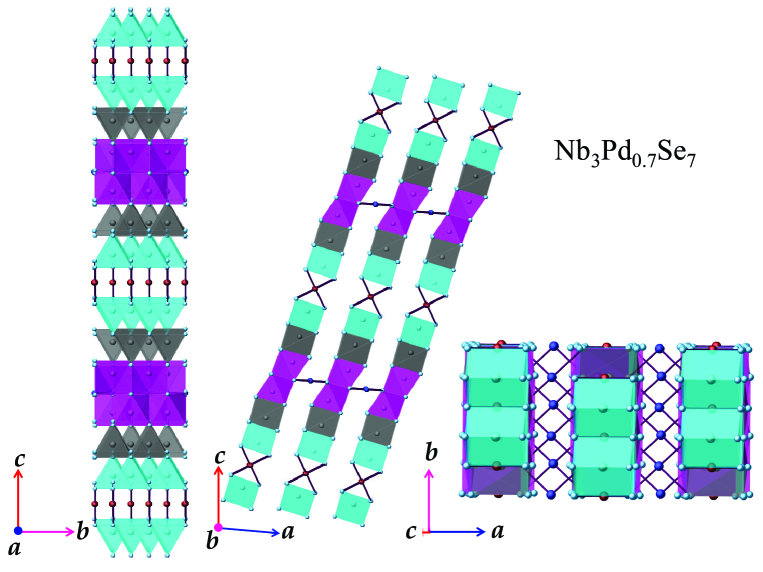
Nb3Pd0.7Se7 crystallizes in the space group (see Fig. 3) and can be described as composed of sheets of a single Nb6PdSe14 basic unit which is comprised of chains formed by square-planar and trigonal-prismatic Se polyhedra which are approximately centered by Pd and Nb atoms, respectively (see Ref. ibers, ). Each chain extends along the [010] direction (needle axis). The Pd(1) atoms center a column of face-to-face square planes. Both Nb(1) and Nb(2) atoms occupy chains of edge-sharing trigonal prisms while the Nb(3) atoms occupy columns of face sharing trigonal prisms. The basic Nb6PdSe14 is formed in such a way that the polyhedra in adjacent columns share their edges. The Nb6PdSe14 layers form via interdigitation of the Nb6PdSe14 units, with the Nb(3) atoms acquiring a seven-coordinate, monocapped trigonal-prismatic environment. The three-dimensional structure results from the stacking of these layers in a closed packed (Se atoms) fashion. The Pd(2) atom occupies a rhombic site between the layers and is square-planar coordinated with the Se(1) atoms.
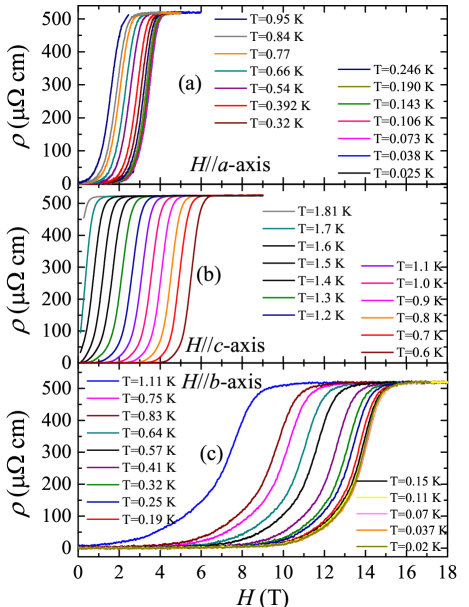
Given the low crystallographic symmetry of Nb3Pd0.7Se7 one expects an anisotropic response for magnetic fields applied along its distinct crystallographic axis. Therefore, we show the resistivity of a second Nb3Pd0.7Se7 single-crystal ( K) for several temperatures and as a function of the magnetic-field applied along the and the axis (Figs. 4 (a) and 4 (b), respectively) and for fields along the or the needle-axis (Fig. 4 (c)). This crystal was placed onto a sapphire substrate and the external field was initially applied perpendicularly to plane (Fig. 4 (a)). Subsequently, the field was rotated by 90∘ with respect to this previous orientation, while remaining perpendicular to needle-axis (Fig. 4 (b)). Subsequently, it was rotated by 90∘ around the axis in order to align the field along the axis (Fig. 4 (c)). As seen, the resistive transitions from the superconducting to the metallic state for the different field orientations reveal rather anisotropic upper-critical fields .
III Discussion
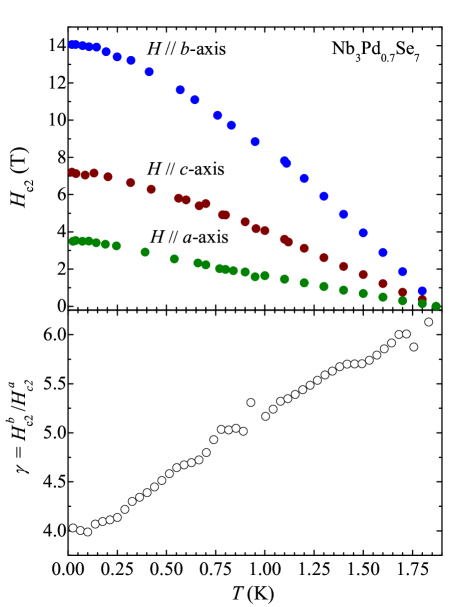
In Figure 5, we display the resulting - phase-diagram, constructed by plotting the middle point of the resistive transitions shown in Fig. 4 as well as from the resistivity as a function of under field (not shown). Remarkably, for fields along the axis saturates at a value of T which is , where is the Pauli limiting field in the weak coupling regime. To put this value in perspective, compare the ratio with the corresponding ratios for Fe1+ySe0.45Te0.55, () tesfay , CeCoIn5 () andrea , URu2Si2 () brison which, according to all evidence, are unconventional and strongly-correlated superconductors. Notice that this ratio for Nb3Pd0.7Se5 also surpasses the respective one for Nb2Pd0.81S5 ( 37 T/6.6 K 5.6) alan , or for the Chevrel-phase PbMo6S8 ( 60 T/13.3 K 4.51) okuda , and obviously the ratio for the widely used Nb3Sn compound ( 30 T/18 K 1.67) nb3sn . Finally, and although the anisotropy for Nb3Pd0.7Se7 is not as high as the one reported for Li0.9Mo6O17, which suggests that this later compound is considerably more quasi-one-dimensional hussey , its ratio still is smaller than the ratio reported here.
Below we show Ginzburg-Landau fittings of the phase-boundary, which for fields along the axis yields an orbital limiting field T and T, therefore suggesting that Nb3Pd0.7Se7 could be a Pauli limited superconductor displaying a very large Maki parameter if one uses both field values resulting from the fittings, or if one uses the actual experimental result T. In any case, these values for are the value required for the observation of the Fulde-Ferrel-Larkin-Ovchinikov-state gruenberg . Below we also show a fit of to the Werthamer-Helfand-Hohenberg formalism whh , indicating that a large value of would fit the boundary, but would require a large spin-orbit coupling implying that this coupling is relevant for this system. Finally, as seen in the lower panel of Fig. 4, the superconducting anisotropy is -dependent as seen in the Fe pnictides/chalcogenides and interpreted as evidence for multi-band effects yuan ; yamamoto .
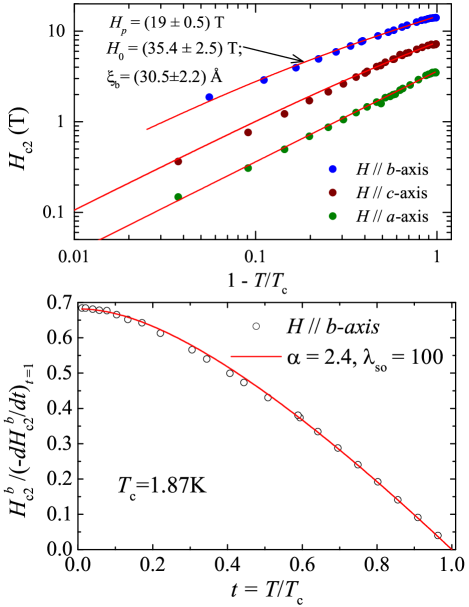
In order to evaluate the contributions of both orbital and Pauli pair-breaking effects for all field orientations we analyze our data at temperatures close to where the Ginzburg-Landau (GL) theory yields alex :
| (1) |
Very close to the critical temperature, , the first paramagnetic term in the left hand side is negligible and Eq. (1) yields the orbital linear Ginzburg-Landau temperature dependence, . At lower temperatures, , the Pauli limiting field dominates the shape of even in the GL domain if . The latter inequality is equivalent to the condition that the Maki parameter is large enough, assuring that the paramagnetic effects are essential. Shown in the upper panel of Fig. 6 are the log-log plots of our as a function of where the red lines are fits to Eq. (1). As seen, for fields along the axis (blue markers) the fitting yields T and T respectively, implying a Maki parameter of 2.6 if one uses both values resulting from the fittings, or if one used the experimental result T as a tentative value for the Pauli limiting field. In any case, such large values for the paramagnetic limiting field relative to would be difficult to understand for a conventional superconductor, suggesting either very strong correlations renormalizing as seen in the heavy-fermions, or an unconventional pairing mechanism, or both. Notice that these values for are the value required for the observation of the FFLO-state gruenberg . For the other two orientations, one obtains similar values for both and . The lower panel of Fig. 6 shows a fit of normalized by the slope of its linear dependence at and as a function of the reduced temperature . Red line is a fit to the Werthamer, Helfand, and Hohenberg formalism whh with a tentative value of the Maki parameter which yields a extremely large value for the spin-orbit coupling parameter . Although it remains unclear how reliable such a large value is, this suggests that the spin-orbit coupling plays a relevant role for this system.
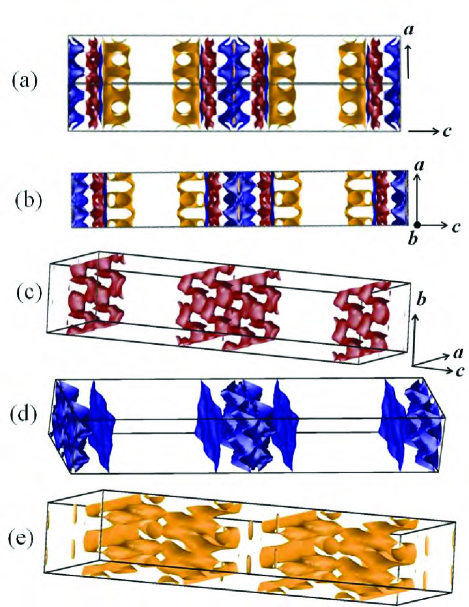
To shed some light about the possible superconducting pairing mechanism in Nb3Pd0.7Se5 we have performed band structure calculations to determine the geometry of the Fermi surface, the results are summarized in Fig. 7. Density functional theory calculations using Wien2K wien2k with the Generalized Gradient Approximation (GGA) gga to the exchange correlation potential were employed to calculate the self-consistent energy eigenvalues at 16,000 k-points in the reciprocal lattice. A doubled cell with one Pd(2) atom removed was used in order to achieve a formula unit of Nb6Pd1.5Se14, resulting in band-folding in the smaller reciprocal space cell. The FSs were calculated using the experimental lattice constants and atomic positions established in this work. The centering symmetry of space group # 12 () was eliminated so that half the Pd at the Wyckoff position could be removed, resulting in a doubled unit cell with formula Nb6Pd1.5Se14, i.e. with slightly more Pd than is incorporated experimentally. As seen in Figs. 7 (c) and (d) the resulting FS is composed of quasi-2D sheets (maroon surfaces) of hole character, and a set of strongly and weakly warped Q1D (blue) sheets of hole character whose geometry is sensitive to the exact Pd content. The complex 3D network itself (golden) seen in Fig. 7 (e), contains both hole-and electron-like orbits. Therefore, given that the resulting FS is composed of multiple sheets, having both electron- and hole-character, this system can indeed be classified as a multi-band superconductor. Spin-polarized calculations show that a ferromagnetic state is stable, with a small moment attributable to some Nb atoms ( 0.27 /Nb(1), 0.20 /Nb(2)) and a polarized, delocalized interstitial density. The stabilization energy is extremely small, and manipulable via variations in the Pd content indicating that the system is in proximity to magnetism. If a spin fluctuation mechanism were in play, might be tunable by varying the stoichiometry as seen here.
IV Summary
In summary, Nb3Pd0.7Se7 is a new chalcogenide based multi-band superconductor, displaying extremely large upper critical-fields, i.e. comparable to those of unconventional strongly correlated heavy-fermion superconductors. The synthesis process also yields crystals of the Nb2PdxSe5 phase which also displays superconductivity. Both compounds display an anomalous metallic behavior, particularly for temperatures above their respective superconducting transitions which bears resemblances with the pseudogap phase of the cuprates. Such anomalous metallic behavior was not observed in Nb5Pd0.81S5 which displays a considerably higher superconducting transition temperature alan . This clearly indicates that the fraction of Pd plays the role of a dopant, i.e. by varying its content one can, for instance, suppress non-metallic states and stabilize superconductivity as observed in the Nb2PdxSe5 series. Notice that this study was confined to a narrow range in , from to where we have shown that small variations in or easily suppress superconductivity in both families of compounds. Therefore, the overall behavior reported here for the Nb3PdxSe7 series is clearly characteristic of an underdoped regime. As we already implied within the Introduction, an anomalous metallic behavior with broad anomalies which cannot be clearly attributed to phase-transitions and which instead suggest crossovers towards new electronic regimes, makes these compounds particularly distinct from the dichalcogenides or the trichalcogenides. Notice, that in quasi-one-dimensional or quasi-two-dimensional systems such as these, both charge-density waves gruner1 coupling to lattice distortions, and spin-density waves gruner2 resulting from electronic correlations lead to sharp, first-order like anomalies in their physical properties such as the resistivity neven , in contrast to what is seen here. In fact, it would seem that these compounds are more akin to the Fe chalcogenide superconductors: for example in the Fe1+ySexTe1-x series the resistivity in the metallic state is known to display a dependence above the superconducting transition which can be suppressed upon careful annealing tesfay .
A complex Fermi surface composed also of quasi-one-dimensional sheets, interplay of superconductivity with an anomalous metallic state, extremely high upper critical fields coupled to multi-band behavior, suggest an unconventional pairing symmetry.
V Acknowledgement
L. B. is supported by DOE-BES through award DE-SC0002613. T. B. and T. S. are supported by DOE-BES through award DE-SC0008832, and by FSU. Funding for M.D.J. was provided by the Office of Naval Research (ONR) through the Naval Research Laboratory’s Basic Research Program. The NHMFL is supported by NSF through NSF-DMR-0084173 and the State of Florida.
Appendix A Appendix: Parameters of Nb2Pd0.67Se5 and Nb3Pd0.7Se7 as derived from the X-ray refinements
| Compound | Nb2Pd0.67Se5 | Nb3Pd0.70Se7 |
|---|---|---|
| Space group | C2/m | C2/m |
| a (Å) | 12.8325(7) | 12.7965(6) |
| b (Å) | 3.39327(18) | 3.40591(17) |
| c (Å) | 15.3859(8) | 21.0370(13) |
| ) | 101.471(5) | 95.530(5) |
| , ) | 90.0 | 90.0 |
| 4 | 4 | |
| (Å3) | 656.59(6) | 912.60(8) |
| (g/cm3) | 6.599 | 6.590 |
| T (K) | 298 | 298 |
| Range | ||
| Reflections | 6162 | 4170 |
| Parameters refined | 52 | 70 |
| Goodness-of-fit | 1.0046 | 1.1150 |
| Nb2Pd0.67Se5 |
| Atom | Site | Occupation | ||||
|---|---|---|---|---|---|---|
| Nb1 | 4i | 1 | 0.07595(4) | 1/2 | 0.17999(3) | 0.0099 |
| Nb2 | 4i | 1 | 0.15288(4) | 0 | 0.37854(3) | 0.0078 |
| Pd1 | 2a | 1 | 0 | 0 | 0 | 0.0124 |
| Pd2 | 2c | 0.348(5) | 0 | 0 | 1/2 | 0.0117 |
| Se1 | 4i | 1 | 0.35036(5) | 0 | 0.48914(3) | 0.0098 |
| Se2 | 4i | 1 | 0.25374(4) | 1/2 | 0.29566(3) | 0.0086 |
| Se3 | 4i | 1 | 0.17536(5) | 0 | 0.09778(4) | 0.0106 |
| Se4 | 4i | 1 | 0.42303(5) | 1/2 | 0.13214(4) | 0.0104 |
| Se5 | 4i | 1 | 0.50041(4) | 0 | 0.32346(4) | 0.0091 |
| Nb3Pd0.70Se7 |
| Atom | Site | Occupation | ||||
|---|---|---|---|---|---|---|
| Nb1 | 4i | 1 | 0.05848(5) | 1/2 | 0.12765(3) | 0.0105 |
| Nb2 | 4i | 1 | 0.11676(5) | 0 | 0.26968(3) | 0.0083 |
| Nb3 | 4i | 1 | 0.16833(5) | 1/2 | 0.41178(3) | 0.0071 |
| Pd1 | 2a | 1 | 0 | 0 | 0 | 0.0126 |
| Pd2 | 2d | 0.393(5) | 0 | 1/2 | 1/2 | 0.0109 |
| Se1 | 4i | 1 | 0.35141(6) | 1/2 | 0.49292(3) | 0.0089 |
| Se2 | 4i | 1 | 0.16650(6) | 0 | 0.06770(4) | 0.0108 |
| Se3 | 4i | 1 | 0.40985(6) | 1/2 | 0.09657(4) | 0.0103 |
| Se4 | 4i | 1 | 0.22426(6) | 1/2 | 0.20964(4) | 0.0091 |
| Se5 | 4i | 1 | 0.28063(6) | 0 | 0.35319(3) | 0.0078 |
| Se6 | 4i | 1 | 0.47084(6) | 0 | 0.23370(3) | 0.0083 |
| Se7 | 4i | 1 | 0.02204(6) | 0 | 0.37263(3) | 0.0088 |
References
- (1) T. M. McQueen, Q. Huang, V. Ksenofontov, C. Felser, Q. Xu, H. Zandbergen, Y. S. Hor, J. Allred, A. J. Williams, D. Qu, J. Checkelsky, N. P. Ong, and R. J. Cava, Phys. Rev. B 79, 014522 (2009).
- (2) M. Burrard-Lucas, D. G. Free, S. J. Sedlmaier, J. D. Wright, S. J. Cassidy, Y. Hara, A. J. Corkett, T. Lancaster, P. J. Baker, S. J. Blundell, S. J. Clarke, Nat. Mat. 12, 15, (2013).
- (3) A. -m. Zhang, T. -l. Xia, K. Liu, W. Tong, Z. -r. Yang, and Q. -m. Zhang, Sci. Rep. (UK) 3, 1216 (2013).
- (4) Y. Lubashevsky, E. Lahoud, K. Chashka, D. Podolsky and A. Kanigel, Nat. Phys. 8, 309 (2012).
- (5) M. Yi, D. H. Lu, R. Yu, S. C. Riggs, J. -H. Chu, B. Lv, Z. K. Liu, M. Lu, Y. -T. Cui, M. Hashimoto, S.K. Mo, Z. Hussain, C. W. Chu, I. R. Fisher, Q. Si, and Z. -X. Shen, Phys. Rev. Lett. 110, 067003 (2013).
- (6) A. F. May, M. A. McGuire, H. Cao, I. Sergueev, C. Cantoni, B. C. Chakoumakos, D. S. Parker, and B. C. Sales, Phys. Rev. Lett. 109, 077003 (2012).
- (7) Q. Zhang, G. Li, D. Rhodes, A. Kiswandhi, T. Besara, B. Zeng, J. Sun, T. Siegrist, M. D. Johannes, and L. Balicas, Sci. Rep. (UK) 3, 1446 (2013).
- (8) X. H. Chen, T. Wu, G. Wu, R. H. Liu, H. Chen, D. F. Fang, Nature 453, 761 (2008);
- (9) A. S. Sefat, R. Y. Jin, M. A. McGuire, B. C. Sales, D. J. Singh, D. Mandrus, Phys. Rev. Lett. 101, 117004 (2008).
- (10) G. F. Chen, Z. Li, G. Li, W. Z. Hu, J. Dong, J. Zhou, Z. D. Zhang, P. Zheng, N. L. Wang, J. L. Luo, Chinese Phys. Lett. 25, 3403 (2008).
- (11) For recent results see, V. G. Tissen, M. R. Osorio, J. P. Brison, N. M. Nemes, M. García-Hernandez, L. Cario, P. Rodière, S. Vieira, and H. Suderow, Phys. Rev. B 87, 134502 (2013).
- (12) For recent results see, T. Ritschel, J. Trinckauf, G. Garbarino, M. Hanfland, M. v. Zimmermann, H. Berger, B. Büchner, and J. Geck, Phys. Rev. B 87, 125135 (2013).
- (13) See, for example, A. A. Sinchenko, and P. Monceau, Phys. Rev. B 87, 045105 (2013) and references therein.
- (14) A. M. Gabovich, A. I. Voitenko, and M. Ausloos, Phys. Rep. 367, 583 (2002).
- (15) B. W. Pfalzgraf, and H. Spreckels, J. Phys. C: Solid State Phys. 20, 4359 (1987).
- (16) D. Sanchez, A. Junod, J. Muller, H. Berger, F. Levy, Physica B 204, 167 (1995); N. Toyota, H. Nakatsuji, K. Noto, A. Hoshi, N. Kobayashi, Y. Muto, Y. Onodera, J. Low Temp. Phys. 25, 485 (1976).
- (17) D. A. Keszler and J. A. Ibers, J. Am. Chem. Soc. 107, 8119 (1985).
- (18) See, for example, R. H. Liu, G. Wu, T. Wu, D. F. Fang, H. Chen, S. Y. Li, K. Liu, Y. L. Xie, X. F. Wang, R. L. Yang, L. Ding, C. He, D. L. Feng, and X. H. Chen, Phys. Rev. Lett. 101, 087001 (2008).
- (19) T. Timusk, and B. Statt, Rep. Prog. Phys. 62, 61 (1999).
- (20) H. Takagi, B. Batlogg, H. L. Kao, J. Kwo, R. J. Cava, J. J. Krajewski, and W. F. Peck, Jr. Phys. Rev. Lett. 69, 2975 (1992).
- (21) T. Gebre, G. Li, J. B. Whalen, B. S. Conner, H. D. Zhou, G. Grissonnanche, M. K. Kostov, A. Gurevich, T. Siegrist, and L. Balicas, Phys. Rev. B 84, 174517 (2011).
- (22) A. Bianchi, R. Movshovich, C. Capan, P. G. Pagliuso, and J. L. Sarrao, Phys. Rev. Lett. 91, 187004 (2003).
- (23) J. P. Brison et al., Physica C 250, 128 (1995); J. P. Brison et al., Physica B 199, 70 (1994).
- (24) K. Okuda, M. Kitagawa, T. Sakakibara, and M. Date, J. Phys. Soc. Jpn. 48, 2157 (1980).
- (25) B. T. Matthias, T. H. Geballe, S. Geller, and E. Corenzwit, Phys. Rev. 95, 1435 (1954); R. M. Scanlan, A. P. Malozemoff, and D. C. Larbalestier, P. IEEE 92, 1639 (2004).
- (26) J. -F. Mercure, A. F. Bangura, Xiaofeng Xu, N. Wakeham, A. Carrington, P. Walmsley, M. Greenblatt, and N. E. Hussey Phys. Rev. Lett. 108, 187003 (2012).
- (27) L. W. Gruenberg and L. Gunther, Phys. Rev. Lett. 16, 996 (1966).
- (28) A. Gurevich, Phys. Rev. B 82, 184504 (2010).
- (29) N. R. Werthamer, E. Helfand, and P. C. Hohenberg, Phys. Rev. 147, 295 (1966).
- (30) H. Q. Yuan, J. Singleton, F. F. Balakirev, S. A. Baily, G. F. Chen, J. L. Luo, N. L. Wang, Nature 457, 565 (2009).
- (31) A. Yamamoto, J. Jaroszynski, C. Tarantini, L. Balicas, J. Jiang, A. Gurevich, D. C. Larbalestier, R. Jin, A. S. Sefat, M. A. McGuire, B. C. Sales, D. K. Christen, D. Mandrus, Appl. Phys. Lett. 94, 062511 (2009).
- (32) P. Blaha, K. Schwarz, P. Sorantin, and S. B. Trickey, Comput. Phys. Commun. 59, 399 (1990); K. Schwarz and P. Blaha, Comput. Mater. Sci. 28, 259 (2003).
- (33) J. P. Perdew, S. Burke, and M. Ernzerhof, Phys. Rev. Lett. 77, 3865 (1996).
- (34) G. Grüner, Rev. Mod. Phys. 60, 1129 (1988).
- (35) G. Grüner, Rev. Mod. Phys. 66, 1 (1994).
- (36) See, for example, N. Biškup, S. Tomić, and D. Jérome, Phys. Rev. B 51, 17972 (1995).