Comprehensive Measurement of Neutron Yield Produced by 62 MeV Protons on Beryllium Target
Abstract
A low-power prototype of neutron amplifier, based on a 70 MeV, high current proton cyclotron being installed at LNL for the SPES RIB facility, was recently proposed within INFN-E project. This prototype uses a thick Beryllium converter to produce a fast neutron spectrum feeding a sub-critical reactor core. To complete the design of such facility the new measurement of neutron yield from a thick Beryllium target was performed at LNS. This measurement used liquid scintillator detectors to identify produced neutrons by Pulse Shape Discrimination and Time of Flight technique to measure neutron energy in the range 0.5-62 MeV. To extend the covered neutron energy range 3He detector was used to measure neutrons below 0.5 MeV. The obtained yields were normalized to the charge deposited by the proton beam on the metallic Beryllium target. These techniques allowed to achieve a wide angular coverage from 0 to 150 degrees and to explore almost complete neutron energy interval.
I Introduction
Despite the advent of alternative sources nuclear fission remains one of the main techniques of energy production. Limited availability of fissile materials and difficulties in nuclear waste disposal call for research on fast neutron reactors. The interest for fast neutrons stems from the fact that they induce fission in broader number of elements while suppressing capture processes leading to high toxicity waste build-up. In particular, minor actinides like 241Am, 244Cm etc., have a fission threshold of about 0.5 MeV, therefore only fast neutrons can burn them out. Accelerator Driven System (ADS) [1] represents a promising solution to this problem. The ADS consists of a fast sub-critical reactor fed by an external neutron source. External neutron source of sufficiently high intensity can be generated by a particle accelerator or by a fusion reactor.
Inspired by the upcoming installation of a high power proton cyclotron at the Laboratori Nazionali di Legnaro of INFN for the SPES project [2], the conceptual design of a low-power ADS prototype for research purposes has been developed in the framework of INFN-E project [3]. It is based on 0.5 mA, 70 MeV proton beam impinging on a thick Beryllium target and fast sub-critical core, consisting of solid lead matrix and 60 fuel elements, enriched to 20% with 235U. Both, the production target and reactor core, are cooled by a continuous helium gas flow. The ADS is expected to have an effective neutron multiplication factor , neutron flux n/cm2/s and thermal power of 130 kW at 200∘ C. Such facility would allow to study the kinetics and dynamics of the fast reactor core, the burn-out and transmutation of radioactive wastes, as well as issues related to system safety and licensing.
The choice of the production target material is determined by the low beam energy of the cyclotron. 9Be bombarded by protons, in fact, provides an abundant neutron source. The design of the proposed ADS requires an accurate knowledge of neutron yield produced by the 70 MeV proton beam on the 9Be target. The existing data in the given energy range are rather scarce and incomplete. The integrated yield at 70 MeV was measured in Ref. [4], while differential yields for few angles were measured at various beam energies in Refs. [5, 6, 7, 8, 9, 10, 11]. This lack of data demanded a dedicated measurement of neutron yield produced by the proton beam on a thick 9Be target. The measurement was performed using the superconducting cyclotron [12] at the Laboratori Nazionali del Sud (LNS) of INFN.
In this article we describe a number of selected topics on detectors used in the present experiment and on the data analysis. More complete information about this measurement, the comparison to various simulation codes and tabulated experimental data can be found in Ref. [13].
II Detector Description
Neutron detectors for the present experiment were made as 4 cm long Aluminum cylindrical cells filled with liquid scintillator. In order to measure neutron yields at two different distances from the target, keeping the same solid angle, two different cell diameters were chosen. Four cells, used as far detectors, had the diameter of 4.6 cm (large detectors) and other four, used as near detectors placed at half distance from the target, had a diameter of 2.3 cm (small detectors).
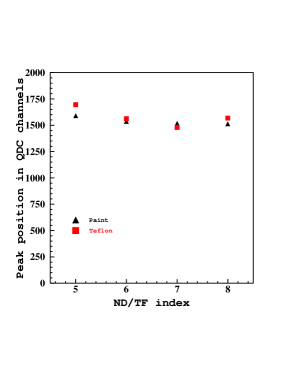
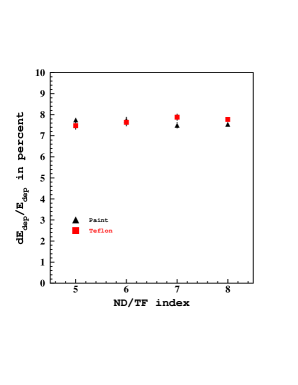
To enhance light yield on photon sensors, the cell Aluminum walls were covered with a light diffuser. In order to select the best diffuser material a comparison of light yields of two detector modifications was performed. This was done only for the small detectors because they were designed for low light yield signals. To this end small detectors were manufactured in two versions: with EJ520 paint diffuser and with Teflon reflector. Backward Compton scattering spectra were measured in the same conditions (same PMT and QDC channel) using a source and the position and the width of the main peak were compared. The results shown in Fig. 1 demonstrated that within the systematic precision (of about 0.5% on the peak width) the two reflectors were equivalent. This was compatible with a difference in the number of detected photoelectrons lower than 12%, which was close to the expected 17% from Ref. [14].
The cells were filled in Ar/N2 atmosphere with EJ301 liquid scintillator, having a good Pulse Shape Discrimination (PSD, see next section) capability. The liquid scintillator did not fill the entire cell volume, leaving a small bubble of Ar/N2 for a possible thermal expansion. The total amount of scintillator in each cell was measured by a comparison of full to empty cell weights, in order to keep a minimum empty expansion volume of 4%.
Each cell was sealed by a 4 mm thick borosilicate glass, coupled to light sensor by optical grease. As light sensors we selected Electron Tubes Enterprise PMTs 9954 with high linearity voltage dividers C649. The choice was mainly determined by a good overall quantum efficiency, extending to the red region. This was particularly important for PSD [15].
II-A Pulse Shape Discrimination Optimizations
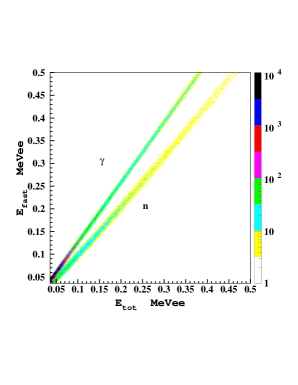
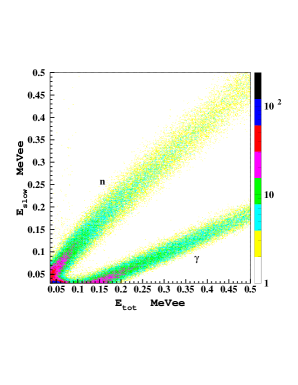
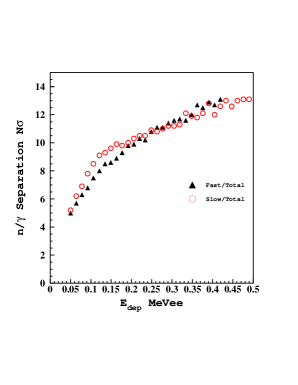
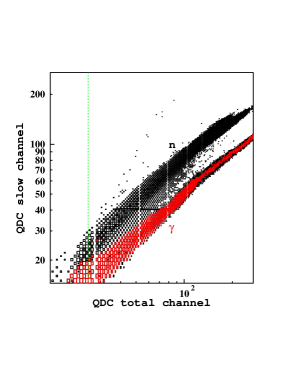
The proton beam interacting with the Beryllium target produces not only neutrons but also s. s can be produced at the time of the proton interaction (prompt s), or when a neutron interacts with surrounding materials (delayed s). To eliminate the background Time of Flight (mostly for prompt s) and PSD were used. PSD is based on the dependence of the scintillation component superposition from the local energy deposition density. In our setup PSD was performed by a comparison of fully integrated signal (Total) and partially integrated signal. One can choose to integrate either the peak of the signal (Fast) or its tail (Slow). For small cells we compared these two methods to identify the best one. The two obtained PSD plots are shown in Fig. 2. We quantified these separations in terms of number of as a function of the total deposited energy as shown in Fig. 3. We found that the integration of the signal tail was providing the best PSD in the low deposited energy range, where separation is typically more difficult due to the lower amount of scintillation light.
II-B Threshold Optimization
To maximize detector efficiency and to reduce the corresponding systematic uncertainty, a threshold as low as 10 KeVee was desirable, in particular for small cells. For this purpose the large and small detector signals were handled in different ways.
Large detectors were designed to cover the entire energy range of the experiment up to 60 MeVee. The signal from PMT of a large detector was split in three parts by a passive splitter:
-
•
1/9 were amplified by a Philips Scientific 771 amplifier and sent to GANELEC FCC8 CFD input,
-
•
2/9 were directly connected to a QDC input for the Total deposited energy integration,
-
•
2/3 had the cable delay reduced on 50 ns with respect to 2/9, and were connected to another QDC input for integration of the Slow part of the signal.
In this configuration the QDC Full Scale (FS) was corresponding to the upper limit of PMT voltage divider linearity range (8 V). The Slow QDC charge had a similar magnitude to the Total one, allowing for a good PSD precision. Adjusting PMT gain to extend the covered deposited energy interval up to 60 MeVee the minimal discriminator threshold of 8 mV was found to correspond to 200 keVee.
For the small cells, which were designed to cover a deposited energy range up to 0.5 MeVee, the configuration was different. The PMT signal was first amplified and integrated by Ortec 454 TFA with timing constant ns. Then it was split in three parts by a passive splitter:
-
•
1/9 were connected to QDC input for the Total deposited energy integration,
-
•
2/9 were sent to GANELEC FCC8 CFD input,
-
•
2/3 were anticipated by 50 ns and were connected to another QDC input for integration the Slow part of the signal.
The main limitation in this case was imposed by the TFA output linearity range (6 V). Therefore, PMT gains were adjusted by means of 137Cs source to provide about 1 V signals for 0.5 MeVee deposited energy. This configuration allowed to achieve thresholds as low as 13 keVee. Moreover, the integration of the signal by TFA reduced the triggering on the PMT intrinsic noise to acceptable level ( Hz).
III Data Acquisition System
A CAMAC based Data AcQuisition system (DAQ) had been developed for this measurement. The system used LeCroy 8901A GPIB-to-CAMAC interface crate controller for communication with Linux PC, equipped with National Instruments PCI-GPIB+ board. GPL Linux-GPIB driver was used as GPIB API. The overall system speed was limited by the 8901A controller data transfer rate in block mode of 0.45 Mb/s (1.5 Mb/s for PCI-GPIB+ board).
On the CAMAC side we used 11-bit LeCroy 4300B FERA based system with ECL bus readout on two alternating buffer memories. To improve readout speed we setup ECL bus configuration connecting 4300B QDC to two 4302 LeCroy memory modules through the LeCroy 4301 FERA Driver. ECL bus allows for data transfer rate up to 20 Mb/s, well matched to 10 s QDC dead time. An approximate scheme of DAQ system used in this experiment is shown in Fig. 4.
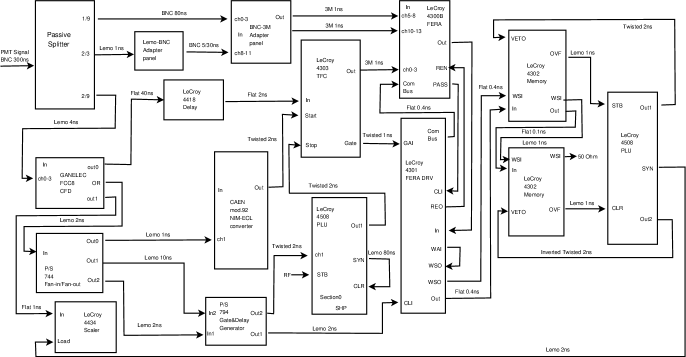
A hit in one of four detectors connected simultaneously to the DAQ system triggered FERA QDC integration within 250 ns Gate. The trailing edge of the Gate signal started the data conversion (8.5 s), followed by zero suppression (2.5 s) and data readout through ECL bus (1.5 s). To avoid DAQ blocking on incomplete conversion events a Clear command was issued after every conversion by means of the Gate signal, delayed by 13 s by a Philips 794 Gate and Delay Generator.
The mechanism of memory switching and readout was based on their Overflow signals connected to LeCroy 4508 PLU. When the number of written words in memory reached 15360 it rose Overflow level. The PLU instantly (20 ns) set a veto on the memory in overflow state and opened the second memory for write access and so on, alternating data writing from one memory to another. This is achieved by connecting one memory Overflow signal to PLU Strobe and the other to its Clear and configuring the two PLU outputs to generate logical level vetoing the full memory.
The complete readout of 15360 16-bit data words from the memory in block mode requires about 70 ms. To avoid additional DAQ dead times this has to be smaller than the memory filling time. Therefore, the overall event rate of our four-detector system is limited by kHz at 25% dead time.
IV Experimental Setup
A proton beam of 62 MeV from LNS superconducting cyclotron was delivered in the MEDEA experimental hall with a beam current of 30-50 pA. In these conditions the single detector rate was below a few kHz. The cyclotron beam structure (RF=40 MHz) was modified by suppressing four bunches out of five. In this way 1.5 ns wide beam bunches arrived on the target with period of 125 ns. The target consisted of a solid, 3 cm thick 9Be cylinder with 3.5 cm diameter installed at the end of a 1 m long last section of beamline, made of 3 mm thick carbon fiber to minimize secondary s. The target thickness was chosen to ensure the complete absorption of 70 MeV proton beam. The electric charge deposited by the beam on the target was measured by a digital current integrator and used for the absolute normalization of the data. Two different current integrators were used during the experiment for comparison: Ortec 439 and 1000C of Brookhaven Instruments Corporation.
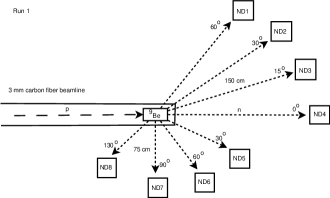
The neutrons produced in the target were measured by ToF technique. To this end RF signal from cyclotron was used as the reference time . Eight neutron detectors were installed simultaneously on the same height of the beamline at different angles and different distances around the target as shown for example in Fig. 5. Hence, the neutron kinetic energy was obtained from the hit time in the liquid scintillator as following:
| (1) |
where is the speed of light and is the neutron mass. The absolute value of the time difference was determined from the prompt ToF.
V Data Analysis
V-A DAQ Dead Time
Each DAQ system stored the data from four independent detectors installed at different polar angles. No on-line event pattern recognition or zero suppression were used in this experiment. The identification of trigger channel was performed during off-line analysis. The first in time detector hit, corresponding to largest TDC value above pedestal, identified the trigger channel. Only the trigger channel data were selected in further analysis. The other, non-trigger channels, were considered only for estimates of multiple trigger events and for monitoring of pedestals. The probability of simultaneous hits in more than one detector at a few kHz overall rate within 250 ns time interval covered by FERA Gate was negligible. The cross talk between neighboring discriminator channels was generally below . However, in some particular runs taken at small angles (0 or 5 degrees), where the ratio of event rates in the two neighborhood detectors was very large and the average signal amplitude in trigger channel high, the cross talk reached 4% for small detectors and 20% for large detectors. To correct for this effect the number of events having a secondary, non-trigger, TDC value above TDC pedestal peak was extracted for each run by identifying the trigger hit as the one having the largest deposited energy. Finally the live-time correction was evaluated in each run as the ratio between the number of recorded events and the number of trigger events recorded by the scalers corrected for the cross talk events:
| (2) |
and the corresponding DAQ dead time:
| (3) |
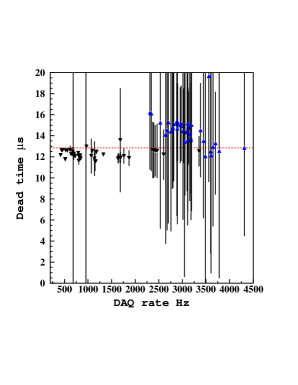
The obtained DAQ dead times varied from 11 to 16 s, a value compatible with FERA integration time.
From the measured total beam charge deposited on the target the total number of protons on target was obtained. This was performed correcting the collected charge for DAQ live-time fraction :
| (4) |
where is the elementary charge.
V-B Neutron Identification
Neutron hits in the detectors were identified by means of PSD. The determination of the optimal cut was performed by fitting the PSD distributions for s and neutrons shown, for example, in Fig. 7. In fact, the data taken with beam off represent a pure sample of s, allowing to determine the mean and the width of s PSD distribution. To obtain the neutron PSD distribution we subtracted s distribution from beam-on data. Then, for each deposited energy we calculated the pulse tail value (QDC Slow) lying in between and neutron distributions which minimized the contamination and inefficiency. Here we assumed both distributions being Gaussians. The obtained set of points determined the optimal PSD cut curve.
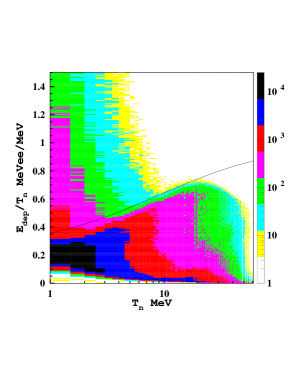
At small neutron energies the relative contribution of s in the total yield increases. Moreover, the PSD becomes less efficient in rejecting them. An additional cut on the correlation between the neutron energy reconstructed from Time-of-Flight and deposited energy improves -rejection. Indeed, the energy deposited in the liquid scintillator has to be smaller than the maximum deposited energy corresponding to neutrons of given kinetic energy . The maximum deposited energy as a function of neutron kinetic energy was parametrized from the data as shown in Fig. 8. Events with deposited energy above this maximum were rejected.
V-C Efficiency Evaluation
The efficiencies of neutron detectors were obtained by means of Geant4.9.5-p01 Monte Carlo simulations and verified in a dedicated measurement. Before making simulations we verified that the elastic and inelastic cross sections of neutron scattering on hydrogen and carbon, implemented in Geant4, were in agreement with ENDF.VII and EXFOR data. We noticed that the use of G4CHIPSElastic model for MeV requires the initialization of G4NeutronElasticXS database to be called before HPElasticData. In the opposite case, the lower precision G4NeutronElasticXS data substitute HPElasticData in the entire kinematic range.
Measurements of the absolute efficiency were performed in the same experimental setup used for detector calibrations. The technique developed in Refs. [16, 17] was employed. This consists in a coincidence measurement of the neutron and from the same fission. Liquid scintillator neutron detectors were placed at the distance of 50 cm (100 cm for large cells) from a spontaneous fission 252Cf source, while s were measured by a BaF2 crystal, to which the fission source was directly attached. Per each fission 252Cf source emits neutrons and a large number of s ( with keV [18]). The BaF2 crystal has a high efficiency for s, while its neutron efficiency is an order of magnitude lower [16]. Moreover, applying PSD on the liquid scintillator signal the probability to detect a instead of the neutron drops at least by an order of magnitude. Assuming that these contaminations are negligible, the absolute efficiency of the liquid scintillator neutron detector is given by:
| (5) |
where is the number of measured coincidences as a function of , obtained from the time difference between liquid scintillator and BaF2 hits, is the total number of BaF2 triggers, is the acceptance of liquid scintillator and is the 252Cf neutron spectrum [19]. However, we noticed that the measured efficiency was increasing with BaF2 threshold. Because of relatively small contribution of the fast component in BaF2 scintillator signal for low deposited energy hits, the discriminator was perhaps triggering on the slow component, almost 1 s later. Therefore we increased BaF2 threshold value until saturation in the measured efficiency was observed. The BaF2 threshold energy at which saturation manifested itself was MeV. At such threshold the mean number of s per fission is about 2.
The obtained efficiency for the small detector is shown in Fig. 9. The measured efficiency was found to be in good agreement with Geant4 simulations over entire accessible energy range, except for MeV. We verified with further, more detailed, Geant4 simulations that the reason for this deviation was an incomplete subtraction of the neutron rescattering from detector supports (shown in upper plot of Fig. 9 by the blue histogram). The rescattering background was measured using a 50 cm long and 4.6 cm in diameter iron shadow bar installed between 252Cf source and neutron detector. However, the BaF2 detector, used to detect s from 252Cf fission, was installed on a fairly wide wooden table, rescattering from which produced neutrons absorbed by the shadow bar. In this way the background subtraction by means of the shadow bar was incomplete. The relative contribution of this background drops rapidly with the neutron energy and already at MeV it becomes smaller than systematic uncertainty.
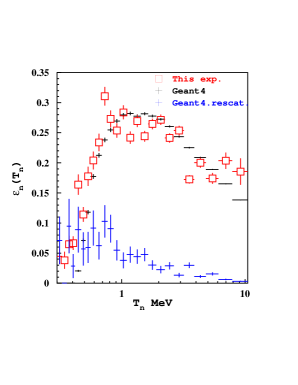

In order to avoid large systematic uncertainties only energy region where the efficiency exceeded 3% was selected for the data analysis.
V-D Neutron Yield
The two-fold differential neutron yield was extracted from the number of measured neutron hits in the detector as following:
| (6) |
where is the total number of incident protons on target, is the neutron detection efficiency obtained in Geant4 simulations, and are neutron kinetic energy and emission angle with respect to the beamline, respectively. is the neutron energy bin size and is the detector solid angle.
In order to cover the entire measured energy range we combined the data from small and large detectors. The maximum deposited energy measurable with small detectors was 0.5 MeVee, corresponding to the maximum neutron energy of about 2 MeV. Neutrons with energies above 2 MeV were also measured in small detectors, but being their maximum deposited energy out of the DAQ range, it was not possible to apply PSD and maximum deposited energy cut to the corresponding events. From the other side the efficiency of large detectors drops rapidly below 2 MeV, leading to a large systematic uncertainty on the observed yield. Therefore, we selected small detector data at MeV and large detector data at MeV. In the overlap region two detectors demonstrate fairly good agreement with average deviation of the order of 10%.
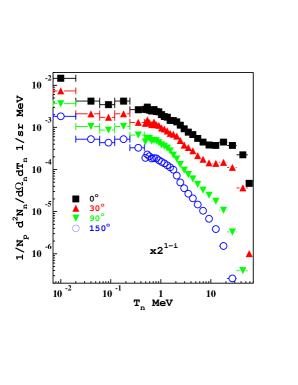
Examples of obtained yields are shown in Fig. 10 as a function of neutron energy. At low neutron energy the yields measured by liquid scintillators were extended to the region MeV by means of 3He detector data described below. The energy dependence is given by exponential fall-off with a bump-like high energy shoulder observed at .
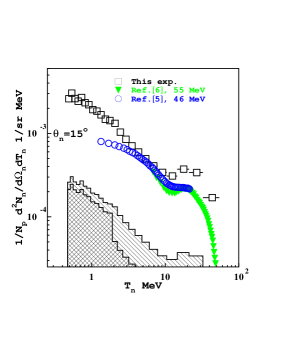
The comparison of yields measured at 15∘ to world data at beam energies nearby 62 MeV is shown in Fig. 11. The data from Ref. [6], taken at somewhat lower beam energy, though exhibiting similar structure are suppressed at high by the available phase space. Instead, the data from Ref. [5] taken at even lower beam energy have the low-energy behavior incompatible with our distribution.
V-E 3He and SiLiF Data
The energy range MeV was measured by two different detectors: 50 cm long, 5 cm in diameter, 2 bar 3He tube (Canberra 150NH50/5A) and 300 m thick Micron MSX09 silicon detector attached to a plexiglass film covered from detector side with 1.5 m of 6LiF converter (SiLiF). Signals from these two detectors were amplified by charge preamplifiers (ACHEM7F for 3He and Ortec 142A for SiLiF) and then by Ortec 672 spectroscopy amplifier. The amplified pulses were digitized by the same DAQ system using 12-bit SILENA 4418 peak sensing ADC.
These detectors were installed on the same supports used for liquid scintillators. From liquid scintillator data we had seen that the low energy neutron flux is isotropic, therefore we measured only few angles: 70 and 90 degrees for 3He tube and 130 degrees for SiLiF detector. The distance to the target was chosen to be 64 cm for 3He tube and 69 cm for SiLiF detector.
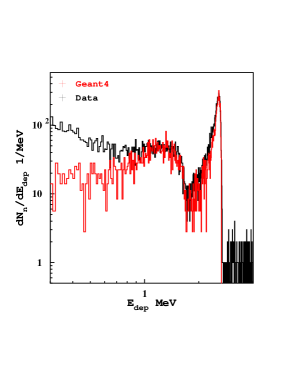
The response of both detectors to thermalized neutrons from AmBe source was measured for the purpose of ADC calibration. The comparison of these calibration data to Geant4 simulations for SiLiF detector is shown in Fig. 12. Except for the MeV region, data and simulations were found to be in good agreement. The enhancement in the data at MeV is due to background, not included in the simulations.
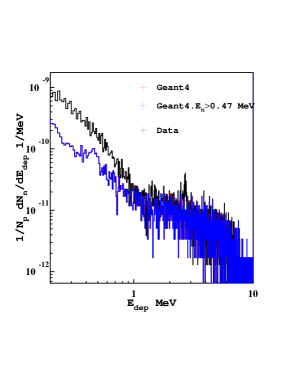
The SiLiF detector data taken during the experiment are shown in Fig. 13 in comparison to Geant4 simulations performed using the neutron yield measured by liquid scintillators. In the energy range MeV we obtain good agreement between data and simulations, except for the small peak at 2.7 MeV in the data. This peak is likely to be due to the environmental background of thermal neutrons, not measured for SiLiF detector. In the low energy region we observe background, similar to the one seen in calibration data. Geant4 simulations showed that for the fast neutron spectrum of this experiment the contribution of the neutron conversion in 1.5 m 6LiF layer is negligible with respect to the scattering off 300 m silicon bulk.
3He detector had unfavorable ratio of lateral surface to the detection window surface: about 40. In order to reduce the environmental background it was wrapped in 1 mm thick Cd sheet. The remaining background was measured by means of 50 cm long iron shadow bar with 1 mm thick Cd sheet added at the end to absorb neutrons thermalized inside the shadow bar. The obtained spectrum was found to be in good agreement with Geant4 simulations and with liquid scintillator data. The yield obtained from 3He data was used in Fig. 10 to extend the covered energy range below 0.47 MeV.
VI Conclusions
Two-fold differential neutron yield produced by 62 MeV proton beam off a thick, fully absorbing 9Be target was measured in complete energy range and almost complete angular interval. Data precision is limited to about 10% by systematic uncertainties on the detector efficiency and absolute normalization.
These data extend significantly the kinematic coverage of the world database in the 50-100 MeV beam energy range. The data were found to be in good agreement with existing world data, except for Ref. [5] which exhibited different low energy trend. More details on this experiment and comparison of our data to MCNP, FLUKA and Geant4 simulations are given in Ref. [13].
Acknowledgment
Authors would like to acknowledge excellent support provided during the experiment by the accelerator staff and technical services of Laboratori Nazionali del Sud. We also want to acknowledge the useful discussions with P. Mastinu from Legnaro National Laboratory, about the use of carbon fiber for the last beamline section. This work was supported by the Istituto Nazionale di Fisica Nucleare INFN-E project.
References
- [1] C. Bowman, Ann. Rev. of Nucl. and Part. Sci., vol. 48, p. 505, 1998.
- [2] L. Calabretta et al., “Status of the spes project: a neutron rich isol facility for re-accelerated ribs,” in 3rd International Particle Accelerator Conference (IPAC 2012), ser. Conf. Proc., V. Suller, Ed. New Orleans: Academic, 2012.
- [3] G. Ricco et al., “Leads, conceptual design report,” 2012. [Online]. Available: http://www.ge.infn.it/opisso/CDR/cdr.htm
- [4] I. Tilquin et al., Nucl. Instr. and Meth. A, vol. 545, p. 339, 2005.
- [5] F. Waterman et al., Med. Phys., vol. 6, p. 432, 1979.
- [6] S. Johnsen, Med. Phys., vol. 4, p. 255, 1977.
- [7] H. Almos et al., Med. Phys., vol. 4, p. 486, 1977.
- [8] P. Heintz et al., Med. Phys., vol. 4, p. 250, 1977.
- [9] M. Meier et al., Nucl. Scien. Eng., vol. 102, p. 310, 1989.
- [10] R. Madey et al., Med. Phys., vol. 4, p. 322, 1977.
- [11] G. Harrison et al., Med. Phys., vol. 7, p. 348, 1980.
- [12] A. Celentano et al., “Measurement of neutron production yield by absorption of protons on a thick beryllium target,” in Laboratori Nazionali del Sud, Activity Report 2010, G. Agnello, Ed. Catania: INFN, 2010, vol. 10, p. 56.
- [13] M. Osipenko et al., Nucl. Instr. and Meth. A, vol. 723, p. 8, 2013.
- [14] M. Yamawaki, N. Takeyama, and Y. Katsumura, Jpn. J. Appl. Phys., vol. 47, p. 1104, 2008.
- [15] U. Amaldi, R. Biancastelli, C. Bosio, and L. Papadopoulos, Nucl. Instr. and Meth., vol. 91, p. 477, 1971.
- [16] G. Lanzano et al., Nuovo Cim., vol. 110, p. 505, 1997.
- [17] N. Colonna and G. Tagliente, Nucl. Instr. and Meth., vol. 416, p. 109, 1998.
- [18] V. Verbinski, H. Weber, and R. Sund, Phys. Rev., vol. 7, p. 1173, 1973.
- [19] J. Cub et al., Nucl. Instr. and Meth., vol. 274, p. 217, 1989.
- [20] A. Bungau et al., Phys. Rev. Lett., vol. 109, p. 141802, 2012.