11email: ducci@astro.uni-tuebingen.de 22institutetext: INAF, Istituto di Astrofisica Spaziale e Fisica Cosmica - Palermo, Via U. La Malfa 153, I-90146 Palermo, Italy 33institutetext: INAF, Istituto di Astrofisica Spaziale e Fisica Cosmica - Milano, Via E. Bassini 15, I-20133 Milano, Italy 44institutetext: ISDC, Data Center for Astrophysics of the University of Geneva, Chemin d’Ecogia, 16 1290 Versoix Switzerland 55institutetext: NASA/Goddard Space Flight Center, Greenbelt, MD 20771, USA 66institutetext: Universities Space Research Association, Columbia, MD, USA 77institutetext: Department of Astronomy and Astrophysics, Pennsylvania State University, University Park, PA 16802, USA
Swift/XRT orbital monitoring of the candidate supergiant fast X–ray transient IGR J17354–3255
We report on the Swift/X-ray Telescope (XRT) monitoring of the field of view around the candidate supergiant fast X-ray transient (SFXT) IGR J17354–3255, which is positionally associated with the AGILE/GRID gamma-ray transient AGL J1734–3310. Our observations, which cover 11 days for a total on-source exposure of 24 ks, span 1.2 orbital periods ( d) and are the first sensitive monitoring of this source in the soft X–rays. These new data allow us to exploit the timing variability properties of the sources in the field to unambiguously identify the soft X–ray counterpart of IGR J17354–3255. The soft X-ray light curve shows a moderate orbital modulation and a dip. We investigated the nature of the dip by comparing the X-ray light curve with the prediction of the Bondi-Hoyle-Lyttleton accretion theory, assuming both spherical and nonspherical symmetry of the outflow from the donor star. We found that the dip cannot be explained with the X-ray orbital modulation. We propose that an eclipse or the onset of a gated mechanism is the most likely explanation for the observed light curve.
Key Words.:
X-rays: binaries – stars: individual IGR J17354-32551 Introduction
IGR J17354–3255 was discovered as a hard X-ray transient on 2006 April 21 (Kuulkers et al., 2006), when it reached a flux of about 18 mCrab ( keV) during two ks observations within the INTEGRAL Galactic bulge monitoring program. It was first reported in the fourth IBIS/ISGRI catalog (Bird et al., 2010) with a 20–40 keV average flux of erg cm-2 s-1. It is listed in the Swift (Gehrels et al., 2004) Burst Alert Telescope (BAT, Barthelmy et al., 2005) 58-month Hard X-ray Survey (Baumgartner et al., 2010, Swift J1735.6–3255) with a 14–195 keV average flux of erg cm-2 s-1 and in the 54-month Palermo Swift BAT hard X-ray catalog (Cusumano et al., 2010, 2PBC J1735.4–3256) with a 15–150 keV average flux of erg cm-2 s-1.
Renewed interest in this object arose due to its positional association with the AGILE/GRID gamma-ray transient AGL J1734–3310 (Bulgarelli et al., 2009). Thanks to a follow-up Swift target of opportunity (ToO) observation of the IGR J17354–3255 field on 2009 April 17, Vercellone et al. (2009) detected two sources (hereafter src1 and src2) within the 4′ INTEGRAL error circle (Kuulkers et al., 2006) at a 0.2–10 keV count rate of counts s-1 (src1) and counts s-1 (src2). Based on a comparison with a previous observation of the same field taken on 2008 March 11 in which src1 was not detected while src2 showed the same count rate, Vercellone et al. (2009) suggested that src2 was a persistent source and src1 the most likely counterpart of IGR J17354–3255. Chandra observations (Tomsick et al., 2009) also found two sources within the INTEGRAL error circle. CXOU J173527.5-325554 (src1) was the brighter (unabsorbed 0.3–10 keV flux of erg cm-2 s-1), harder (), and more heavily absorbed ( cm-2, cm-2), arguing for a high-mass X-ray binary (HMXB) nature. With an unabsorbed 0.3–10 keV flux of erg cm-2 s-1, CXOU J173518.7-325428 (src2) could also contribute to the flux detected by INTEGRAL, but Tomsick et al. (2009) also suggested that CXOU J173527.5-325554 (src1) was the counterpart of IGR J17354–3255.
D’Aì et al. (2011) and Sguera et al. (2011) have studied the hard X–ray properties of IGR J17354–3255 as they emerge from the extensive BAT and INTEGRAL archives, respectively. They thus discovered a modulation of the light curve with a period of d (Sguera et al., 2011), which they interpret as the orbital period of the binary. In both works it is shown that the 2009 Swift/X-ray Telescope (XRT, Burrows et al., 2005) observation was performed at the maximum of the folded light curve, while the 2008 one was performed at the minimum, thus strengthening the association of src1 with IGR J17354–3255. Because of its hard X-ray flaring activity (mean flare flux of 20–40 mCrab with one flare peaking at 108 mCrab in the 18–60 keV band) and large dynamic range, Sguera et al. (2011) proposed IGR J17354–3255 as a candidate supergiant fast X-ray transient (SFXT) and investigate its association with the transient AGL J1734–3310.
The SFXTs are HMXBs firmly associated with O or B supergiant stars through optical spectroscopy (e.g., Negueruela et al., 2006b), which display short (just a few hours long, as observed by INTEGRAL; Sguera et al., 2005; Negueruela et al., 2006a) X–ray outbursts with peak luminosities of 1036–1037 erg s-1 and an overall dynamic range of 3–5 orders of magnitude. Their hard X–ray spectra during outburst resemble those of HMXBs hosting accreting neutron stars, with often heavily absorbed, hard power laws below 10 keV combined with high-energy cut-offs at –30 keV. While the detailed mechanism producing the outbursts is not well established, it is probably related to either the properties of the wind from the supergiant companion (in’t Zand, 2005; Walter & Zurita Heras, 2007; Negueruela et al., 2008; Sidoli et al., 2007) or the presence of a centrifugal or magnetic barrier (Grebenev & Sunyaev, 2007; Bozzo et al., 2008). Recently, some evidence has been accumulating that indicates that SFXTs may be the X-ray counterparts of a new class of short Galactic transients emitting in the MeV/GeV regime (see, e.g., Sguera et al., 2009).
In this paper we analyze all the Swift/XRT data collected on the region of IGR J17354–3255 (Sect. 2). This allows us to unambiguously identify the soft X–ray counterpart of the candidate SFXT IGR J17354–3255 with src1, based on its timing properties (Sect. 3). Furthermore, we show the results of the most intense and complete sampling along the orbital period of the light curve of this candidate SFXT with a sensitive soft X-ray instrument and discuss the nature of the companion (Sect. 4).
| ObsID | Start time (UT) | End time (UT) | Exp. | |
|---|---|---|---|---|
| (s) | ||||
| 00037054001 | 2008-03-11 01:05:20 | 2008-03-11 10:52:57 | 4403 | 0.59 |
| 00037054002 | 2009-04-17 01:08:59 | 2009-04-17 07:57:56 | 5243 | 0.17 |
| 00032513001 | 2012-07-18 04:36:12 | 2012-07-18 04:52:55 | 980 | 0.80 |
| 00032513002 | 2012-07-18 11:00:16 | 2012-07-18 11:16:54 | 978 | 0.83 |
| 00032513003 | 2012-07-18 15:58:29 | 2012-07-18 16:18:56 | 1216 | 0.86 |
| 00032513004 | 2012-07-18 20:56:48 | 2012-07-18 21:13:55 | 1013 | 0.89 |
| 00032513006 | 2012-07-19 06:10:32 | 2012-07-19 06:30:56 | 1209 | 0.93 |
| 00032513007 | 2012-07-19 17:25:34 | 2012-07-19 17:35:56 | 622 | 0.99 |
| 00032513008 | 2012-07-20 11:02:19 | 2012-07-20 15:59:55 | 1010 | 0.08 |
| 00032513009 | 2012-07-21 15:57:24 | 2012-07-21 23:59:54 | 1078 | 0.23 |
| 00032513012 | 2012-07-23 01:34:36 | 2012-07-23 03:17:54 | 1103 | 0.38 |
| 00032513011 | 2012-07-23 08:03:03 | 2012-07-23 08:21:54 | 1126 | 0.41 |
| 00032513010 | 2012-07-23 14:24:36 | 2012-07-23 16:10:54 | 880 | 0.45 |
| 00032513014 | 2012-07-24 04:52:54 | 2012-07-24 04:58:27 | 311 | 0.52 |
| 00032513016 | 2012-07-24 14:35:14 | 2012-07-24 14:58:56 | 1402 | 0.56 |
| 00032513017 | 2012-07-24 21:15:56 | 2012-07-24 22:59:55 | 1063 | 0.60 |
| 00032513018 | 2012-07-25 01:40:49 | 2012-07-25 02:20:55 | 1013 | 0.62 |
| 00032513019 | 2012-07-25 08:25:10 | 2012-07-25 08:45:56 | 1226 | 0.65 |
| 00032513020 | 2012-07-25 14:36:48 | 2012-07-25 14:57:54 | 1266 | 0.68 |
| 00032513021 | 2012-07-25 21:19:00 | 2012-07-25 23:04:54 | 1289 | 0.72 |
| 00032513022 | 2012-07-27 03:23:09 | 2012-07-27 03:44:55 | 1284 | 0.86 |
| 00032513023 | 2012-07-27 09:47:09 | 2012-07-27 10:08:56 | 1286 | 0.90 |
| 00032513024 | 2012-07-27 13:00:09 | 2012-07-27 13:19:55 | 1171 | 0.91 |
| 00032513025 | 2012-07-28 01:50:20 | 2012-07-28 02:29:54 | 1191 | 0.98 |
a Mean phase referred to d and MJD 52698.205.

2 Observations and Data Analysis
We first considered the hard X-ray data from the Swift/BAT. IGR J17354–3255 has never triggered BAT onboard, but it is detected in the Hard X-ray Survey111http://swift.gsfc.nasa.gov/docs/swift/results/bs58mon/SWIFT_J1735.6-3255 at 9.6 confidence level. The light curve, which spans the 65 months between MJD 53373.66 and 55347.65 (2005 January 3 to 2010 May 31), shows a fairly steady level with no significant long-term variability. Two short flares are found, with fluxes consistent with INTEGRAL-detected flares, on 2006 March 4 22:44 UT (5.6, lasting 1044 s), when the source reached 0.017 counts s-1 cm-2 (14–195 keV), and on 2006 March 25 18:29 UT (5.7, 1324 s), reaching 0.010 counts s-1 cm-2.
We also retrieved the IBIS/ISGRI light curve of IGR J17354–3255 from the online tool Heavens222http://www.isdc.unige.ch/heavens, which has access to all public available INTEGRAL data on this source, between MJD 52671.43 and 55624.28 (2003 February 1 to 2011 March 4). We selected the 17–50 keV energy band to maximize the signal-to-noise ratio.

The log of the Swift/XRT observations used in this paper is in Table 1. The Swift observations of IGR J17354–3255 during 2008 and 2009 were extensively described in Vercellone et al. (2009), D’Aì et al. (2011), and Sguera et al. (2011); here they are re-analyzed to ensure uniformity. The data collected in 2012 July were obtained as a ToO monitoring program of ten scheduled daily observations, which were each 5 ks long and equally spread in the four quarters of the day, starting on 2012 July 18. This strategy aimed at covering the light curve in all orbital phases while keeping the observing time per day reasonably short, thus not impeding observations of gamma-ray bursts (GRBs), which are the main scientific target for Swift. The 2012 campaign lasted 11 days divided in 22 observations for a total on-source exposure of 24 ks.
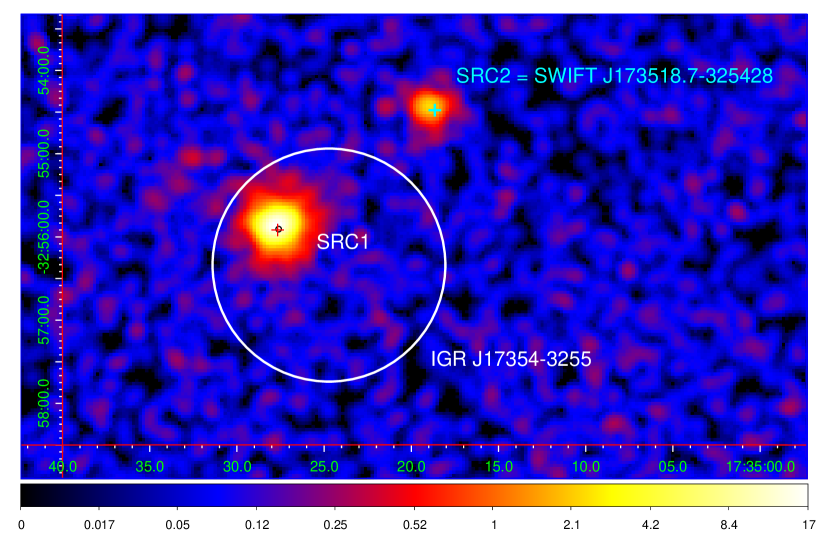
The XRT data were uniformly processed with standard procedures (xrtpipeline v0.12.6), as well as filtering and screening criteria by using FTOOLS v6.12. Within the XRT field of view (FOV) around IGR J17354–3255, two sources were detected (see Fig. 1). In both cases the source count rates never exceeded count s-1, so only photon-counting mode (PC) events (selected in grades 0–12) were considered and we checked that no pile-up correction was required. Source events were accumulated within a circular region with a radius of 20 pixels (1 pixel ′′), and background events were accumulated from a nearby source-free region.
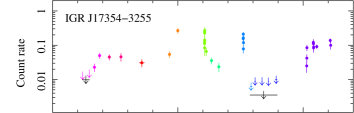
Light curves were created for both sources and corrected for point-spread function (PSF) losses, vignetting, and were background subtracted (see Fig. 2). For src1 the light curve was binned to ensure at least 20 counts per bin, whenever the statistics allowed it. For src2 we accumulated all data within a day to obtain detections whenever possible. For our spectral analysis, we extracted events in the same regions as those adopted for the light curve creation; ancillary response files were generated with xrtmkarf. We used the latest spectral redistribution matrices in CALDB (20120713). For a more detailed discussion of the data analysis procedure, please refer to Romano et al. (2011, and references therein).
All quoted uncertainties are given at 90% confidence level (c.l.) for one interesting parameter, unless otherwise stated.
3 Results
Swift J173527.7–325555 (src1) is located at RA(J, Dec(J with an uncertainty radius of 20 (90% c.l.; the astrometrically corrected position was determined according to Evans et al. 2009 and Goad et al. 2007). This position is from the Chandra unidentified source CXOU J173527.5–325554 (Tomsick et al., 2009) and from the source 2MASS J17352760–3255544. In the following we report on src1, while the properties of src2 are described in Sect. 3.3.
3.1 Light curve analysis
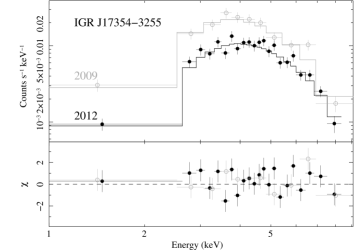
Fig. 2 (top) shows the 0.3–10 keV light curve of Swift J173527.7–325555 during the 2012 campaign. The light curve begins at phase 0.8 (see Table 1) and covers the source through a little over one full period, ending at phase 0.98. Fig. 3 shows the folded light curve, which includes the data collected in 2012 (black) and the 2008 and 2009 data (grey). We also include the 3- upper limit obtained from a 19 ks exposure on 2011 March 6 with XMM-Newton (Bozzo et al., 2012). The XRT count rate to flux conversion was derived from the spectral fit of the mean 2012 spectrum (see Sec. 3.2). Superimposed on the long-term orbital modulation, which follows the one seen in the BAT (D’Aì et al., 2011, fig. 3c) and INTEGRAL data (Sguera et al., 2011, fig. 4) we also observe flaring on short time scales (hundred of seconds, e.g., grey points in Fig. 3). This behavior has been observed in most SFXTs (Sidoli et al., 2008; Romano et al., 2009, 2011), in particular those we monitored along the orbital period (Romano et al., 2010, 2012).
A noteworthy feature is the dip centered at , which starts at phase and lasts –. The lowest limit (as observed by XRT) was collected during the dip by combining five observations (00032513017 through 00032513021 for a total on-source exposure of 5.9 ks, shown as a larger downward-pointing arrow at ). These observations yielded a 3- upper limit at counts s-1. This corresponds to an unabsorbed 0.3–10 keV flux of erg cm-2 s-1 and to a 2–10 keV luminosity of erg s-1 (assuming the optical counterpart distance of 8.5 kpc, as derived from the closeness to the Galactic center and the high X-ray absorption; Tomsick et al. 2009). In addition, we note that the recent XMM-Newton observation (Bozzo et al., 2012), which was also obtained at phase 0.66, yielded a 3- upper limit at counts s-1 (0.5–10 keV) for the Metal Oxide Semi-conductor (MOS) cameras. This corresponds to an unabsorbed 0.3–10 keV flux of erg cm-2 s-1 when adopting the best-fitting spectral model for the 2012 XRT campaign (see Sect. 3.2). The XMM-Newton limit corresponds to a 2–10 keV luminosity of erg s-1.
The lowest point during the campaign outside the dip was recorded on MJD 56126.67 at 0.023 counts s-1, a detection corresponding to an unabsorbed 0.3–10 keV flux of erg cm-2 s-1 and to a luminosity of erg s-1. During the 2012 campaign, the peak count rate was counts s-1 (MJD 56130.00). The highest recorded count rate, however, was achieved on 54938.33 at counts s-1 or erg cm-2 s-1 ( erg s-1).
After having converted the event arrival times to the Solar system barycentric frame, we searched the XRT data for periodic pulsations longer than s by means of a Fourier transform. No significant signal was found. Because of the limited statistics and the presence of substantial noise in the time series, the upper limits on the source pulsed fraction are non constraining (being larger than 100%).
The observed orbital modulation in the folded light curves of this XRT source and IGR J17354–3255, which has a dip corresponding to the minimum observed in the folded BAT and INTEGRAL light curves (Fig. 5), allows a definitive identification of Swift J173527.7–325555 as the soft X–ray counterpart of IGR J17354–3255. This identification was previously mainly based on positional association.
3.2 Spectroscopy
| ObsID | Fluxa | Lb | dof | ||
|---|---|---|---|---|---|
| (1022 cm-2) | |||||
| 00037054002 | 1.7 | ||||
| 00032513001–25 | 0.9 |
- a Unabsorbed 2–10 keV fluxes ( erg cm-2 s-1).
- b 2–10 keV luminosities in units of erg s-1, at 8.5 kpc.
We extracted the mean spectrum during the 2009 observation (the grey points at phase 0.17 in Fig. 3) and the mean spectrum of the 2012 campaign. The data were rebinned with a minimum of 20 counts per energy bin to allow fitting. The spectra were fit in the 0.3–10 keV energy range with a single absorbed power-law model as more complex models were not required by the data. The absorbing column is significantly in excess of the Galactic one ( cm-2; Kalberla et al., 2005), while the photon index is . The peak flux was reached in 2009 with its average 2–10 keV unabsorbed flux of erg cm-2 s-1, corresponding to erg s-1 at 8.5 kpc). This is about a factor of 2 higher than the average spectrum obtained in 2012. The results are reported in Table 2 and the best fits are shown in Fig. 4.
3.3 Properties of Swift J173518.7–325428
Swift J173518.7–325428 (src2) is located at RA(J, Dec(J, with an uncertainty radius of 46 (90% c.l.). This source is clearly outside the error circle of IGR J17354–3255 and is thus not a viable counterpart. For completeness, we report the analysis of this source. Our observations highlight a variability in its light curve, shown in Fig. 2 (bottom), with a dynamical range of 4.5 (at a binning of s). The mean spectrum was extracted from all the data collected in 2012 and fit with an absorbed power-law model in the 0.3–10 keV energy range with Cash (1979) statistics. The fit yielded an absorbing column cm-2, which is consistent with the Galactic one ( cm-2; Kalberla et al., 2005), and . The average observed and unabsorbed fluxes (0.3–10 keV) are erg cm-2 s-1 and erg cm-2 s-1, respectively, and are consistent with the findings of Tomsick et al. (2009). Although the optical counterpart of Swift J173518.7–325428 is not detected, the observed properties of this source, as also noted by Tomsick et al. (2009), are consistent with an X–ray binary.

4 Discussion
We performed a monitoring of the FOV around IGR J17354–3255, which is an INTEGRAL transient positionally associated with the gamma-ray transient AGL J17343310. Our new XRT data represent the first soft X-ray monitoring of more than one orbital period of IGR J17354–3255, allowing us to highlight conspicuous similarities between the folded light curves of the XRT source and IGR J17354–3255. Consequently, they provide a definitive identification of the soft X–ray counterpart of IGR J17354–3255. In contrast, only a positional association, albeit one supported by the consistency of high and low X-ray flux with the hard X-ray flux at the same orbital phase, was available before.
Based on its hard X–ray behavior, IGR J17354–3255 is considered a candidate SFXT by Sguera et al. (2011). They show that it is a weak persistent hard X-ray source (average out-of-outburst flux of 1.1 mCrab) with rare, fast (hr to a few days, with a peak at mCrab) flares with a dynamic range . They also quote a soft X-ray dynamic range, which is based on the 2008 and 2009 XRT observations only, in excess of 300.
The X-ray flaring activity of IGR J17354–3255 involves intensity increases by a factor of on time scales of hundreds to thousands of seconds. These increases are hardly reconciliable with a system accreting from a disc. In fact, an accretion disc would smooth out the accretion rate variations produced by wind inhomogeneities with a time scale shorter than the viscous time scale of the accretion disc. In contrast, the observed X-ray variability, together with the broadband X-ray spectrum and the measured orbital period (D’Aì et al., 2011) is consistent with a neutron star fed by a strong stellar wind (see, e.g., Negueruela 2010).
Our sensitive monitoring of this source in the soft X–ray allowed us to observe the presence of a dip at phases , which correspond to a duration of d. This dramatic decrease in soft X-ray flux was seen during the Swift/XRT 2008 observation and twice in the 2012 campaign. It is also independently reported by a different soft X–ray instrument in the XMM-Newton 2011 observation (Bozzo et al., 2012). In Fig. 5b and c we show the BAT and IBIS/ISGRI folded light curves. The dip observed in the BAT data nicely corresponds to what is observed in the XRT folded light curve. When fitted with a sinusoidal function, it has a centroid at and a width (corresponding to the portion of the sinusoidal function with counts below zero) spanning from 0.57 and 0.81 in phase. We modeled the IBIS/ISGRI light curve, which has a much larger count statistics than the BAT one, with two sinusoidal functions and obtained a minimum at and a width spanning from 0.56 and 0.75 in phase. The soft X-ray dynamic range from XRT monitoring is outside of the dip and considering the deep XMM-Newton upper-limit.
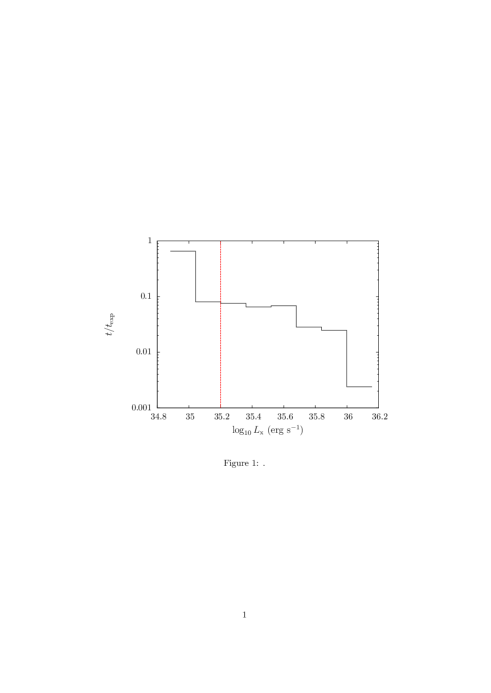
Fig. 6 shows the probability distribution histogram of luminosity of IGR J17354–3255, which was obtained with the XRT observations in which the source is significantly detected. Because of the sensitivity of XRT, luminosities below erg s-1 have been obtained with large integration times. Therefore, the luminosity distribution on the left side of the vertical dashed line of Fig. 6 does not reproduce the real luminosity distribution of IGR J17354–3255.
IGR J17354–3255 looks intrinsically less variable in the soft X–ray than other SFXTs monitored with XRT along their orbital periods. In the case of the confirmed SFXT IGR J18483–0311, which many consider to be an intermediate SFXT, the light curve shows a large modulation with the orbital phase (Romano et al., 2010, fig. 1), which can be interpreted as wind accretion along a highly eccentric orbit. The dynamic range of this source, which was calculated excluding the dip in the light curve, exceeds 580 (and 1200 including the dip data). Furthermore, variability is observed on short time scales, superimposed on the long-term orbital modulation of IGR J18483–0311. It has variations by a factor of a few in count rate occurring in hr, which can be naturally explained by clumps in the accreting wind. In the case of IGR J16418–4532 (Romano et al., 2012, fig. 4), in contrast, the X-ray light curve does not show a very strong orbital modulation, suggesting that the system has moderate eccentricity. The observed dynamical range of this source is at least 370, (1400 considering the points within the observed eclipse) and also places IGR J16418–4532 among the intermediate SFXTs.
Similar to IGR J16418–4532, IGR J17354–3255 has a light curve with very little orbital modulation, and the short time-scale flares we observe superimposed on it are comparatively of a lower dynamical range. Therefore, our data indicate that this source is a weak, almost persistent source in the soft X-rays (apart from the dip), which has not shown any remarkable activity during the 2012 XRT monitoring or in the previous observations.
The X-ray variability of IGR J17354–3255 is also very similar to that shown by Vela X–1, a persistent wind-fed HMXB composed of a B0.5Ib star and a pulsar with an orbital period of 8.96 d (similar to the orbital period of IGR J17354–3255) and an eccentricity of (e.g., Quaintrell et al. 2003). Vela X–1 shows an X-ray variability with a dynamic range of 20–30 on time scales of a few hours and an average luminosity of erg s-1 (Fürst et al. 2010; Kreykenbohm et al. 2008). The lower luminosity of IGR J17354–3255 compared with Vela X–1 can be explained by reasonable values for the stellar wind parameters of the donor star.
On the basis of the above considerations, it is reasonable to assume that IGR J17354–3255 is a wind-fed system. In this scenario, we discuss three different hypotheses for the origin of the dip of IGR J17354–3255:
-
1.
In the framework of wind accretion along a highly eccentric orbit, the dip is due to the apastron passage of the compact object, where the faster and less dense wind reduces the amount of accreted material and consequently the X-ray luminosity.
-
2.
The dip is caused by the onset of gating mechanisms at apastron, which become effective owing to the lower accretion rate (see, e.g., Bozzo et al. 2008).
-
3.
The dip is produced by an eclipse.
We discuss these three different scenarios by comparing the X-ray luminosities observed by Swift/XRT at different orbital phases with those calculated with a model based on the Bondi-Hoyle-Lyttleton accretion theory (Bondi 1952; Bondi & Hoyle 1944; Hoyle & Lyttleton 1939, BHL hereafter). The BHL accretion theory is usually applied to X-ray binaries where the donor star produces a fast and dense stellar wind that is assumed to be homogeneous.
Since the spectral type of the donor star of IGR J17354–3255 is unknown, we considered both the accretion from a spherically symmetric wind (if the donor star is a supergiant or a giant/main sequence star without circumstellar disc) and the accretion from a circumstellar disc (if the donor star is a giant/main sequence). The equations that we used to compute the luminosity light curves are described in the following paragraphs. The results are discussed in Sects. 4.1 and 4.2.
OB supergiant
The winds of OB supergiants are spherically symmetric with good approximation (e.g., Kudritzki & Puls 2000) with a velocity law:
| (1) |
called -velocity law (Castor, Abbott, & Klein 1975), where is the terminal velocity, determines how steeply the wind velocity reaches (), and is the distance from the center of the supergiant star.
The density distribution around the donor star is given by the continuity equation:
| (2) |
where is the mass loss rate. We applied the definition of accretion radius of Bondi (1952) to find the mass accretion rate :
| (3) |
where is the relative velocity between the neutron star and the wind:
| (4) |
where and are the radial and tangential components of the orbital velocity and is the wind velocity (Equation 1). We thus obtain the X-ray luminosity produced by the accretion
| (5) |
OB giants/main sequence
The rapidly rotating Oe and Be main sequence/giant stars can be surrounded by a circumstellar envelope of gas confined along the equatorial plane. Most OBe/X-ray binaries are transient in X-rays, with eccentricities . They can show periodic or quasi-periodic outbursts (called type I), which cover a small fraction of the orbital period and peaked at the periastron passage of the neutron star, or they can show giant outbursts (called type II), which last for a large fraction of the orbit and in some cases for several orbital periods. These giant outbursts have peak luminosities of erg s-1, which are larger than those observed during type I outbursts. Type I and II outbursts are believed to be due to the interaction between the neutron star and the circumstellar disc of the donor star. Persistent OBe/X-ray binaries do not display large outbursts and their X-ray luminosities are erg s-1 (see, e.g., Reig 2011).
In the framework of the wind model developed by Waters et al. (1989) to reproduce the X-ray luminosities of wind-fed neutron stars in eccentric orbits around the Oe-Be stars, we assumed a density distribution in the circumstellar disc
| (6) |
where g cm-3, and (Waters et al., 1988). The radial wind velocity component is
| (7) |
where ranges between and km s-1. The rotational wind velocity component is
| (8) |
where for Keplerian rotation or if the angular momentum of the outflowing matter is conserved. The relative velocity between the neutron star and the wind is
| (9) |
If the circumstellar disc is not formed (or outside of it) the wind properties are the same of those found for OB supergiants, with lower mass loss rates and terminal velocities ( yr-1; km s-1; see, e.g., Waters et al. 1988).
4.1 Orbital modulation
First we considered the possibility that the XMM-Newton dip is due to the luminosity modulation produced by a neutron star moving in a highly eccentric orbit. For this calculation we did not take into account the duration of the dip observed by XRT, which can only be considered as an upper limit.
Since the broadband spectrum is typical of accreting neutron stars in HMXBs (Sguera et al. 2011; D’Aì et al. 2011), we focused our attention on the case of a neutron star with mass and radius km accreting the wind material of an OB star. We calculated the X-ray luminosities as a function of the orbital phase, assuming a neutron star accreting material in a circumstellar disc or in a spherically symmetric wind and a supergiant, giant, main-sequence companion star.
We first computed light curves333The numbers of light curves computed in the three cases of accretion from a spherically symmetric wind with (1) supergiant, (2) giant or main sequence donor star, (3) accretion from a circumstellar disc, depend on the number of steps used for the orbital and wind parameters and their allowed ranges. by varying the masses and radii of OB supergiants (using the values reported in Martins et al. 2005 and Searle et al. 2008) and for different values of mass loss rate yr-1, terminal wind velocity km s-1, and eccentricities . We set because we ascertain that variations of this parameter do not produce appreciable variations in the X-ray luminosity.
Then, we considered the case of OB giant/main sequence stars with circumstellar disc. We calculated light curves by varying the masses and radii of OB V (using the mass-radius relation of Demircan & Kahraman 1991) and OB III (using the Catalogue of Apparent Diameters and Absolute Radii of Stars [CADARS] of Pasinetti Fracassini et al. 2001; Hohle et al. 2010; Martins et al. 2005), and for different wind parameters and eccentricities: , km s-1, km s-1, or , .
In the scenario of OB giant/main sequence stars without the circumstellar discs, we calculated light curves assuming different spectral types for the donor star, mass loss rates yr-1, terminal velocities km s-1, eccentricities , and .
We computed the X-ray luminosities using Equation (5), with and given by Equations (4) and (2) in the spherically symmetric wind scenario and by Equations (9) and (6) if the donor star is an OB main sequence/giant and a circumstellar disc is present.
In all cases, no combination of the orbital and wind parameters can reproduce the observed out-of-dip ( and ) luminosities ranging from erg s-1 to erg s-1 ( kpc) and luminosities below erg s-1 at (corresponding to the XMM-Newton observation). In fact, the observed dynamic range (considering the XMM-Newton upper limit) requires highly eccentric orbits. However, when the neutron star spends a large fraction of time in the apastron region (Kepler’s second law). Therefore, all calculated light curves reproducing the XMM-Newton upper limit at show luminosities lower than erg s-1 during orbital phases longer than the dip observed by XRT.
In conclusion, it is unlikely that the upper limit observed by XMM-Newton is due to the apastron passage of the neutron star.
4.2 Eclipse and gating mechanisms
Similarly to Sect. 4.1, we compared the observed X-ray luminosities with those obtained with a BHL model to determine the eccentricities of the system, the wind properties, and the nature of the donor star that reproduces the observed out-of-dip X-ray luminosities, which range from erg s-1 to erg s-1 ( kpc).
Since the observational properties of the dip (duration and luminosity) in both the eclipse and gated mechanisms cases do not depend solely on the wind and orbital parameters444In the eclipse scenario, the duration of the eclipse depends on the orbital separation, the radius of the donor star, and the inclination of the orbital angular momentum vector with respect to the line of sight to the Earth. In the gated mechanisms scenario, the dip can be produced in different epochs at a given orbital phase if and for particular values of the spin period and magnetic field strength of the neutron star., we treated these two scenarios as a single one.
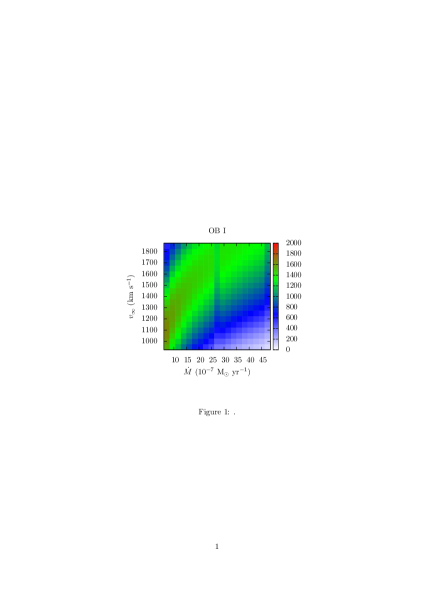
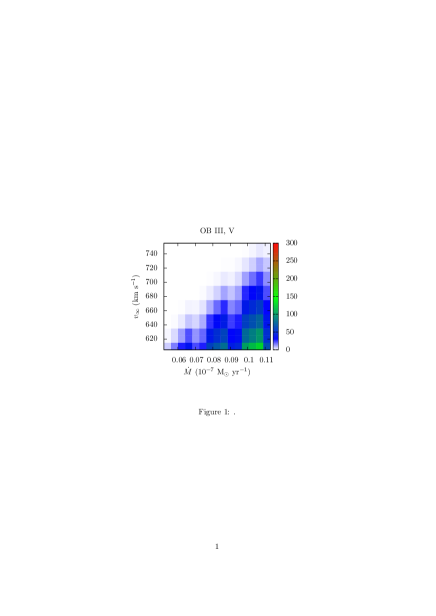
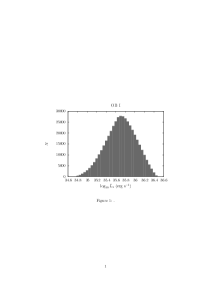
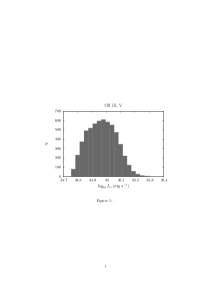
The 2D histograms of Fig. 7 show the solutions that reproduce the observed X-ray luminosities obtained assuming the accretion from a spherically symmetric wind produced by a supergiant (left panel) or a giant/main sequence star (right panel). For each solution we also plotted the mean luminosity (averaged over the orbit) in the histograms of Fig. 8. These histograms show that the X-ray luminosity produced by the accretion from a supergiant wind is on average higher than the X-ray luminosity produced by the accretion of the wind from a giant or a main sequence OB star. The allowed eccentricities (obtained by comparing the observed X-ray luminosities with those calculated with the BHL model) are in the supergiant scenario and in the giant/main sequence case.
We also considered the case of a neutron star embedded in the wind of the circumstellar disc of the donor star. We found that the observed X-ray luminosities can be reproduced assuming a main sequence donor star with mass , , km s-1, , km s-1, or , . The X-ray luminosities obtained using these parameters are about erg s-1. Assuming distances larger than kpc, more solutions are possible. Nonetheless, since the truncation of the circumstellar disc produced by the neutron star (Reig et al. 1997; Negueruela & Okazaki 2001; Okazaki & Negueruela 2001) is expected to be more efficient in systems with low eccentricities and narrow orbits (see Reig 2011 and references therein), it is unlikely that the neutron star of IGR J17354–3255 accretes the material of the circumstellar disc.
5 Summary
We reported on Swift/XRT observations of the candidate SFXT IGR J17354–3255, which provided for the first time a definitive identification of its soft X-ray counterpart. They also allowed us to observe the presence of a dip in the XRT light curve of IGR J17354–3255 folded at the orbital period. Apart from the dip, the low dynamic range observed with Swift/XRT indicates that IGR J17354–3255 is an almost persistent source in the soft X-rays.
We investigated the origin of the dip by comparing the XRT folded light curve with those calculated with models based on the BHL accretion theory. We assumed both spherical and nonspherical symmetry of the outflow from the donor star. We found that the dip cannot be explained with a luminosity modulation produced by a neutron star in a highly eccentric orbit and showed that an eclipse or the onset of a gated mechanism can explain the dip. We also determined the eccentricities of the system, the wind properties, and the nature of the donor star that reproduces the observed out-of-dip luminosities.
Acknowledgements.
We thank the anomymous referee for constructive comments which helped to improve the paper. We thank the Swift team duty scientists and science planners. We also thank the remainder of the Swift XRT and BAT teams, S.D. Barthelmy, J.A. Nousek, and D.N. Burrows in particular, for their invaluable help and support of the SFXT project as a whole. We thank P.A. Evans and C. Ferrigno for helpful discussions. We acknowledge financial contribution from the contract ASI-INAF I/004/11/0. This work made use of the results of the Swift/BAT hard X-ray transient monitor: http://swift.gsfc.nasa.gov/docs/swift/results/transients/References
- Barthelmy et al. (2005) Barthelmy, S. D., Barbier, L. M., Cummings, J. R., et al. 2005, Space Science Reviews, 120, 143
- Baumgartner et al. (2010) Baumgartner, W. H., Tueller, J., Markwardt, C., & Skinner, G. 2010, in Bulletin of the American Astronomical Society, Vol. 42, AAS/High Energy Astrophysics Division #11, 675
- Bird et al. (2010) Bird, A. J., Bazzano, A., Bassani, L., et al. 2010, ApJS, 186, 1
- Bondi (1952) Bondi, H. 1952, MNRAS, 112, 195
- Bondi & Hoyle (1944) Bondi, H. & Hoyle, F. 1944, MNRAS, 104, 273
- Bozzo et al. (2008) Bozzo, E., Falanga, M., & Stella, L. 2008, ApJ, 683, 1031
- Bozzo et al. (2012) Bozzo, E., Pavan, L., Ferrigno, C., et al. 2012, A&A, 544, A118
- Bulgarelli et al. (2009) Bulgarelli, A., Gianotti, F., Trifoglio, M., et al. 2009, The Astronomer’s Telegram, 2017, 1
- Burrows et al. (2005) Burrows, D. N., Hill, J. E., Nousek, J. A., et al. 2005, Space Science Reviews, 120, 165
- Cash (1979) Cash, W. 1979, ApJ, 228, 939
- Castor et al. (1975) Castor, J. I., Abbott, D. C., & Klein, R. I. 1975, ApJ, 195, 157
- Cusumano et al. (2010) Cusumano, G., La Parola, V., Segreto, A., et al. 2010, A&A, 524, A64
- D’Aì et al. (2011) D’Aì, A., La Parola, V., Cusumano, G., et al. 2011, A&A, 529, A30
- Demircan & Kahraman (1991) Demircan, O. & Kahraman, G. 1991, Ap&SS, 181, 313
- Evans et al. (2009) Evans, P. A., Beardmore, A. P., Page, K. L., et al. 2009, MNRAS, 397, 1177
- Fürst et al. (2010) Fürst, F., Kreykenbohm, I., Pottschmidt, K., et al. 2010, A&A, 519, A37
- Gehrels et al. (2004) Gehrels, N., Chincarini, G., Giommi, P., et al. 2004, ApJ, 611, 1005
- Goad et al. (2007) Goad, M. R., Tyler, L. G., Beardmore, A. P., et al. 2007, A&A, 476, 1401
- Grebenev & Sunyaev (2007) Grebenev, S. A. & Sunyaev, R. A. 2007, Astronomy Letters, 33, 149
- Hohle et al. (2010) Hohle, M. M., Neuhäuser, R., & Schutz, B. F. 2010, Astronomische Nachrichten, 331, 349
- Hoyle & Lyttleton (1939) Hoyle, F. & Lyttleton, R. A. 1939, in Proceedings of the Cambridge Philosophical Society, Vol. 34, Proceedings of the Cambridge Philosophical Society, 405
- in’t Zand (2005) in’t Zand, J. J. M. 2005, A&A, 441, L1
- Kalberla et al. (2005) Kalberla, P. M. W., Burton, W. B., Hartmann, D., et al. 2005, A&A, 440, 775
- Kreykenbohm et al. (2008) Kreykenbohm, I., Wilms, J., Kretschmar, P., et al. 2008, A&A, 492, 511
- Kudritzki & Puls (2000) Kudritzki, R.-P. & Puls, J. 2000, ARA&A, 38, 613
- Kuulkers et al. (2006) Kuulkers, E., Shaw, S., Paizis, A., et al. 2006, The Astronomer’s Telegram, 874, 1
- Martins et al. (2005) Martins, F., Schaerer, D., & Hillier, D. J. 2005, A&A, 436, 1049
- Negueruela (2010) Negueruela, I. 2010, in Astronomical Society of the Pacific Conference Series, Vol. 422, High Energy Phenomena in Massive Stars, ed. J. Martí, P. L. Luque-Escamilla, & J. A. Combi, 57
- Negueruela & Okazaki (2001) Negueruela, I. & Okazaki, A. T. 2001, A&A, 369, 108
- Negueruela et al. (2006a) Negueruela, I., Smith, D. M., Harrison, T. E., & Torrejón, J. M. 2006a, ApJ, 638, 982
- Negueruela et al. (2006b) Negueruela, I., Smith, D. M., Reig, P., Chaty, S., & Torrejón, J. M. 2006b, in ESA Special Publication, Vol. 604, The X-ray Universe 2005, ed. A. Wilson, 165
- Negueruela et al. (2008) Negueruela, I., Torrejón, J. M., Reig, P., Ribó, M., & Smith, D. M. 2008, in American Institute of Physics Conference Series, Vol. 1010, A Population Explosion: The Nature & Evolution of X-ray Binaries in Diverse Environments, ed. R. M. Bandyopadhyay, S. Wachter, D. Gelino, & C. R. Gelino, 252–256
- Okazaki & Negueruela (2001) Okazaki, A. T. & Negueruela, I. 2001, A&A, 377, 161
- Pasinetti Fracassini et al. (2001) Pasinetti Fracassini, L. E., Pastori, L., Covino, S., & Pozzi, A. 2001, A&A, 367, 521
- Quaintrell et al. (2003) Quaintrell, H., Norton, A. J., Ash, T. D. C., et al. 2003, A&A, 401, 313
- Reig (2011) Reig, P. 2011, Ap&SS, 332, 1
- Reig et al. (1997) Reig, P., Fabregat, J., & Coe, M. J. 1997, A&A, 322, 193
- Romano et al. (2011) Romano, P., La Parola, V., Vercellone, S., et al. 2011, MNRAS, 410, 1825
- Romano et al. (2012) Romano, P., Mangano, V., Ducci, L., et al. 2012, MNRAS, 419, 2695
- Romano et al. (2009) Romano, P., Sidoli, L., Cusumano, G., et al. 2009, MNRAS, 399, 2021
- Romano et al. (2010) Romano, P., Sidoli, L., Ducci, L., et al. 2010, MNRAS, 401, 1564
- Searle et al. (2008) Searle, S. C., Prinja, R. K., Massa, D., & Ryans, R. 2008, A&A, 481, 777
- Sguera et al. (2005) Sguera, V., Barlow, E. J., Bird, A. J., et al. 2005, A&A, 444, 221
- Sguera et al. (2011) Sguera, V., Drave, S. P., Bird, A. J., et al. 2011, MNRAS, 417, 573
- Sguera et al. (2009) Sguera, V., Romero, G. E., Bazzano, A., et al. 2009, ApJ, 697, 1194
- Sidoli et al. (2008) Sidoli, L., Romano, P., Mangano, V., et al. 2008, ApJ, 687, 1230
- Sidoli et al. (2007) Sidoli, L., Romano, P., Mereghetti, S., et al. 2007, A&A, 476, 1307
- Tomsick et al. (2009) Tomsick, J. A., Chaty, S., Rodriguez, J., Walter, R., & Kaaret, P. 2009, ApJ, 701, 811
- Vercellone et al. (2009) Vercellone, S., D’Ammando, F., Striani, E., et al. 2009, The Astronomer’s Telegram, 2019, 1
- Walter & Zurita Heras (2007) Walter, R. & Zurita Heras, J. 2007, A&A, 476, 335
- Waters et al. (1989) Waters, L. B. F. M., de Martino, D., Habets, G. M. H. J., & Taylor, A. R. 1989, A&A, 223, 207
- Waters et al. (1988) Waters, L. B. F. M., van den Heuvel, E. P. J., Taylor, A. R., Habets, G. M. H. J., & Persi, P. 1988, A&A, 198, 200