On the spreading layer emission in luminous accreting neutron stars
Abstract
Emission of the neutron star surface potentially contains information about its size and thus of vital importance for high energy astrophysics. In spite of the wealth of data on the emission of luminous accreting neutron stars, the emission of their surfaces is hard to disentangle from their time averaged spectra. A recent X-ray transient source XTE J1701462 has provided a unique dataset covering the largest ever observed luminosity range for a single source and showing type I (thermonuclear) X-ray bursts. In this paper, we extract the spectrum of the neutron star surface (more specifically, the spectrum of the boundary layer between the inner part of the accretion disc and the neutron star surface) with the help of maximally spectral model-independent method. We show compelling evidences that the energy spectrum of the boundary layer stays virtually the same over factor of 20 variations of the source luminosity. It is rather wide and cannot be described by a single temperature blackbody spectrum, probably because of the inhomogeneity of the boundary layer and a spread in the colour temperature. The observed maximum colour temperature of the boundary/spreading layer emission of 2.4–2.6 keV is very close to the maximum observed colour temperature in the photospheric radius expansion X-ray bursts, which is set by the limiting Eddington flux at the neutron star surface. The observed stability of the boundary layer spectrum and its maximum colour temperature strongly supports theoretical models of the boundary/spreading layers on surfaces of luminous accreting neutron stars, which assume the presence of a region emitting at the local Eddington limit. Variations in the luminosity in that case lead to changes in the size of this region, but affect less the spectral shape. Elaboration of this model will provide solid theoretical grounds for measurements of the neutron star sizes using the emission of the boundary/spreading layers of luminous accreting neutron stars.
keywords:
accretion, accretion discs – stars: neutron – X-rays: binaries – X-rays: stars1 Introduction
Compact objects in binary systems accreting matter from their binary components reveal themselves as bright X-ray emitters. Matter gradually moves closer to the central compact object and is heated to tens of millions degrees. The emergent X-ray radiation potentially contains information about the compact object and about the behaviour of matter in strong gravitational and magnetic fields. Thus, it is necessary to improve our knowledge about formation of the X-ray emission in such accreting sources before we are able to extract parameters of compact objects such as their radii and masses. In this paper, we concentrate on emission of binaries which harbour neutron stars (NSs) as compact objects.
The majority of known bright X-ray sources in our Galaxy are NS binaries. Their X-ray emission was discovered at the dawn of X-ray astronomy. Already first observations of the brightest NS binaries have shown that their emission is likely thermal (Chodil et al., 1968; Toor et al., 1970). Numerous observations of a set of NS binaries in our Galaxy have shown that the whole variety of their energy spectra can be broadly separated into two main classes, with the spectral cutoff at energies below 6–10 keV and around 50–100 keV, which are called soft and hard spectral states, respectively (here we consider only active sources, which have luminosities erg s-1). Accreting NSs typically demonstrate soft spectra if their luminosities are above erg s-1 and hard spectra if their luminosities are lower than that. Simple physical arguments indicate that the soft state spectra form in the optically thick, while the hard state spectra in the optically thin media (see e.g. Barret et al., 2000).
Accreting low-magnetic field NSs should generate X-ray radiation in at least two geometrically distinct regions: in the accretion disc (similarly to the case of accreting black holes) and in the boundary/spreading layer (BL/SL) between the accretion disc, whose inner parts rotate around the NS with very high velocity, and the NS surface. The energy release in these parts of the flow is comparable (Syunyaev & Shakura, 1986; Sibgatullin & Sunyaev, 2000). In the optically thick regime, the effective temperatures of these two regions should be approximately 1–2.5 keV. The observed colour temperatures are increased by the hardness (colour correction) factor (London, Taam, & Howard, 1986; Lapidus, Syunyaev, & Titarchuk, 1986; Shimura & Takahara, 1995) and decreased by the gravitational redshift at the NS surface . The contribution of the neutron star surface not covered by the BL/SL is small. The usual temperatures of NSs in low mass X-ray binaries in quiescent states are about 0.1–0.3 keV (see e.g. Wijnands & Degenaar, 2013). In the active state, the temperature might be higher, but the large extent and the high temperature of the accretion disc and the BL/SL make them dominating the luminosity of the NSs, certainly in the high energy band 3–20 keV.
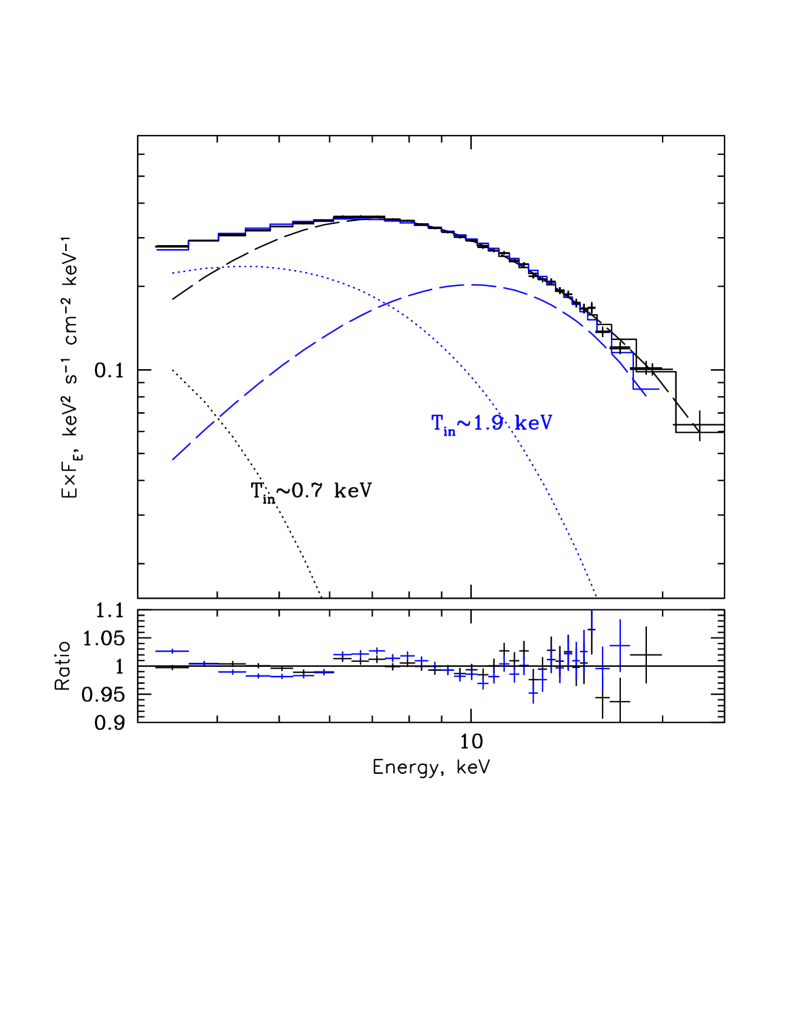
From the observational point of view, spectra of NSs in their soft state are smooth and cannot be easily unambiguously decomposed into these anticipated components. Virtually regardless of the statistical quality and the energy resolution of the data, a variety of spectral models can be fitted to the spectra with the comparable fit quality. This makes the approach based only on a fitting technique not persuasive. This ambiguity led to the completely different interpretations of the soft state spectra (Mitsuda et al., 1984; White, Stella, & Parmar, 1988; Di Salvo et al., 2002). To justify this statement we show an example of such completely different spectral decomposition with the equally good (see Fig. 1 and further discussion in Sect. 3).
Completely different approach to the problem of spectral decomposition was proposed by Mitsuda et al. (1984) and elaborated in works of Gilfanov, Revnivtsev, & Molkov (2003) and Revnivtsev & Gilfanov (2006). It was shown that secure decomposition of the NS spectra can be done with the help of model-independent analysis of their timing variability. They demonstrated that flux variations at the time scales smaller than 1 s are primarily caused by variations of the BL flux only. Its spectral shape remains nearly constant, while the normalization varies. At the same time scales, the accretion disc flux and its spectral shape remain virtually constant (similarly to the behaviour of accretion discs around black holes, see e.g. Churazov et al. 2001) thus providing us with a possibility to make model-independent spectral decomposition.
One of the main results obtained with this technique (Gilfanov et al., 2003; Revnivtsev & Gilfanov, 2006) is that the spectrum of the BL changes very little while its luminosity varies by more than an order of magnitude. This is an important property, which was previously predicted for the BL/SL at the surface of high luminosity NSs by Inogamov & Sunyaev (1999). They showed that the matter which is continuously coming from the accretion disc can decelerate and settle to the NS surface only via a layer spreading over some part of the surface. The larger the mass accretion rate, the larger the part of the NS surface occupied by the SL. It was also shown that the maximum radiation flux is always close to the local Eddington flux in a wide range of the luminosities. Optically thick regime of the layer emission means that its spectral shape should be close to that of a diluted blackbody with the maximal colour temperature mainly governed by the NS gravity. Variation of the total mass accretion rate in the SL affects only its latitude extent, but not the maximal colour temperature, as it is set by the local Eddington flux (Inogamov & Sunyaev, 1999; Suleimanov & Poutanen, 2006). First attempts to use this property to make estimates of the NS radii were done by Revnivtsev & Gilfanov (2006) and Suleimanov & Poutanen (2006).
A rising pile of the observational data on NS emission and especially the outburst of a unique transient source XTE J1701462, which demonstrated all types of spectral variability patterns previously observed only in different objects, have triggered new attempts to obtain spectral decomposition of the NS spectra based only on the quality of the spectral fits (Lin, Remillard, & Homan, 2007, 2009a; Ding et al., 2011). By fitting the multicomponent models to the data, these authors obtained that the temperature of the blackbody component, which they ascribe to the NS surface, strongly varies with the source luminosity.
In the present paper, we study the emission of the BL/SL of the NS in the X-ray transient XTE J1701462 and show that it has nearly constant spectral shape when the source luminosity was above erg s-1. These findings strongly support the physical model of the SL of Inogamov & Sunyaev (1999).

2 Used datasets
In this paper, we use numerous observations of the Rossi X-ray Timing Explorer (RXTE) observatory (Bradt, Rothschild, & Swank, 1993) of the transient XTE J1701462, performed in the period from 2006 Jan 19 (MJD 53754.78) till 2007 July 30 (MJD 54311.21). All data were analysed with the help of standard tasks of heasoft version 6.8. The instrumental background of the Proportional Counter Array (PCA) spectrometer aboard of the RXTE was estimated using the model cmbright, developed by Craig Markwardt (Jahoda et al., 2006).
Spectral modelling was performed with the help of xspec package (Arnaud, 1996). All spectral models were multiplied by a model of interstellar absorption wabs with the hydrogen column density cm-2 (Lin et al., 2009a; Fridriksson et al., 2010). During the outburst the source flux varies by a factor of more than 100. In this paper we study only observations, in which the source was in the soft spectral state (MJD 53754.78-54311.21). During these observations, the source showed variations by a factor of 40 and significant changes in the spectral hardness. The colour–intensity diagram is shown in Fig. 2.
3 Spectral decomposition difficulties
The spectral shape of the optically thick accretion disc (see e.g. Shakura & Sunyaev, 1973) in an X-ray source has been recognised quite long time ago (see e.g. Shapiro, Lightman, & Eardley 1976, based on observational data of Tananbaum et al. 1972), and since then this spectral component has been extensively studied by different authors with the help of different datasets (see e.g. Done, Gierliński, & Kubota, 2007, for a review). The black hole accretion discs are simpler in some respect, because luminous black holes typically have only one optically thick region, whose emission can be relatively unambiguously identified in their broad-band spectra.
The case of luminous NSs is more complicated. While the shape of the optically thick accretion discs around NS might be somehow scaled from those around black holes (however some differences should exist due to the different boundary conditions at the inner boundary of the disc in the two cases), the spectrum of the optically thick BL can be nontrivial.
Typically it is assumed that the BL/SL emits as a black body with the single temperature (Mitsuda et al., 1984; Lin et al., 2007, 2009a; Ding et al., 2011; Church et al., 2012). However, what is very important is that the assumed shape of the BL spectrum has a major consequence for the resulting spectral decomposition. As an example of such ambiguousness, we present two types of decomposition of the spectrum of the X-ray transient XTE J1701462 in its soft, so called “atoll” state using two different assumptions about the shape of the BL spectrum (see Fig. 1). In one case, we assumed that the BL spectrum can be approximated by a perfect single-temperature black body ( keV), while in another case the BL spectrum is approximated by a sum of two black bodies with temperatures of 1.6 and 3.1 keV. In both cases, we adopted a simplest multicolour blackbody approximation (diskbb model in xspec package) for the spectrum of the accretion disc. It is clearly seen that resulting decompositions are drastically different. In these two cases the temperature of the multicolour disc component differs by a factor of more than 2 and the contribution of the accretion disc to the total luminosity differs by almost an order of magnitude (the fainter disc component has a smaller inner temperature ). Statistically, both decompositions have good quality, which is essentially limited by systematic uncertainties of the instrument response calibration. The reduced is for the first case ( keV, keV) and for the second case ( and keV, keV). Here are adopted 2% systematical uncertainties in flux measurements in all energy channels and added them quadratically to pure statistical uncertainties, provided by Poisson noise in these energy channels.
There are no physical arguments why emission of the BL should have the shape of a perfect single temperature black body. Deviations from pure blackbody or some non-uniformity of blackbody colour temperatures of the BL emission cannot be excluded. Thus, we should conclude that model-dependent spectral decompositions are inevitably ambiguous. Application of additional “desirability” criteria to the model dependent decomposition force the spectral model fitting results behave the way, externally introduced by a researcher, and therefore cannot be considered as a robust solution of this problem. Maximally possible model-independent methods should be employed.

4 Spectrum of the BL/SL
4.1 Frequency resolved energy spectra
If one spectral component varies at some time scale (Fourier frequency) much more than another and its spectral shape does not vary with flux, then we can use these properties to make model-independent spectral decomposition. Applicability of this method to the case of luminous NSs was demonstrated by Mitsuda et al. (1984), Gilfanov et al. (2003) and Revnivtsev & Gilfanov (2006). They showed that the BL/SL component varies at high frequencies much more than the accretion disc (note that emission of the accretion disc around black holes is also the least variable part of their spectra, see Churazov et al. 2001). Let us look at the Fourier frequency resolved energy spectra of XTE J1701462 (see details of this techniques in e.g. Revnivtsev, Gilfanov, & Churazov 1999).
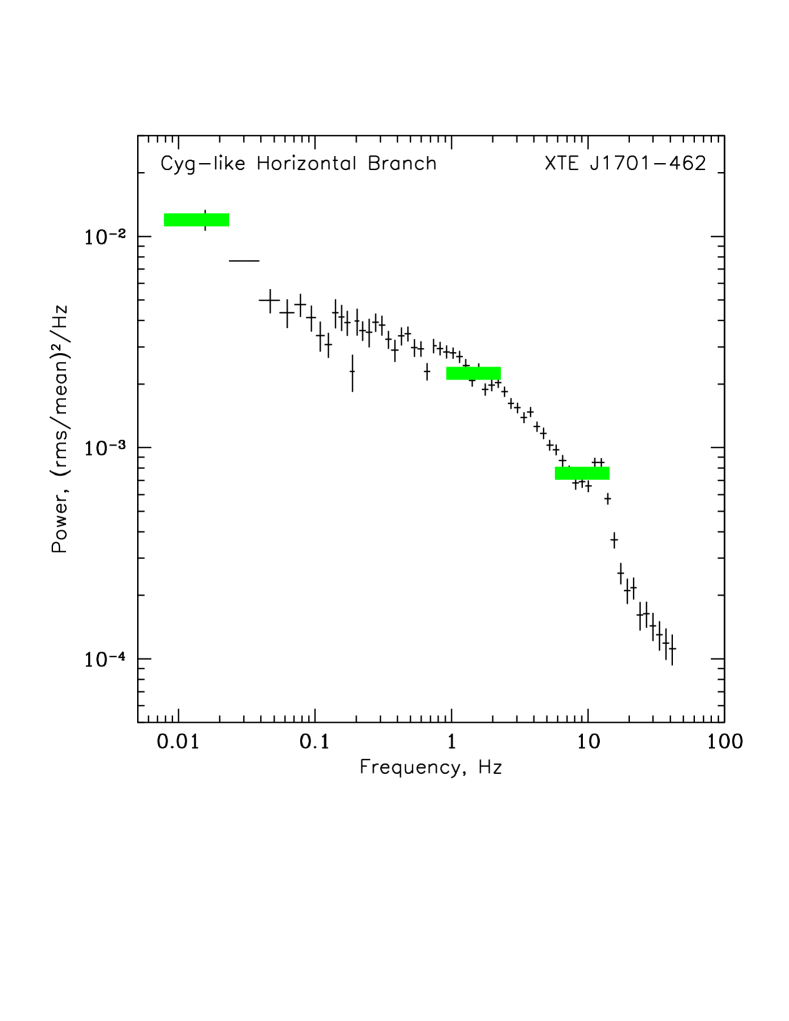
The source XTE J1701462 has demonstrated a variety of spectral and timing behaviour. In the soft spectral state, the strongest variability was observed during the so called “horizontal” branch of the colour-intensity diagram (Homan et al., 2007). Therefore, we have analysed the data collected during this period, more specifically, during the period MJD 53754.77–53778.93.
The resulting Fourier frequency resolved spectra are shown in Fig. 3. It is clearly seen that similarly to the case of GX 340+0, considered in details by Gilfanov et al. (2003), all frequency resolved spectra at Fourier frequencies above 1 Hz have the same spectral shape. Moreover, this spectral shape is almost identical to those of the Fourier frequency resolved energy spectra of all sources analysed in Gilfanov et al. (2003) and Revnivtsev & Gilfanov (2006) and interpreted as spectra of the BL/SL on the NS surface.
This spectrum can be adequately described by a simple analytical formula (see Fig. 3)
| (1) |
with the photon index 0.0–0.1 and the cutoff energy of 3.5–3.8 keV. The best-fitting spectral parameters in all frequency intervals are within these ranges with the errors approximately equal to half of the interval width. A more physically motivated spectral approximation of the frequency resolved spectra by a simple model of saturated Comptonization (comptt model in xspec package) gives the temperature of the seed photons keV, temperature of Comptonizing electrons keV and their optical depth . These values are similar to those obtained for other luminous NS binaries in their soft state (Revnivtsev & Gilfanov, 2006).
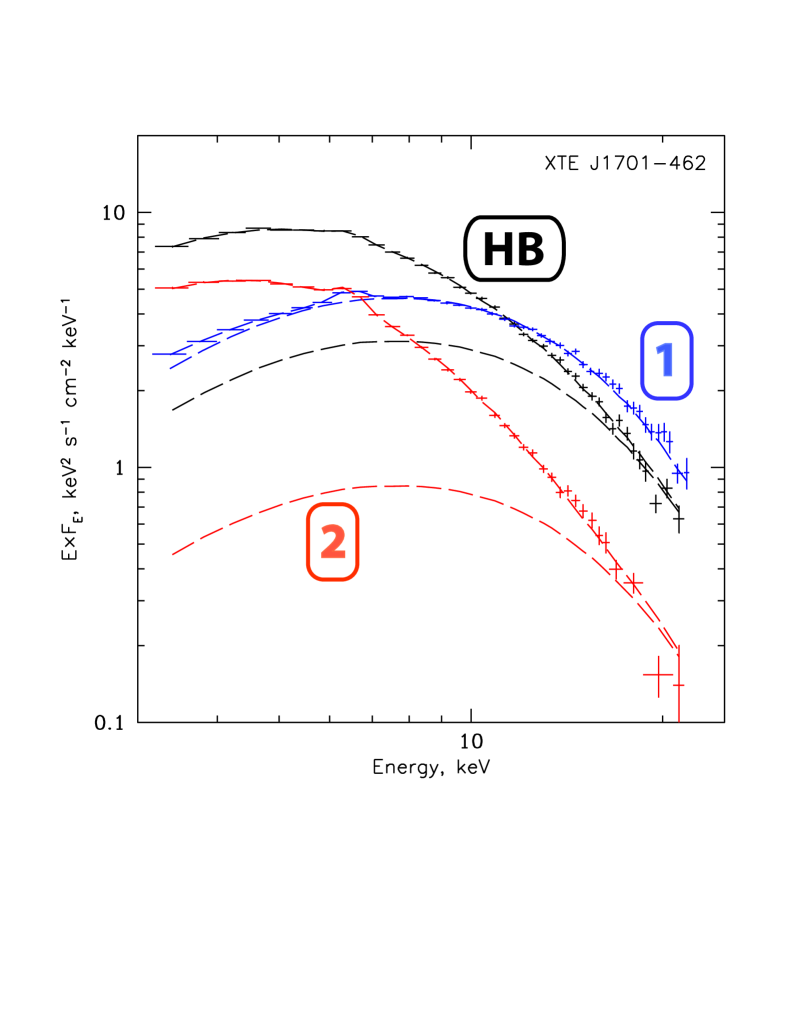
The resulting decomposition of the energy spectra of XTE J1701462 at different locations of the colour–intensity diagram, denoted as ”1”, ”2” and ”HB” and shown in Fig. 2, into the accretion disc and the BL/SL components is shown in Fig. 4. It can be seen that the quality of this simple fit is reasonable ( for 40 dof) and the BL/SL component dominates at energies above 10–15 keV.
4.2 Is this the Eddington-limited emission?
The key feature of the SL at the NS surface is the importance of the balance between the gravity and the sum of the centrifugal and radiation pressure forces (Inogamov & Sunyaev, 1999). The contributions of the centrifugal and radiation pressure forces change over the SL latitude, from the centrifugally-supported region at the NS equator to the radiation-pressure-supported region at the highest SL latitude. In the optically thick regime, it means that the maximum effective temperature and, therefore, the maximum colour temperature of the emission is set mainly by the gravity at the NS surface (Goldman, 1979; Marshall, 1982; Revnivtsev & Gilfanov, 2006). If the effective temperature of the emission exceeds the corresponding Eddington value (set by the gravity), the surface layers should be blown away by the radiation pressure force.
This is exactly what is observed in some powerful thermonuclear (type I) X-ray bursts, when at high luminosity level the radius of the NS photosphere starts to expand. It means that the colour temperatures of the NS photosphere at the beginning of the photospheric radius expansion (PRE) phase should be close to that of the radiation-pressure dominated BL/SL. The case of XTE J1701461 provides us a possibility to check this, because this source demonstrated the type I bursts (Lin et al., 2009b).
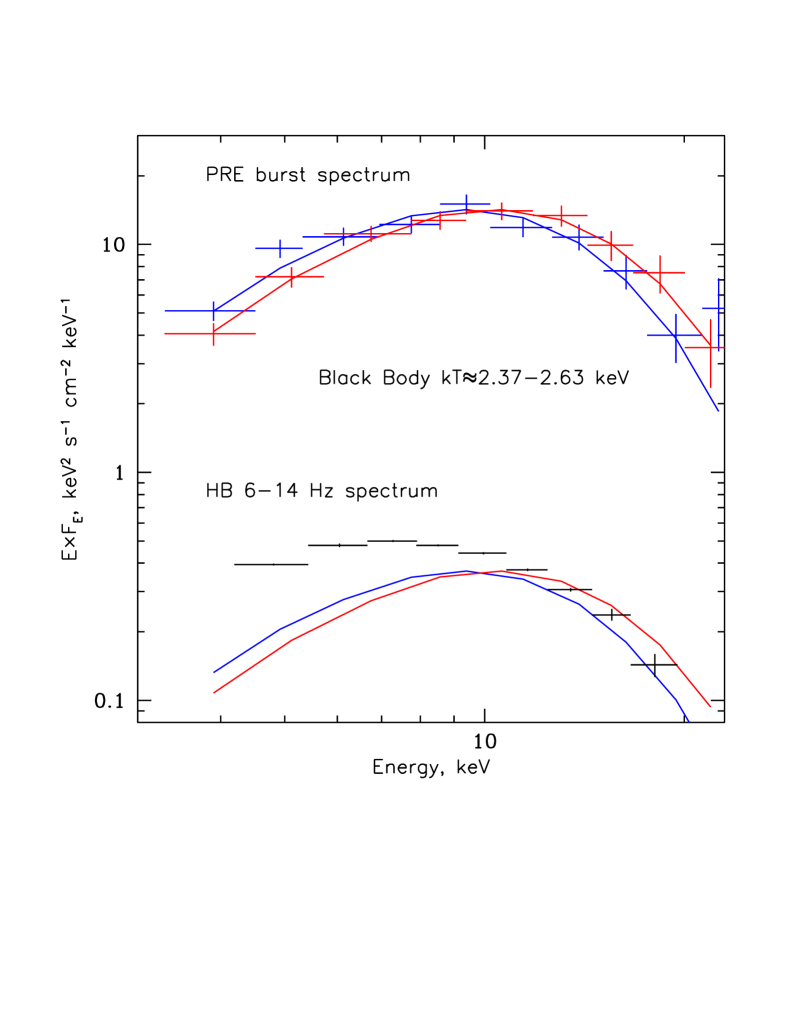
In Fig. 5, we present three spectra: the spectrum of the source just before the start of the PRE phase of the X-ray bursts observed on 2007 July 20 (see Lin et al., 2009b, for the detailed analysis of the bursts), the spectrum after the photosphere has settled down to the NS surface and the Fourier frequency resolved spectrum at horizontal branch of the Z-diagram of XTE J1701462, which is essentially the spectrum of the SL. We see that the colour temperature of the burst spectra are similar to the maximal colour temperature of the SL spectrum. This, therefore, supports our conclusion that the maximal colour temperature of the SL is set mainly by the NS gravity. The spectrum of the SL is wider, likely due to some distribution of effective temperatures over the SL surface. This might be caused by a variation of the role of the centrifugal force over the NS latitude that causes changes in the vertical structure of the SL (see Inogamov & Sunyaev, 1999).
4.3 Does SL spectrum vary with luminosity?
One of the very distinct feature of the colour-intensity diagram of XTE J1701462 (see Fig. 2) is the maximum level of the hard colour during its soft state (i.e. with fluxes above erg s-1 cm-2). The scatter plot created by behaviour of the source in its Z-state (more specifically, on the flaring branch of the Sco-like Z-state, see Lin et al. 2009a; Homan et al. 2010 for details of the classification) shows “flaring” tracks, which end up at the level of hardness . This hardness very closely corresponds to the hardness of the BL/SL spectrum, as determined from the Fourier frequency resolved spectra. A more detailed comparison of the Fourier frequency resolved spectrum and the hardest energy spectra at the top of the flaring branch shows that during these moments the BL/SL is the dominant contributor to the total emission of the source.

In order to demonstrate this fact, we present three spectra at Fig. 6. The top two spectra have been collected at the top parts of tracks on the colour-intensity diagram, which have hard colour above 0.96, but have very different fluxes. The upper spectrum has the absorption corrected flux erg s-1 cm-2 (position is denoted as ”1” on Fig. 2) and the lower one – erg s-1 cm-2 (position is denoted as ”3” on Fig. 2). The lowest spectrum is the Fourier frequency resolved spectrum taken at 6–14 Hz. It is clear that the spectra have similar (though not completely identical) spectral shapes and could be adequately described within the energy range 3-20 keV by either a power law model with the exponential cutoff , or by a model of saturated Comptonization comptt (with temperature of the seed photons keV, temperature of the Comptonizing electrons keV and their optical depth ). The curve shows the comptt spectral model scaled to match the different levels of the spectra (the quality of the fits by the analytical model of a power law with the exponential cutoff is similar). Similarity of these spectra allows us to conclude that at the top parts of the flaring tracks we see only emission of the SL.
At fainter fluxes (e.g. at position denoted as ”4” on Fig. 2), the source does not demonstrate the flaring behaviour anymore and therefore we cannot study the BL/SL emission in its “clear” state. However, as the BL/SL emission still dominates at high energies, we can look at the spectral shape there. In Fig. 7, we show that the colour temperature of the emission measured in the energy band 12–20 keV is perfectly compatible with that of the BL/SL at all larger fluxes. The excess clearly visible at energies below 10–12 keV can be attributed to the emission of the accretion disc.

There are two important conclusions from these spectral models:
-
•
At the top part of the flaring branch (with the largest hard colour), the BL/SL is virtually the only contributor to the total emission. The accretion disc component gives a negligible contribution to the observed spectrum.
-
•
The BL/SL spectrum does not change its spectral shape over at least a factor of 20 variations in its flux. The “Wien tail” colour temperature of the SL emission stays constant at the level of 2.4–2.6 keV.
5 Summary
We have analysed a complete dataset of observations of a unique NS transient XTE J1701462, which has demonstrated for the first time a large variety of patterns of spectral-timing behaviour. A large span of the source luminosities has allowed us to check the stability of the BL/SL spectrum. Our main results can be summarised as follows:
-
1.
The decomposition of the energy spectra of XTE J1701462 into constituent components cannot be unambiguously done with the help of the spectral fitting only. The assumptions about the spectral shape of the components play a crucial role in the resulting decomposition.
-
2.
We have demonstrated that the Fourier frequency resolved energy spectra of the source taken at frequencies above 1 Hz is adequately represented by one spectral component. We have argued that this spectral component originates from the BL/SL on the NS surface. The shape of this component is very similar to those extracted for a set of other sources, such as GX 340+0, 4U 160852, GX 17+2, Cyg X-2 and 4U 182030 (Revnivtsev & Gilfanov, 2006).
-
3.
We have demonstrated that the maximum colour temperature of the BL/SL spectrum does not vary over a factor of more than 20 variation of its flux. These findings strongly support the theoretical model of the BL/SL of Inogamov & Sunyaev (1999), which states that the maximum colour temperature of the BL/SL is set by NS gravity. Elaboration of this model will provide solid ground for accurate measurements of the NS masses and radii from X-ray observations.
Acknowledgements
MGR acknowledges the support from the grant NSh-5603.2012.2 of the program P19 of the Presidium of the Russian Academy of Sciences (RAS) and the program OFN17 of the Division of Physical Sciences of the RAS. The work of VFS is supported by the German Research Foundation (DFG) grant SFB/Transregio 7 ”Gravitational Wave Astronomy” and the Russian Foundation for Basic Research (grant 12-02-97006-r-povolzhe-a). This work was also supported by the Academy of Finland exchange program grants 259284 and 259490 (VFS, JP), and by the Jenny and Antti Wihuri foundation (VFS).
References
- Arnaud (1996) Arnaud K. A., 1996, in Jacoby G. H., Barnes J., eds, ASP Conf. Ser. Vol. 101, Astronomical Data Analysis Software and Systems V. Astron. Soc. Pac., San Francisco, p. 17
- Barret et al. (2000) Barret D., Olive J. F., Boirin L., Done C., Skinner G. K., Grindlay J. E., 2000, ApJ, 533, 329
- Bradt et al. (1993) Bradt H. V., Rothschild R. E., Swank J. H., 1993, A&AS, 97, 355
- Chodil et al. (1968) Chodil G., et al., 1968, ApJ, 154, 645
- Churazov et al. (2001) Churazov E., Gilfanov M., Revnivtsev M., 2001, MNRAS, 321, 759
- Church et al. (2012) Church M. J., Gibiec A., Bałucińska-Church M., Jackson N. K., 2012, A&A, 546, A35
- Ding et al. (2011) Ding G. Q., Zhang S. N., Wang N., Qu J. L., Yan S. P., 2011, AJ, 142, 34
- Di Salvo et al. (2002) Di Salvo T., et al., 2002, A&A, 386, 535
- Done et al. (2007) Done C., Gierliński M., Kubota A., 2007, A&ARv, 15, 1
- Fridriksson et al. (2010) Fridriksson J. K., et al., 2010, ApJ, 714, 270
- Gilfanov et al. (2003) Gilfanov M., Revnivtsev M., Molkov S., 2003, A&A, 410, 217
- Goldman (1979) Goldman I., 1979, A&A, 78, L15
- Homan et al. (2007) Homan J., et al., 2007, ApJ, 656, 420
- Homan et al. (2010) Homan J., et al., 2010, ApJ, 719, 201
- Inogamov & Sunyaev (1999) Inogamov N. A., Sunyaev R. A., 1999, AstL, 25, 269
- Jahoda et al. (2006) Jahoda K., Markwardt C. B., Radeva Y., Rots A. H., Stark M. J., Swank J. H., Strohmayer T. E., Zhang W., 2006, ApJS, 163, 401
- Lapidus, Syunyaev, & Titarchuk (1986) Lapidus I. I., Syunyaev R. A., Titarchuk L. G., 1986, SvAL, 12, 383
- Lin et al. (2007) Lin D., Remillard R. A., Homan J., 2007, ApJ, 667, 1073
- Lin et al. (2009a) Lin D., Remillard R. A., Homan J., 2009, ApJ, 696, 1257
- Lin et al. (2009b) Lin D., Altamirano D., Homan J., Remillard R. A., Wijnands R., Belloni T., 2009, ApJ, 699, 60
- London et al. (1986) London R. A., Taam R. E., Howard W. M., 1986, ApJ, 306, 170
- Marshall (1982) Marshall H. L., 1982, ApJ, 260, 815
- Mitsuda et al. (1984) Mitsuda K., et al., 1984, PASJ, 36, 741
- Revnivtsev et al. (1999) Revnivtsev M., Gilfanov M., Churazov E., 1999, A&A, 347, L23
- Revnivtsev & Gilfanov (2006) Revnivtsev M. G., Gilfanov M. R., 2006, A&A, 453, 253
- Shakura & Sunyaev (1973) Shakura N. I., Sunyaev R. A., 1973, A&A, 24, 337
- Shapiro et al. (1976) Shapiro S. L., Lightman A. P., Eardley D. M., 1976, ApJ, 204, 187
- Shimura & Takahara (1995) Shimura T., Takahara F., 1995, ApJ, 445, 780
- Sibgatullin & Sunyaev (2000) Sibgatullin N. R., Sunyaev R. A., 2000, AstL, 26, 699
- Suleimanov & Poutanen (2006) Suleimanov V., Poutanen J., 2006, MNRAS, 369, 2036
- Syunyaev & Shakura (1986) Syunyaev R. A., Shakura N. I., 1986, SvAL, 12, 117
- Taam & Lin (1984) Taam R. E., Lin D. N. C., 1984, ApJ, 287, 761
- Tananbaum et al. (1972) Tananbaum H., Gursky H., Kellogg E., Giacconi R., Jones C., 1972, ApJ, 177, L5
- Toor et al. (1970) Toor A., Seward F. D., Cathey L. R., Kunkel W. E., 1970, ApJ, 160, 209
- White et al. (1988) White N. E., Stella L., Parmar A. N., 1988, ApJ, 324, 363
- Wijnands & Degenaar (2013) Wijnands R., Degenaar N., 2013, MNRAS, submitted, arXiv:1305.3091