Effect of Ising-type Tb3+ ions on the low-temperature magnetism of La, Ca cobaltite.
Abstract
Crystal and magnetic structures of the member of La0.8-xTbxCa0.2CoO3 perovskite series have been determined from the powder neutron diffraction. Enhancement of the diffraction peaks due to ferromagnetic or cluster glass ordering is observed below K. The moments evolve at first on Co sites, and ordering of Ising-type Tb3+ moments is induced at lower temperatures by a molecular field due to Co ions. The final magnetic configuration is collinear Fx for cobalt subsystem, while it is canted FxCy for terbium ions. The rare-earth moments align along local Ising axes within ab-plane of the orthorhombic structure. The behavior in external fields up to kOe has been probed by the magnetization and heat capacity measurements. The dilute terbium ions contribute to significant coercivity and remanence that both steeply increase with decreasing temperature. A remarkable manifestation of the Tb3+ Ising character is the observation of a low-temperature region of anomalously large linear term of heat capacity and its field dependence. Similar behaviours are detected also for other terbium dopings and 0.3.
pacs:
61.05.fm;1 Introduction
The properties of perovskite cobaltites are largely affected by closeness in energy of different local states of the octahedrally coordinated cobalt ions. The well-known example is LaCoO3, in which a spin transition, or spin-state crossover, occurs in the course of temperature. It has been recognized that the LaCoO3 ground state is based on non-magnetic low spin state of Co3+ (LS, , ), while with increasing temperature above K, the energetically close high spin Co3+ (HS, , ) species start to be populated by thermal excitation [1]. The HS population is practically saturated above 150 K, making about 40-50%. Strong HS/LS nearest neighbor correlations or even short-range ordering are anticipated in that phase [2, 3, 4, 5]. At still higher temperature the ordering melts. This process is accompanied with a drop of electrical resistivity centered at about 530 K, which can be interpreted as a transition from Mott insulator to a quasi-metallic state. The high-temperature phase of LaCoO3 should be regarded as inhomogeneous, since it essentially retains the LS/HS Co3+ disproportionation with only short visits to intermediate spin (IS, , ) configurations [5].
While the pure LaCoO3 is paramagnetic at all temperatures, the doping of holes by chemical substitution brings generally ferromagnetic interactions and leads finally to the long-range ferromagnetic (FM) order. This evolution is best documented for the La1-xSrxCoO3 system [6, 7]. The mildly doped compounds exhibit a non-uniform ground state with hole-rich FM regions of IS/LS character for Co3+/Co4+, embedded in the hole-poor matrix with main weight of LS Co3+. The origin of such two-phase competition cannot be understood within any standard band picture, and is intimately associated with strongly correlated nature of the materials [8, 9]. The transition to a more homogeneous state is observed at as documented by onset of metallic conductivity and finite electronic heat with linear coefficient mJ/K2 [10]. Above this critical concentration, the La1-xSrxCoO3 compounds show characteristics of conventional ferromagnets, namely the large -anomaly in the specific heat at and the critical behavior manifested by a sharp peak in small-angle neutron scattering and by critical exponents , and belonging to universality class of 3D Heisenberg model [6, 7, 11].
The situation in calcium doped system La1-xCaxCoO3 is less explored. In this case a much more uniform FM phase seems to form starting from weak doping, though the saturated moments are low and no metallic conductivity is reached [12, 10, 13]. There are, nevertheless, few reports pointing to a certain phase separation, similarly to what is known for La1-xSrxCoO3. In particular, it is demonstrated on La1-xCaxCoO3 single crystals () that their magnetic state evolves from ensemble of weakly interacting spin clusters to typical cluster glass [14]. The ferromagnetic phase is formed at higher Ca content, in particular below 170 K for [10]. Interestingly, a reentrant spin glass transition has been observed at 100 K, and magnetic relaxation experiments have shown that both the ferromagnetic and the reentrant spin-glass phases in are nonequilibrium states, which exhibit a magnetic aging characteristic for spin glasses or disordered and frustrated ferromagnets [15].
In order to understand better the behavior of LaCoO3-related compounds with the calcium doping, we have undertaken the study of the La0.8-xTbxCa0.2CoO3 system. The Tb3+ ions have been selected since they show complex magnetic behavior due to crystal field effects, and can be effectively used as local probe of the low-temperature magnetism produced by cobalt subsystem. We have found, with the help of the neutron diffraction, magnetic measurements and investigation of low-temperature heat capacity, that the magnetic ground state is highly non-uniform and Ising-type Tb3+ moments influence critically the magnetic properties.
2 Experimental
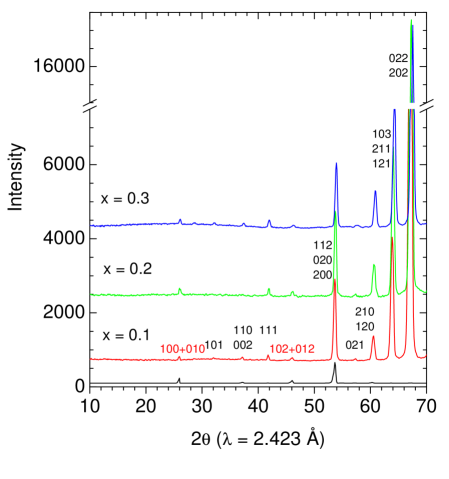
Samples La0.8-xTbxCa0.2CoO3 (, 0.2 and 0.3) were synthesized by a sol-gel procedure followed by annealing at 1000 under air for at least 24 hours. The starting materials included stoichiometric amounts of La2O3, Tb4O7, CaCO3 and Co(NO3)2 solutions with chemically determined metal content while ethylene glycol was used to prepare the gel precursor. The final products were checked for phase purity by X-ray diffraction. The perovskite crystal structures are of the orthorhombic type, except for a small coexistence of the phase in the sample. More detailed structural investigation was performed by neutron diffraction in LLB (Saclay, France) on the G41 diffractometer using a wavelength of 2.422 Å. The neutron diffraction data, obtained at selected temperatures down to 1.8 K, were analyzed by a Rietveld method with the help of the FULLPROF program (version 4.80/2010).
For a complex physical characterization the compound (La0.6Tb0.2Ca0.2CoO3) was selected. The magnetic moment was measured on a SQUID magnetometer (MPMS-XL; Quantum Design) over the range K under various field 100 Oe - 70 kOe. The zero-field-cooled (ZFC) and field-cooled (FC) runs were performed. The hysteresis loops were measured up to maximum field of 70 kOe at selected temperatures starting from K upwards. The remanent magnetization dependence was measured after recording the hysteresis loop K and decreasing to zero. The ZFC long-time relaxation experiments were performed by cooling the sample from K to a target temperature and keeping it for a certain wait time , typically sec, before setting the field Oe and starting the measurement. The time evolution of the magnetic moment was then recorded between and sec. The AC susceptibility measurements were carried out with the amplitude of driving field 3.9 Oe and frequency Hz.
The specific heat was measured by PPMS device (Quantum Design) using the two model. The data at zero field and under fields up to 90 kOe were collected generally on sample cooling. The experiments at very low temperatures (down to 0.4 K) were done using the He3 option.
3 Results and discussion
3.1 Transport properties
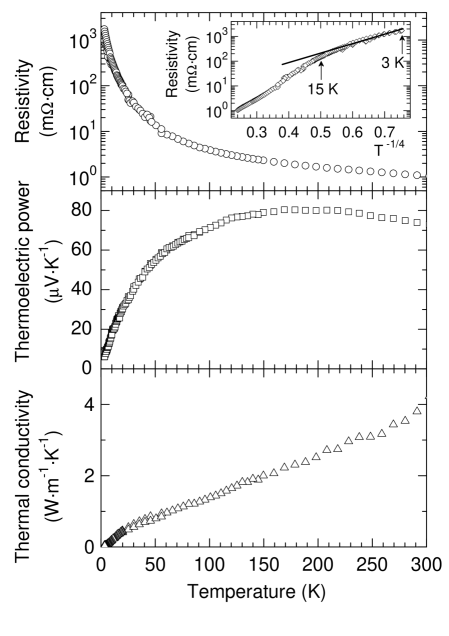
As a first physical characterization of the La0.6Tb0.2Ca0.2CoO3 system, the basic transport phenomena were probed. Fig. 1 presents the temperature dependence of electrical resistivity, thermoelectric power and thermal conductivity. The displayed data show that the electronic transport is of a transitional behavior between the strongly activated semiconductor LaCoO3 and the doped ferromagnetic metallic compounds La1-xSrxCoO3. The actual regime, manifested by the activated resistivity and linear (metallic-like) thermopower at the lowest temperatures, can be described as the variable range hopping. This type of behavior is typical for systems with localized electronic states forming a quasi-continuous band around Fermi level; for doped cobaltites see e.g. [16]. The resistivity above K follows a non-standard power law dependence, similarly to what was reported earlier for some polycrystalline specimens of electron-doped LaCoO3 [17] or mixed systems LaCo1-xCuxO3 [18].
3.2 Crystal structure
| T (K) | 1.8 | 100 | 300 |
|---|---|---|---|
| a (Å) | 5.3686(5) | 5.3693(6) | 5.3852(6) |
| b (Å) | 5.3539(4) | 5.3567(6) | 5.3713(6) |
| c (Å) | 7.5674(6) | 7.5732(7) | 7.5945(8) |
| x,LaTbCa | -0.0005(11) | -0.0075(8) | -0.0077(8) |
| y,LaTbCa | 0.0294(5) | 0.0279(4) | 0.0262(5) |
| x,O1 | 0.0750(13) | 0.0634(9) | 0.0618(9) |
| y,O1 | 0.4911(7) | 0.4912(6) | 0.4930(7) |
| x,O2 | -0.2775(8) | -0.2793(7) | -0.2803(7) |
| y,O2 | 0.2813(7) | 0.2793(6) | 0.2770(8) |
| z,O2 | 0.0303(6) | 0.0345(4) | 0.0339(4) |
The crystal and magnetic structure of La0.6Tb0.2Ca0.2CoO3 perovskite was determined from the powder neutron diffraction, measured at the temperatures from 1.8 to 300 K. Let us note that, without terbium substitution, the crystal structure of La1-xCaxCoO3 changes from rhombohedral (space group ) for to orthorhombic (space group ) for , with both phases coexisting in the intermediate doping range [19, 20]. For La0.6Tb0.2Ca0.2CoO3 the single orthorhombic structure is observed over the whole experimental temperature range. For three selected temperatures the complete data including atomic coordinates are presented in Table 1. The occupancy of oxygen sites is refined to 1.009, pointing to oxygen content in the La0.6Tb0.2Ca0.2CoO3 sample slightly above the ideal stoichiometry. This result may suggest that the cobalt valence in La0.6Tb0.2Ca0.2CoO3 is shifted from the formal mixture 0.2 Co4+/0.8 Co3+ to actual 0.25 Co4+/0.75 Co3+. The goodness of Rietveld fit is characterized by values %, % and % at 300 K, and %, %, % and % at 1.8 K.
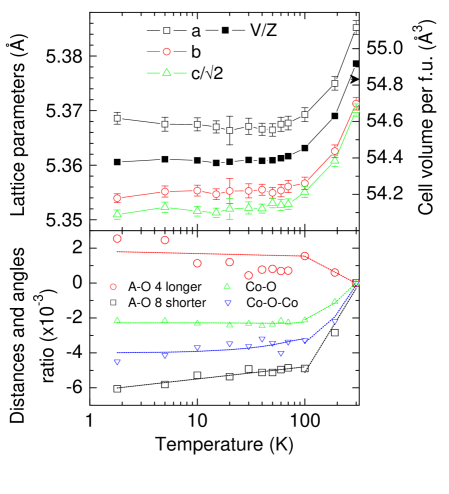
The temperature evolution of lattice parameters and cell volume per f.u. is displayed in the upper panel of Fig. 2. The relation between lattice parameters, , is different from the situation in perovskites ABO3 with smaller A cations (and smaller tolerance factor), for which the tilting of the octahedra network is the dominant source of the orthorhombic distortion, and the relation between lattice parameters is typical. The present type of orthorhombic deformation should be thus related to a small sheer distortion of the CoO6 octahedron, namely the deviation of O-Co-O angles from 90o, that prevails over effects of the octahedral tilting.
The extent of octahedral tilting is quantified by the average bond angle Co-O-Co, which makes 160o at the room temperature, decreases to 159.5o at 100 K and then to 159.2o at the lowest temperature. The average Co-O bond distance decreases from 1.930 Å at 300 K to 1.926 Å at 100 K, but then it is approximately constant down to the lowest temperature. The CoO6 octahedron is almost regular, the difference between the longest and shortest Co-O distance does not exceed 0.02 Å. The three non-equivalent O-Co-O angles in structure range between o.
The change of CoO6 tilting incurred by lowering temperature is also reflected in the temperature evolution of coordination sphere of the big cation (La0.6Tb0.2Ca0.2) in the A site of perovskite structure. The 12 bonds could be divided into two groups of 8 shorter and 4 longer distances, having different evolution with temperature, see the lower panel of Fig. 2. The 8 shorter bonds shorten relative to room temperature values, whereas the 4 longer bonds elongate compared to room temperature. The temperature evolution of the shorter A-O bonds resembles closely that of Co-O-Co bond angle.
3.3 Magnetic properties
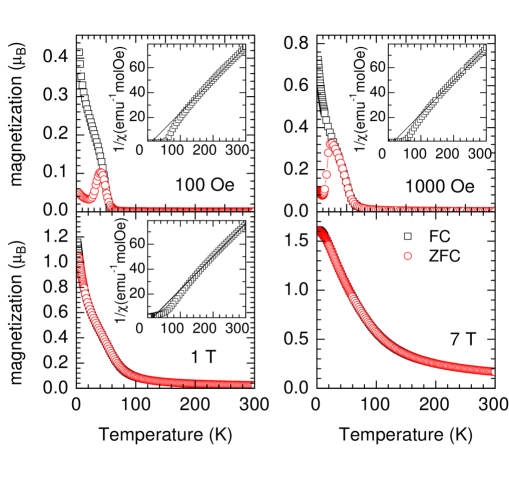
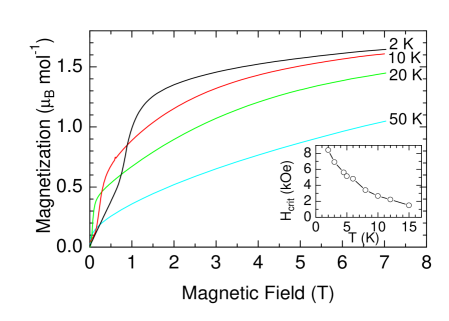
Magnetic properties of La0.6Tb0.2Ca0.2CoO3 were probed by the DC magnetization measurements and by the frequency dependent AC susceptibility experiments. The temperature curves of magnetic moment measured under various fields from 100 Oe to 70 kOe are presented in Fig. 3. The moments observed above K are proportional to applied field, which is a signature of paramagnetic state. The paramagnetic properties are more apparent in the insets of Fig. 3 where data are plotted in terms of inverse susceptibility. With increasing temperature the Curie-Weiss dependence is approaching, where the molar value of Curie constant depends on the effective paramagnetic moment, . The fit yields per f.u. and Weiss temperature K. The square value of the effective moment agrees with a theoretical expectation, namely the weighted sum of for 0.2 Tb3+ (the free-ion value ) and valence mixture 0.25 Co4+/0.75 Co3+, both in the intermediate spin state ( and 1, respectively), which gives total . The positive Weiss is attributed to FM interaction between Co ions, since the interaction between more diluted Tb ions is supposedly weak and of antiferromagnetic (AFM) type.
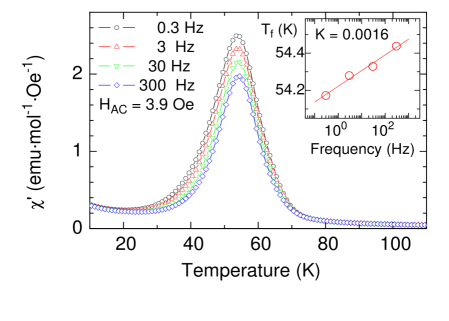
Below K the magnetic moment rapidly increases. The low-temperature diverging tail of FC curves, clearly observed in Fig. 3 up to 10 kOe, can be assigned mainly to the magnetic response of Tb3+ ions. There is an inflection point at about 20 K, which suggests that this paramagnetic-like term is superimposed on another term due to Co3+/Co4+ ions, having a form close to Brillouin curve. This latter contribution and its gradual saturation in high fields remind the behaviour of a conventional ferromagnet. However, the bifurcation between ZFC and FC curves, which shifts with increasing field to lower temperatures, indicates rather the formation in La0.6Tb0.2Ca0.2CoO3 of a non-uniform state of glassy character. This conclusion is further supported by AC susceptibility measurements over the frequency range Hz, presented in Fig. 4. As shown in the inset, the characteristic temperature , at which the real part passes through a maximum, exhibits with increasing frequency of the applied AC field an upward shift that can be quantified by a semiempirical dimensionless parameter . Such weak frequency dependence, compared to much larger -values in canonical spin-glass systems [21], suggests that FM clusters that freeze near K are relatively large.
Typical manifestation of the frustrated magnetic state is the long-time relaxation of magnetization and ageing effects. The data we obtained are nearly identical with results of Nam et al on polycrystalline La0.5Sr0.5CoO3 exhibiting similar non-uniform magnetic state in which the FM and glassy behaviors coexist [22]. In particular, for K, i.e. slightly below the freezing temperature, the relaxation of moment after application of probing field Oe could be described by the stretched exponential function and the maximum of derivative of with respect to is attained at the elapsed time close to the wait time (, 2000 and 3000 sec).
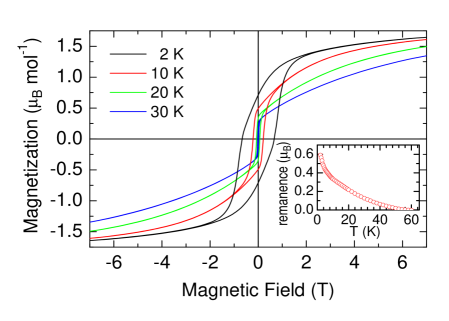
The magnetization curves for K are presented in Fig. 5. In the temperature range down to K the magnetization shows a rapid rise at lower fields, but the next increase is more gradual and lacks saturation in the highest field of 70 kOe. All these features differ from the conventional behavior of bulk FM and are typical for cluster glass with broad size distribution of FM domains and strong AFM interactions between them. Below K, an anomalous behavior is observed. The virgin magnetization curves are specified by a linear initial part followed by a break after which a steep rise, resembling a metamagnetic transition, occurs. The critical field corresponding to the break increases with decreasing temperature in a hyperbolic way as seen in the inset of Fig. 5. Since our neutron diffraction study does not indicate any change of magnetic ground state below 15 K, the existence of the metamagnetic transition can be discarded. Instead, we relate the observed character of magnetization curves to the low-temperature effect of Tb3+ moments. Namely, the local anisotropy connected with the presence of Tb3+ ions may lead to the pinning of domain walls in FM ordered regions, which influences both the coercivity seen in hysteresis loops (Fig. 6) and the metamagnetic-like form of virgin curves. Let us note that the coercive field reaches kOe at 2 K, and the above mentioned ”metamagnetic transition” is observed at the same field.
We may conclude this section by a statement that the chemically highly inhomogeneous compound La0.6Tb0.2Ca0.2CoO3 shows a spectrum of behaviors, some of which are typical for bulk FM and others remind glassy systems. Apart of clear manifestations of long-range order like open hysteresis loops or survival of a finite remanent magnetization up to 55 K (see the inset of Fig. 6), there is an evidence of short- and long-time relaxation processes.
3.4 Magnetic ordering
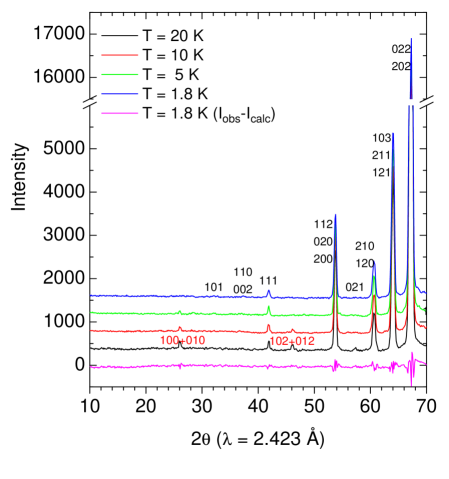
The neutron diffraction data of La0.6Tb0.2Ca0.2CoO3 at selected low temperatures are displayed in Fig. 7. Presence of magnetic ordering is generally manifested in the neutron diffraction data as an enhancement of some low-angle diffraction peaks. In closer inspection, one may indeed notice a very weak peak at the calculated position of (110+002) reflection, whose nuclear contribution is accidentally zero for present compound. This peak emerges below K and, at the same temperature, a small enhancement of the relatively strong 112+020+200 reflection can be detected. Such additional intensity is an indication of magnetic contribution due to long-range FM ordering of cobalt spins at least in a part of the sample. A further change can be observed below 20 K. First, the intensity of 112+020+200 starts to increase more rapidly, while that of 110+002 practically vanishes. The opposite changes on these peaks suggest that also the terbium moments at A-sites adopt FM ordering, and their orientation is parallel to the cobalt ones. Namely, the intensity of neutron diffraction peak 110+002 drops since it is given by square of , while the intensity 112+020+200 given by square of raises.
The second, well marked change below 20 K is the appearance of new magnetic peaks at 100+010 and 102+012 positions. These peaks are indicative for the C-type AFM arrangement in the sample and may originate either in magnetic phase coexistence or in spin canting. Although a partial AFM order of cobalt spins was already detected by neutron diffraction for some cobaltites of similar doping, like La1-xBaxCoO3 () [23], we relate the present observation to the canted arrangement of Tb3+ moments within the FM phase. Let us note that the canting is an inevitable consequence of Ising character of the Tb3+ moments and alternation of easy axes in the ab-plane of the orthoperovskite structure [24]. More known example is the TbCoO3 cobaltite with non-magnetic LS Co3+, which shows below T K a spontaneous Tb3+ ordering also of canted type, in Bertaut’s notation [25, 26].
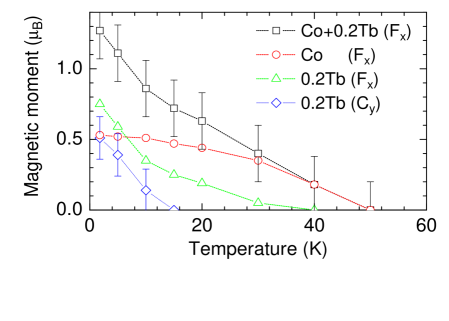
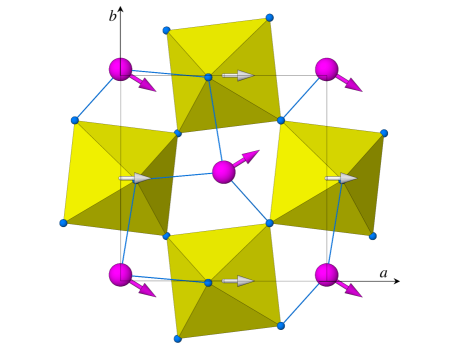
The results of the Rietveld refinement are presented in Fig. 8. The spontaneous ordering is established at first on Co sites, and the ordering of the Tb moments arises gradually at lower temperatures by action of molecular field induced by Co ions. The crystallographic orientation of Co moments cannot be unambiguously determined due to small splitting of reflections of the pseudocubic perovskite cell. We suppose that the magnetic axes of FM domains are distributed rather randomly, but below 20 K the Co spins align in accordance with the easy local axes of Ising-type Tb3+ ions, which are within the ab-plane, inclined to o out of b-direction. Based on this angle, found actually on related perovskite system TbAlO3 [24], and using the observed moments at 1.8 K in Fig. 8, we may conclude that the final configuration is of collinear type with long-range ordered moment of /Co, and the rare-earth ordered moments form the canted arrangement FxCy with average components per site and , or per rare-earth ion, /Tb and /Tb. This means that the terbium moments are inclined from the -axis to 34o and their ordered magnitudes make . The orientation of canted arrangement with respect to the crystallographic axes then tells that the AFM diffraction lines observed at 100+010 and 102+012 positions in the K diffraction pattern in Fig. 7 are in fact the (100) and (102) intensities, while (010) and (012) are extinguished. As the bulk magnetic moment is concerned, the sum of FM components of the Co and Tb ions, per f.u. at 1.8 K, seems to correspond very well to the magnetization data in Figs. 5 and 6 when an intuitive extrapolation to zero field is done.
The same set of FM and AFM reflections and, consequently, very similar magnetic structures (see Fig. 12 below) have been observed also for other terbium dopings in our La0.8-xTbxCa0.2CoO3 series. For a comparison, the low-angle parts of neutron diffraction patterns of , 0.2 and 0.3 at 1.8 K are presented together in Fig. 9. The refined moments at cobalt sites and the magnitudes of terbium moments and their inclination from the orthorhombic axis are summarized in Table 2.
| TC(K) | 80 | 55 | 30 |
|---|---|---|---|
| /Co | 1.05 | 0.55 | 0.35 |
| /Tb | 8.4 | 4.5 | 3.0 |
| (o) | 33 | 34 | 31 |
3.5 Heat capacity
The heat capacity measurements on La0.8-xTbxCa0.2CoO3 did not show any observable -anomaly around their Curie temperatures K, 55 K and 30 K for x = 0.1, 0.2 and 0.3, respectively. This means that critical fluctuations associated with magnetic ordering are distributed over much larger temperature range than it is for conventional ferromagnets. Let us mention an analogous lack of criticality at apparent of Pr0.7Ca0.3CoO3, which was attributed by El-Khatib et al to a magnetic/electronic phase separation where FM clusters (presumably hole-rich objects), preformed at temperatures as high as K, coexisted with the hole-poor paramagnetic matrix [27].
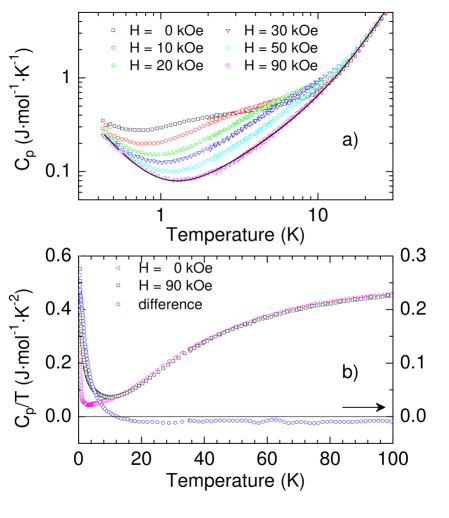
The behaviour at the lowest temperatures is exemplified by the heat capacity data for La0.6Tb0.2Ca0.2CoO3, presented in the upper panel of Fig. 10. There is a marked component that is spanning below 10 K and seems to be proportional to the terbium doping. It decreases with applied field and apparently vanishes in the maximum field of 90 kOe. The residual heat or background can be fitted by a sum of common contributions, known for transition metal oxides. The dominant term is the lattice heat , which is complemented with rather large linear specific heat and marked Schottky anomaly at the lowest temperatures, . To improve the fit, a small quadratic term is included. Let us note that similar but somewhat larger quadratic term was observed earlier for the phase separated systems La1-xSrxCoO3 with x and was attributed to the non-FM regions [7]. Exact mechanism, remained, however, unclear. In the same work the Schottky anomalous term due to 59Co nuclei experiencing hyperfine field in FM regions was also analyzed. It appears that the present value of coefficient JKmol-1 is order of magnitude larger, so that its nature should be different. We ascribe such enhanced term to the contribution of 159Tb nuclei present in FM regions, and argue by very large electronic moment of Tb3+ ions and hyperfine coupling constant 400 kOe/, compared to and 80 kOe/ for Co3+/Co4+ in Ref. [7].
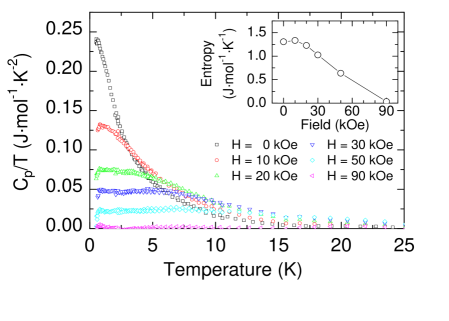
Let us turn now to the specific heat excess that emerges in lower fields. In the difference graph in the lower panel of Fig. 10, it is seen that the entropy associated with excessive heat at zero field is seemingly transformed, at 90 kOe, to a larger linear specific heat that extends at least up to 100 K, i.e. well above Curie temperature of long-range ordered regions, K. The actual change of coefficient is about 0.010 JK-2mol-1, and we suppose it scales with applied field and modifies the background. After subtraction the background terms, the excessive heat contribution is plotted in graph in Fig. 11. The characteristic feature is the large roughly constant part, which becomes obvious in applied fields and corresponds in fact to an additional linear term =. The value of decreases with increasing external field whereas the temperature range of linear regime expands. We note that linear specific heat is a general property of glassy systems, both the dielectrics and spin glasses. However, in the present system this term should be attributed to Tb3+ ions in FM regions, where they experience, even in the absence of external field, a non-zero randomly oriented internal field. It is essential for existence of such linear specific heat that the Tb3+ ions possess finite moments of Ising character [28]. This issue will be discussed below.
The entropy associated with Tb3+ ions in La0.6Tb0.2Ca0.2CoO3 can be calculated by integration of excessive . The data plotted in the inset of Fig. 11 show that the entropy change at zero field makes actually JK-1mol-1. This value is in reasonable agreement with theoretical per ion, which gives 1.15 JK-1mol-1 for population of 0.2 Tb3+ per f.u. Nonetheless, the integral value over the temperature range of Fig. 11 is not conserved and decreases quickly with increasing external field. As mentioned above, the low-temperature entropy is transferred to larger linear specific heat at intermediate temperatures or to a modified stiffness of the system.
4 Discussion
Our comprehensive investigation of the La0.6Tb0.2Ca0.2CoO3 system provides a significant amount of information on the role of rare-earth ions. No signatures for eventual presence of Tb4+ ions are observed and we may also argue that this valence state is unfavourable since it would increase much the size disorder on the perovskite A-sites. The rare-earth ions are thus in the Tb3+ state in electronic configuration , which is a non-Kramers ion. The lowest lying free-ion term is (, , ), and it is split by the low-symmetry crystal field to 13 singlets. The calculations available for TbAlO3 of the same symmetry show that the ground and first excited states of Tb3+ ion are formed of 90% by two conjugate wavefunctions, and , and their eigenenergies differ by only 0.025 meV, representing a quasi-doublet [24]. This specific kind of accidental degeneracy has important consequences. Firstly, a relatively modest magnetic field of external or molecular nature will mix the eigenstates into a form of two pseudospins with the main weight of and , respectively. This results in large magnetic moment of Tb3+ ions of about 8.4 . Secondly, these moments have essentially an Ising-like character, which is a source of large local anisotropy and makes La0.6Tb0.2Ca0.2CoO3 the strongly coercitive system. This property is reflected in the virgin magnetization curves by apparent ”metamagnetic transition”, and in the hysteresis loop by remanent moment and coercive field both gradually increasing below K.
The local Ising axes are oriented in the -plane of the perovskite structure. Since there are two crystallographically equivalent sites of Tb3+ ions related by reflection in the -plane, their Ising axes make an angle with the orthorhombic axis . The angle o has been determined for TbAlO3 and, in the absence of spectroscopic data, we suppose similar inclination also for present La0.6Tb0.2Ca0.2CoO3, though the energy splitting of electronic levels might be here reduced due to smaller octahedral tilting. Let us note that the - and -components of moments deduced from the neutron diffraction, /Tb and /Tb, correspond in fact to o, and a similar inclination is determined also for La0.8-xTbxCa0.2CoO3 systems with other terbium dopings. What is varied are the magnitudes of the ordered cobalt and terbium moments that rapidly decrease with . The data in Table 2 show that Tb3+ in exhibits the full theoretical moment /Tb, which signifies a complete long-range ordering in this sample, while the moments observed by neutron diffraction in samples with higher terbium contents, namely our target composition La0.6Tb0.2Ca0.2CoO3 () and sample , drop gradually. By the comparison, we may conclude that the population of long-range ordered domains ( nm) in the latter samples is reduced to 50% and 33%, respectively.
The Ising character of Tb3+ pseudospins elucidates also the character of low-temperature specific heat of La0.6Tb0.2Ca0.2CoO3, namely it provides an explanation for the anomalously large linear term. In the FM phase of mixed-valence cobaltites, each Tb3+ ion experiences certain molecular field causing Zeeman splitting of the quasi-doublet, where is the anisotropic gyromagnetic factor. The thermal population of the two electronic levels gives a standard Schottky peak in specific heat. As pointed by Coey and von Molnar, when molecular and applied fields are randomly oriented making an angle with respect to local Ising axes, the Zeeman splitting varies as and, instead of two sharp levels, the system as a whole exhibits a continuous spectrum of excitations with constant density of states from to . Namely, the constant density of states is prerequisite for the strictly linear specific heat [28]. We believe that the same mechanism applies for present La0.6Tb0.2Ca0.2CoO3. Although the molecular field orientation at zero external field will depend on details of the non-uniform FM phase, the randomness is guaranteed at increased applied fields because of polycrystalline nature of our sample.
5 Conclusions
The perovskite cobaltite La0.6Tb0.2Ca0.2CoO3 is a highly inhomogeneous chemical system with large size disorder of A-site cations (La, Tb, Ca). The magnetic interactions of Co3+/ Co4+ ions have clear prevalence of FM exchange, which is evidenced by FM-like susceptibility transition though typical -anomaly in heat capacity is absent. We presume that the formation of FM phase starts as nucleation of many FM regions that grow progressively and align according to anisotropy axes defined by local strains and local fluctuations of charge carrier density. A non-uniform magnetic state with coexistence of ordered and disordered regions, varying with the temperature is thus anticipated. The neutron diffraction detects, nonetheless, a long-range FM order of cobalt moments below K. This spontaneous alignment of cobalt spins is a source of molecular field that acts on the Tb3+ ions, which are randomly distributed over the A sites of perovskite structure together with the non-magnetic La3+ and Ca2+ ions. As a result of theis molecular field, the terbium pseudospins are gradually polarized and their static arrangement becomes observable below K. The experiments show that the effective cobalt-terbium interaction is ferromagnetic, but the resulting arrangement of terbium moments is canted due to alternating orientation of their local Ising axes. To summarize, the kind of magnetic structure actually observed (see Fig. 12) and anomalous low-temperature linear term of the specific heat point to a strong effect of Tb3+ ions with large Ising-type moments on the low-temperature magnetic behaviour of La,Ca-based cobaltites.
References
References
- [1] Goodenough J B 1958 J. Phys. Chem. Solids 6 287
- [2] Bari R A and Sivardiére J 1972 Phys. Rev. B 5 4466
- [3] Kyômen T, Asaka Y and Itoh M 2005 Phys. Rev. B 71 024418
- [4] Knížek K, Jirák Z, Hejtmánek J, Novák P and Ku W 2009 Phys. Rev. B 79 014430
- [5] Křápek V, Novák P, Kuneš J, Novoselov D, Korotin D M and Anisimov V I 2012 Phys. Rev. B 86 195104
- [6] He C, El-Khatib S, Wu J, Lynn J W, Zheng H, Mitchell J F and Leighton C 2009 Europhys. Lett. 87 027006
- [7] He C, Eisenberg S, Jan C, Zheng H, Mitchell J F and Leighton C 2009 Phys. Rev. B 80 214411
- [8] Sboychakov A O, Kugel K I, Rakhmanov A L and Khomskii D I 2009 Phys. Rev. B 80 024423
- [9] Suzuki R, Watanabe T and Ishihara S 2009 Phys. Rev. B 80 054410
- [10] Muta K, Kobayashi Y and Asai K 2002 J. Phys. Soc. Jpn. 71 2784
- [11] Khan N, Midya A, Mydeen K, Mandal P, Loidl A and Prabhakaran D 2010 Phys. Rev. B 82 064422
- [12] Taguchi H, Shimada M and Koizumi M 1982 J. Solid State Chem. 41 329
- [13] Kriener M, Zobel C, Reichl A, Baier J, Cwik M, Berggold K, Kierspel H, Zabara O, Freimuth A and Lorenz T 2004 Phys. Rev. B 69 094417
- [14] Szymczak H, Baran M, Babonas G J, Diduszko R, Fink-Finowicki J and Szymczak R 2005 J. Magn. Magn. Mater. 285 386
- [15] Kundu A K, Nordblad P and Rao C N R 2005 Phys. Rev. B 72 144423
- [16] Hejtmánek J, Šantavá E, Knížek K, Maryško M, Jirák Z, Naito T, Sasaki H and Fujishiro H 2010 Phys. Rev. B 82 165107
- [17] Jirák Z, Hejtmánek J, Knížek K and Veverka M 2008 Phys. Rev. B 78 014432
- [18] Dlouhá M, Hejtmánek J, Jirák Z, Knížek K, Veverka M and Vratislav S 2011 J. Supercond. Nov. Magn 24 741
- [19] Burley J C, Mitchell J F and Short S 2004 Phys. Rev. B 69 054401
- [20] Mastin J, Einarsrud M A and Grande T 2006 Chem. Mat. 18 1680
- [21] Mydosh J A 1993 Spin Glasses: an experimental introduction (Taylor&Francis, London)
- [22] Nam D N H, Jonason K, Nordblad P, Khiem N V and Phuc N X 1999 Phys. Rev. B 59 4189
- [23] Tong P, Yu J, Huang Q Z, Yamada K and Louca D 2011 Phys. Rev. Lett. 106 156407
- [24] Gruber J B, Nash K L, Yow R M, Sardar D K, Valiev U V, Uzokov A A and Burdick G W 2008 J. Lumines. 128 1271
- [25] Kappatsch A, Quezel-Ambrunaz A and Sivardiére J 1970 J. Phys. France 31 369
- [26] Muñoz A, Martínez-Lope M J, Alonso J A and Fernández-Díaz M T 2012 Eur. J. Inorg. Chem. 2012 5825
- [27] El-Khatib S, Bose S, He C, Kuplic J, Laver M, Borchers J A, Huang Q, Lynn J W, Mitchell J F and Leighton C 2010 Phys. Rev. B 82 100411
- [28] Coey J M D and von Molnar S 1978 J. Physique Lett. 39 L327