First Systematic Search for Oxygen-Line Blobs at High Redshift: Uncovering
AGN Feedback and Star-Formation Quenching
Abstract
We present the first systematic search for extended metal-line [O ii]3726,3729 nebulae, or [O ii] blobs (O iiBs), at using deep narrowband imaging with a survey volume of Mpc3 on the 0.62 deg2 sky of SubaruXMM Deep Survey (SXDS) field. We discover a giant O iiB, dubbed “O iiB 1,” with a spatial extent over kpc at a spectroscopic redshift of , and also identify a total of 12 O iiBs with a size of kpc. Our optical spectrum of O iiB 1 presents [Ne v]3426 line at the level, indicating that this object harbors an obscured type-2 active galactic nucleus (AGN). The presence of gas outflows in this object is suggested by two marginal detections of Fe ii absorption and Fe ii∗ emission lines both of which are blueshifted at as large as km s-1, indicating that the heating source of O iiB 1 is AGN or associated shock excitation rather than supernovae produced by starbursts. The number density of O iiB 1-type giant blobs is estimated to be Mpc-3 at , which is comparable with that of AGNs driving outflow at a similar redshift, suggesting that giant O iiBs are produced only by AGN activity. On the other hand, the number density of small O iiBs, Mpc-3, compared to that of galaxies in the blue cloud in the same range, may imply that 3% of star-forming galaxies at are quenching star formation through outflows involving extended [O ii] emission.
Subject headings:
galaxies: evolution — galaxies: high redshift1. Introduction
Elliptical galaxies are one of the most common galaxy populations in the local universe. They are featureless and dominated by old stars with very low or zero star formation rates (SFRs). Their formation and evolution processes have been studied over decades both theoretically and observationally. Many simulations suggest that major mergers of two galaxies with comparable masses can produce giant elliptical galaxies (Toomre 1977; Barnes & Hernquist 1992; Naab & Trujillo 2006). Basically, the progenitors of elliptical galaxies have to stop forming new stars and begin evolving passively at some epoch in the past. That epoch should be as early as , because the luminositysize and stellar masssize relations of early-type galaxies from evolve consistently with completely passive evolution of their stellar populations (Trujillo & Aguerri 2004; McIntosh et al. 2005). It is not yet understood what makes galaxies stop forming stars and start to evolve passively. One popular proposed mechanism for quenching star formation is gas outflows by a starburst and/or an active galactic nucleus (AGN; e.g., Dekel et al. 2009). Therefore, studying outflow processes at (especially in massive galaxies) is of importance in understanding the evolution of quiescent elliptical galaxies.
Besides the quenching process of star formation activity, the gas outflow is also a crucial solution to various observational puzzles seen, e.g., in the massmetallicity relation (e.g., Tremonti et al. 2004) and the chemical enrichment of the interstellar medium (ISM) and the intergalactic medium (IGM; e.g., Martin 2005; Rupke et al. 2005a, b; Weiner et al. 2009; Coil et al. 2011). Galactic outflows are theoretically the primary mechanism for regulating the baryon and metallicity abundances of galaxies. Without strong feedback, cosmological models of galaxy evolution produce too many galaxies with high SFRs and large stellar masses compared to observations (e.g., Cole et al. 2000; Springel & Hernquist 2003; Kereš et al. 2009). Some process is thus needed to prevent gas from cooling into the central galaxies of dark matter halos and forming stars. At the low-mass end of the galaxy mass function, feedback driven by supernovae (SNe) is often referred to as an energy/momentum input for outflowing gas from galaxies (Dekel & Silk 1986; Springel & Hernquist 2003; Murray et al. 2005). Meanwhile, models with feedback from AGN possibly account for the presence of massive elliptical galaxies (e.g., Somerville et al. 2008).
Observationally, galactic-scale outflows have been widely found in local ultra luminous infrared galaxies (ULIRGs; e.g., Heckman et al. 1990; Martin 2005; Soto et al. 2012), in post-starburst galaxies at (e.g., Coil et al. 2011), in radio galaxies at (e.g., Nesvadba et al. 2008; Liu et al. 2013), in normal star-forming galaxies (e.g, Steidel et al. 2010; Martin et al. 2012; Kornei et al. 2012; Erb et al. 2012; Bradshaw et al. 2013), and in sub-millimeter galaxies at (e.g., Alexander et al. 2010). Outflowing gas is commonly traced via interstellar absorption lines blueshifted relative to stars and H ii regions. It is found that a certain critical SFR surface density ( yr-1 kpc-2) is necessary to drive an outflow (Murray et al. 2011; Kornei et al. 2012) and that outflows are stronger for more massive and/or higher-SFR galaxies (Weiner et al. 2009; Kornei et al. 2012; Martin et al. 2012).
In order to study galactic outflows in systematic surveys at high redshifts (), it is necessary to systematically select galaxies at targeted redshifts. The narrowband technique is one of the efficient methods used for this purpose, providing a systematic sample of galaxies with strong emission lines. The idea of this method is to use a narrowband filter to detect a specific nebular emission line redshifted into the narrow wavelength range of the filter. This method has provided vast numbers of star-forming galaxies ranging from low redshifts to redshifts as high as . At , star-forming galaxies with strong [O ii], [O iii], and H emission lines are selected as [O ii], [O iii], and H emitters, respectively (e.g., Bunker et al. 1995; Ly et al. 2012; Drake et al. 2013). Another important type of star-forming galaxy selected via this method is Lyman alpha emitters (LAEs), which show a strong Ly emission line. Thousands of LAEs have been selected at various redshifts over -7.0 (e.g., Cowie et al. 2010; Ouchi et al. 2008, 2010).
Some LAEs show very luminous and extended ( kpc) Ly emission. They are called Ly blobs (LABs; e.g., Matsuda et al. 2004) and are good candidates of galaxies with outflow at high redshifts. LABs are largely found at with Ly luminosities of erg s-1and spatial extents over 50 kpc (Matsuda et al. 2004; Yang et al. 2009). The most remarkable LABs known at present are Steidel et al.’s (2000) LAB1 and LAB2 in SSA22 with erg s-1 and sizes of kpc. The most distant LAB is the one discovered by Ouchi et al. (2009) at ; it shows of erg s-1 and physically extends more than kpc. Gas outflows by intense starbursts, black hole accretion (Mori et al. 2004; Taniguchi & Shioya 2000; Wilman et al. 2005), photoionization from massive stars, and/or AGNs (Matsuda et al. 2004; Geach et al. 2009) are plausible origins of LABs. However, we should note that inflows of cooling gas may also be able to produce LABs (Fardal et al. 2001; Smith & Jarvis 2007).
Recently, Brammer et al. (2013) reported an [O iii] blob at spatially extended over 1″ or 8.5 kpc. The rest-frame equivalent width (EW0) is Å for the blended H and [O iii] emission lines. This discovery was made by Hubble Space Telescope grism observations; therefore, they were able to resolve 1″ extent beyond the galaxy, which would not be possible from the ground. Unlike resonantly scattered hydrogen-line emission such as Ly emission that can be plausibly explained by both outflows and inflows, extended profiles of metal emission (i.e., oxygen-line emission) are more compatible with the outflow scenario rather than the inflow of pristine gas from the IGM whose metallicity is only (e.g., Aguirre et al. 2008; Fumagalli et al. 2011).
To date, outflows from objects with oxygen-line emission have been studied only after the objects are identified as AGNs. In this paper, we use the narrowband technique to conduct the first systematic search for galaxies with outflow features at including both AGN host and star-forming galaxies. We look for [O ii] emission instead of [O iii] emission, because we aim to study galaxies as distant as possible and [O ii] is the shortest-wavelength strong metal emission line. This systematic search enables us to provide a meaningful constraint on the frequency of outflow occurrence in star-forming galaxies at , a crucial epoch that the star formation activity of massive galaxies is being quenched.
This paper is organized as follows. Section 2 describes the data and the selection method used to identify [O ii] blobs (O iiBs). We also measure photometry and derive stellar properties of the selected O iiBs. Section 3 explains the photometric, stellar, and spectroscopic properties of a giant O iiB we discover. Section 4 presents the spectroscopic data of other O iiBs. Section 5 discusses the AGN activity, the signature of an outflow, and its possible origins for this giant blob. We also estimate the number density of O iiBs. Finally, we summarize all results in Section 6.
Throughout this paper, magnitudes are described in the AB system. We assume a standard CDM cosmology with parameters of .
2. O iiB Candidates at
2.1. Sample Selection
To search for O iiBs, we first select [O ii] emitters whose [O ii] emission falls into the narrowband filter NB816 with Å and FWHM Å. We use the catalog of [O ii] emitters at provided by Drake et al. (2013). Full details in the selection of [O ii] emitters are described in Drake et al. (2013); a brief description is as follows. An NB816 image was taken with Subaru/Suprime-Cam for an area of deg2 in the SubaruXMM Deep Survey (SXDS) field by Ouchi et al. (2008). Its limiting magnitude is 26.0 mag on a 20 diameter aperture. Deep broadband (, , , , and ) images were also obtained by Furusawa et al. (2008) whose limiting magnitudes on a 20 aperture are 27.39, 27.10, 26.85, 26.66, and 25.95 mag, respectively. To obtain good-quality photometric redshifts, they also use u-band data from Megacam on the Canada France Hawaii Telescope (CFHT), J,H,K data from DR8 version of the UKIDSS Ultra Deep Survey (UDS; Lawrence et al. 2007) taken with WFCAM on the UK Infrared Telescope (UKIRT), and Infrared Array Camera (IRAC) channels 1 (3.6µm) and 2 (4.5µm) from Spitzer UDS survey (SpUDS; PI: J. Dunlop). [O ii] emitters are selected in a 0.62 deg2 region (after masking) where the SXDS/UDS data overlap.
Object detection was made on the NB816 image. Then, for all objects above the limiting magnitude, 20 diameter aperture magnitudes are measured for the other bandpasses at exactly the same positions as in the NB816 image by using the dual mode of SExtractor (Bertin & Arnouts 1996). Emitter candidates are required to exhibit a significant excess in NB816 with respect to an offband defined by a combination of the and bands (Figure 2 in Drake et al. 2013). Possible interlopers (i.e., late-type, red stars) are removed from the emitter candidates by applying the and color diagram (Daddi et al. 2004) and criterion. To summarize, Drake et al. (2013) have 3597 NB816-excess objects classified as galaxies. 1013 of them are classified as [O ii] emitters at by using photometric redshifts, while the others are either H emitters at or [O iii] emitters at .
| NB816corraaIsophotal magnitude in NB816corr images. | f([O ii])bb[O ii] emission line flux. | L([O ii])cc[O ii] luminosity calculated by fixing redshifts at . | AreaddIsophotal area measured on the smoothed NB816corr image. | eeAverage surface brightness. | |
|---|---|---|---|---|---|
| ID | (mag) | (erg s-1 cm-2) | (erg s-1) | (arcsec-2) | (mag arcsec-2) |
| OIIB1 | 22.01 | 3.1(–16) | 2.5(+42) | 34 | 25.8 |
| OIIB2 | 23.31 | 9.3(–17) | 7.5(+41) | 26 | 26.9 |
| OIIB3 | 22.78 | 1.5(–16) | 1.2(+42) | 21 | 26.1 |
| OIIB4 | 23.03 | 1.2(–16) | 9.7(+41) | 19 | 26.2 |
| OIIB5 | 23.72 | 6.4(–17) | 5.1(+41) | 18 | 26.8 |
| OIIB6 | 23.18 | 1.1(–16) | 8.4(+41) | 17 | 26.3 |
| OIIB7 | 23.15 | 1.1(–16) | 8.7(+41) | 16 | 26.2 |
| OIIB8 | 24.23 | 4.0(–17) | 3.2(+41) | 16 | 27.2 |
| OIIB9 | 23.00 | 1.2(–16) | 1.0(+42) | 14 | 25.9 |
| OIIB10 | 22.89 | 1.4(–16) | 1.1(+42) | 14 | 25.8 |
| OIIB11 | 23.74 | 6.3(–17) | 5.0(+41) | 13 | 26.6 |
| OIIB12 | 23.97 | 5.1(–17) | 4.1(+41) | 13 | 26.8 |
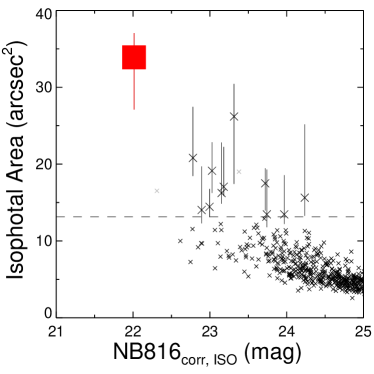
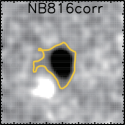
To select O iiBs, we adopt a similar methodology to what was used to search for LABs at by Matsuda et al. (2004). We search for O iiBs in the emission-line NB816corr image, which is obtained by subtracting a continuum-emission image from the NB816 image; the continuum-emission image is constructed from the and images at . Then objects are detected in the NB816corr smoothed with a Gaussian kernel with a FWHM of 10. We regard an object as being extended if it consists of continuous pixels above the background surface brightness fluctuation (28 mag arcsec-2 or erg s-1 cm-2 arcsec-2) of the original NB816corr image. Extended objects are then crossmatched with the catalog of [O ii] emitters described above. Figure 1 plots the isophotal area of extended [O ii] emitters as a function of NB816corr magnitude. Matsuda et al. define their LABs as objects with an isophotal area above 16 arcsec2, corresponding to a spatial extent of 30 kpc at . By adopting the same criterion for our extended [O ii] emitters, we find fourteen objects to satisfy a criterion of isophotal area above 13 arcsec2 (corresponding to a spatial extent of 30 kpc at ). We classify 12 of them as O iiBs after visual inspection. The remaining two objects are found to be blended with nearby objects in the smoothed NB816corr image, giving a falsely large isophotal area (the gray crosses in Figure 1). We estimate the uncertainties of isophotal area measurements by Monte-Carlo simulations. We cut out images of the O iiBs, and place them on empty sky regions of the NB816corr image to produce artificial O iiBimages. We measure their isophotal areas in the same manner as we performed for the real O iiBs, and define a error of isophotal area by the 68 percentile of the artificial object distribution. The estimated uncertainties are presented in Figure 1.
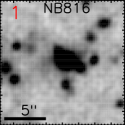
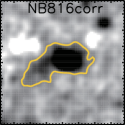
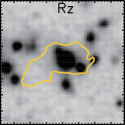
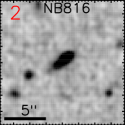
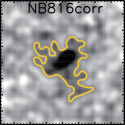
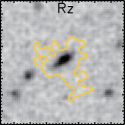
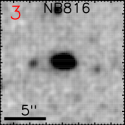
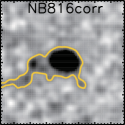
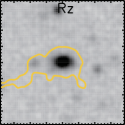
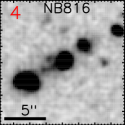
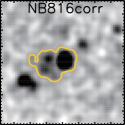
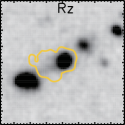
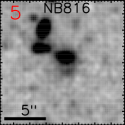
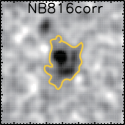
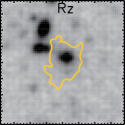
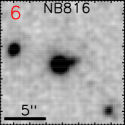
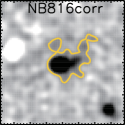
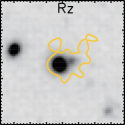
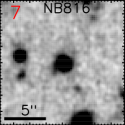
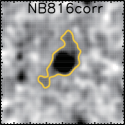
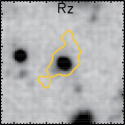
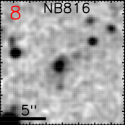
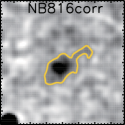
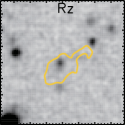
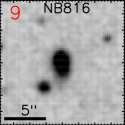
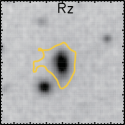
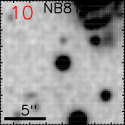
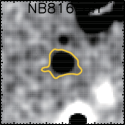
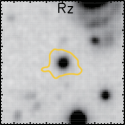
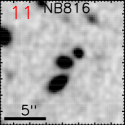
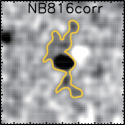
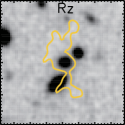
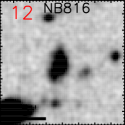
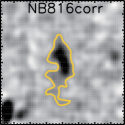
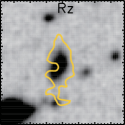
We summarize properties of our 12 O iiBs at in Table 1. O iiBs are called O iiB 1 to 12 in order of isophotal area. Figure 2 shows NB816, NB816corr, and Rz images of all 12 O iiBs. An isophote of -level surface brightness is overlaid on the Rz images, showing asymmetrically extended [O ii] emission with relatively compact continuum emission.
 |
 |
 |
 |
 |
 |
 |
 |
 |
 |
 |
 |
 |
 |
 |
 |
 |
 |
 |
 |
 |
 |
 |
 |
 |
 |
 |
 |
 |
 |
 |
 |
 |
 |
 |
 |
2.2. Photometry and Stellar Properties
We perform photometry of our O iiBs with the 11 images of uBVRizJHK and IRAC 3.6µm and 4.5µm bands. Total magnitudes in the Subaru broadbands, BVRiz, are obtained from MAG_AUTO by SExtractor. Similarly, we measure MAG_AUTO magnitudes for the u-band image from Megacam on the CFHT and JHK images from DR10 version of the UKIDSS UDS survey. For each image, we align the broadband images to the NB816 image and crossmatch the O iiB positions after visual reconfirmation. IRAC and MIPS 24µm imaging data were obtained from the SpUDS survey. For the IRAC images, total magnitudes are determined from aperture photometry on a 24 diameter aperture by applying aperture correction. The correction factor is calculated by generating artificial objects with given total magnitudes and recovering their aperture photometry.
We then derive the stellar properties, fitting model spectral energy distributions (SEDs) with the SEDs of 11-band photometry. The model SEDs are produced with the Bruzual & Charlot (2003) stellar population synthesis code. We assume a constant star formation history, the Salpeter (1955) initial mass function with standard lower and upper mass cutoffs of and , respectively, dust attenuation law of Calzetti et al. (2000), and the solar metallicity. We fix the redshift to , assuming that the [O ii] emission line falls in the center of NB816 filter. We set a maximum stellar age of the O iiBs to Gyr, the cosmic age at .
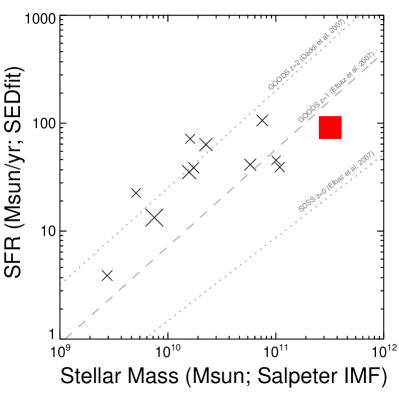
We examine the star-forming nature of the O iiBs with a correlation between their stellar masses and SFRs derived from the SED fitting. It is known that star-forming galaxies at –2 have a tight stellar massSFR correlation referred to as a star formation main sequence ( dex scatter). The main sequence has a similar slope at any redshifts known to date, but the normalization of the main sequence decreases from to , which is related to the overall decline of cosmic SFR density (e.g., Daddi et al. 2007; Elbaz et al. 2007). Passive galaxies with high stellar masses are located far below the main sequence and they are regarded as progenitors of elliptical galaxies in the local universe. Figure 3 shows the stellar mass-SFR relation for all O iiBs at . In the low mass regime, the O iiBs show a positive correlation between stellar mass and SFR. The distribution of O iiBs does not follow the main sequence, but presents a plateau at the high-mass end of . The O iiBs fall below the main sequence at . Albeit with the small statistics, it would imply that low-mass O iiBs are actively star forming, while high-mass O iiBs quench their star formation. In Figure 3, O iiB 1 is the most massive blob and its SFR is below the main sequence, implying that it is quenching star-forming activity. Similarly, two other O iiBs, blobs 9 and 12 below the sequence, are probably quenching their star formation.
3. O iiB 1 at
Among 12 O iiBs at , [O ii]B1 (, ) is the brightest emitter and shows the most extended profile in the NB816corr image (red square in Figure 1) with an isophotal area of arcsec2. The rest-frame equivalent width and [O ii] luminosity of O iiB 1 are estimated from the NB816 and Rz images to be Å and erg s-1, respectively. This luminosity is significantly brighter than the typical [O ii] emitters found in the literature (e.g., Ly et al. 2012; Drake et al. 2013).
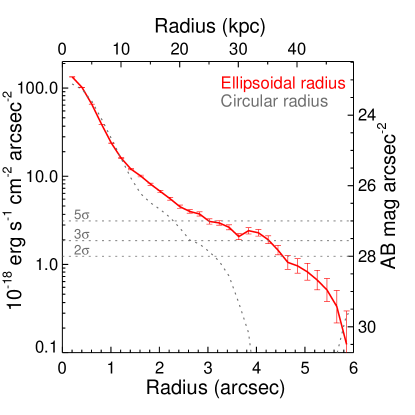
Being extended over 9″ or kpc along the major axis, O iiB 1 is remarkably larger than the [O iii] blob at reported by Brammer et al. (2013). However, a direct comparison is difficult due to the different sensitivity limits. Figure 4 presents the azimuthally averaged [O ii] emission surface brightness profiles of O iiB 1 measured with the NB816corr image. The red line in Figure 4 is the surface brightness of ellipsoidal isophote along the elongated direction, i.e. east-west direction, that is illustrated with the yellow isophote in Figure 2. The profile of ellipsoidal isophotes is extended to the radius of , 41, and 43 along the semi-major axis at the , , and surface brightness levels, respectively. This indicates that [O ii] emission of O iiB 1 is remarkably extended even at the surface brightness limit. For comparison, we show the surface brightness of circular isophotes with the gray dotted line in Figure 4. This surface brightness profile of circular isophote is truncated at the relatively small angular distance, because O iiB 1 is highly elongated.
3.1. Photometric Properties
The photometry of O iiB 1 in the 11 bands ( and IRAC 3.6µm and 4.5µm) is determined and given in Section 2.2. In addition to the 11-band photometry, we use the MIPS 24 µm flux of O iiB 1, Jy, that is carefully measured by Simpson et al. (2012). The X-ray photometry of O iiB 1 is obtained from the XMM-Newton catalog by Ueda et al. (2008). The flux in 0.3–0.5 keV is calculated by assuming the photon index of 1.5, while the index of 2.0 is assumed for 0.5–2.0 keV and 2–10 keV (Ueda et al. 2008). Finally, we take the radio 1.4-GHz flux from Simpson et al. (2012). The radio observation was carried out with the Very Large Array (VLA) of the National Radio Astronomy Observatory (Simpson et al. 2006), and the 1.4 GHz radio flux is . All of the measurements are listed in Table 2.
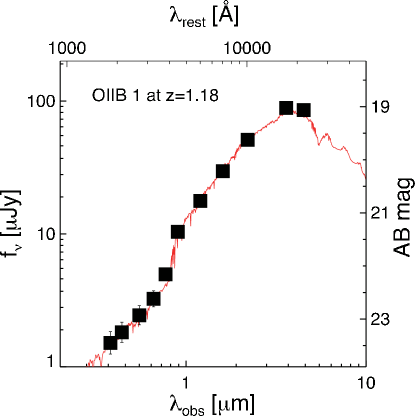
Stellar properties of O iiB 1 are obtained in the same manner as those of the other O iiBs in Section 2.2, but with the spectroscopic redshift of (see Section 3.2.2). The best-fit SED of O iiB 1 has a very old stellar age, 4.7 Gyr, comparable with the cosmic age at . The stellar mass is . The SFR is 90 yr-1 and the color excess E(B–V) is 0.3 mag. Figure 5 presents the SED and the best-fit model of O iiB 1.
| Band | Total Magnitude/Flux |
|---|---|
| f(0.3–0.5 keV)aaThe X-ray fluxes are taken from Ueda et al. (2008) in units of erg s-1 cm-2. | |
| f(0.5–2.0 keV; soft)aaThe X-ray fluxes are taken from Ueda et al. (2008) in units of erg s-1 cm-2. | |
| f(2–10 keV; hard)aaThe X-ray fluxes are taken from Ueda et al. (2008) in units of erg s-1 cm-2. | |
| u | |
| B | |
| V | |
| R | |
| NB816 | |
| i | |
| z | |
| J | |
| H | |
| K | |
| m(3.6µm) | |
| m(4.5µm) | |
| f(24µm) | Jy |
| f(1.4GHz) | Jy |
3.2. Spectroscopic Properties
3.2.1 Observations
The spectroscopic observation of O iiB 1 was carried out with the Visible Multi-Object Spectrograph (VIMOS) on the Very Large Telescope (VLT) as part of the European Southern Observatory (ESO) program P074.A-033 (Simpson et al. 2012). The observation was conducted in service mode using the MR-orange grating and the GG475 order-sorting filter, providing a spectral resolution of (1″ slit) and a spectral dispersion of 2.5 Å pixel-1 over the wavelength range of 4800–10000 Å. The slit is located at the center of the blob in the north-south direction as a default of VIMOS. The total exposure time was 5400 s. Data reduction is performed using the standard pipeline and described in detail in Simpson et al. (2012). The wavelength calibration has a root-mean-square (rms) uncertainty of 0.4 pixels or 1.0 Å. The estimated limiting flux for detecting an emission line is erg s-1 cm-2 over Å spectral range.
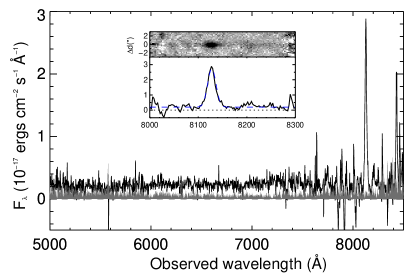
3.2.2 Emission-line Identification
Figure 6 shows the overall VIMOS spectrum of O iiB 1 extracted through a 1″aperture with an enhanced spectrum at the wavelength around a remarkably strong emission line in the inset figure. A two-dimensional spectrum around the line is also shown in the top panel of the inset figure, where the south end of the slit is up. The central wavelength of this single line is Å. We investigate whether this line is Ly, [O ii], [O iii], or H emission. We exclude the possibility of H emission at , as the spectrum shows no detection of [O iii] emission at Å and [O ii] emission at Å. It is not [O iii] at , either, because of no detection of [O iii] emission at Å and [O ii] emission at Å. Furthermore, clear detection of continuum emission blueward of this line indicates that this object is not a Ly emitter at . Additionally, the derived photometric redshift is quite strongly peaked around (Drake et al. 2013). We thus conclude that this line is [O ii] emission at .
Because the VIMOS spectral resolution is only , the [O ii] doublet is not resolved. We thus simply fit the [O ii] emission line with a single symmetric Gaussian profile by using the IDL MPFITEXPR routine, which is part of the IDL MPFIT package (Markwardt 2009)111http://www.physics.wisc.edu/ craigm/idl/. We measure the line flux of O iiB 1 to be erg s-1 cm-2, corresponding to an [O ii] luminosity of erg s-1. We summarize spectroscopic properties of O iiB 1 in Table 3.
| Quantity | Value |
|---|---|
| Redshift () | aaThe spectroscopic redshift is obtained from cross-correlation between the target spectrum and a template spectrum as described in Simpson et al. (2012). |
| Isophotal areabbThe isophotal area is determined above arcsec-2 (28 mag arcsec-2) in the NB816corr. in NB816corr | 34 arcsec2 |
| Major axisccMajor axis is determined in the smoothed NB816corr image by using the isophotal area shown in the SEGMENTATION image obtained from SExtractor. in NB816corr | 9″or 75 kpc |
| Half-light radiusddHalf-light radius is a radius containing 50% of the total light from the object obtained by SExtractor. in NB816corr | 10 or 8.3 kpc |
| f([O ii])eeThe VIMOS spectrum was obtained using 1″ slit, which apparently do not cover the entire blob. (VIMOS) | erg s-1 cm-2 |
| L([O ii])eeThe VIMOS spectrum was obtained using 1″ slit, which apparently do not cover the entire blob. (VIMOS) | erg s-1 |
| f([O ii]) (NB816 and Rz images) | erg s-1 cm-2 |
| L([O ii]) (NB816 and Rz images) | erg s-1 |
| ffThe rest-frame -band magnitude is calculated from the -band photometry covering the rest-frame 3900–4500 Å. It is close to bandpass of the band; therefore, we do not apply -correction to the magnitude. | mag |
| [O ii] EW0ggThe rest-frame [O ii] equivalent width (EW0) is calculated from the VIMOS spectrum covering 1″ at the center of the O iiB. (VIMOS) | Å |
| [O ii] EW0 (from NB816 and Rz) | Å |
| Stellar mass | |
| Stellar age | Gyr |
| Color excess (E(B-V)) | 0.3 mag |
| SFR from UVhhThe SFRs are derived, respectively, from the UV continuum and [O ii] luminosity by applying the relation from Kennicutt (1998) without any dust extinction. | yr-1 |
| SFR from SED fit | yr-1 |
| SFR from [O ii]hhThe SFRs are derived, respectively, from the UV continuum and [O ii] luminosity by applying the relation from Kennicutt (1998) without any dust extinction. | yr-1 |
| Number density | Mpc-3 |
| OIIB1 fraction | 0.1% |
3.2.3 Spectral Properties of Other Lines
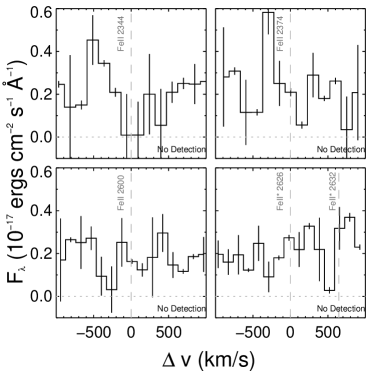
We also try to detect other emission or absorption lines falling into the wavelength range of the VIMOS spectrum: Fe ii , Fe ii∗ , Mg ii , and [Ne v] . We fit all lines with a single Gaussian profile using the MPFIT package to determine the central wavelength, FWHM, and flux. Lines with no detection are shown in Figure 7, while those with a tentative signature are shown separately in Figure 8. Each line is plotted as a function of velocity offset with respect to the systemic velocity calculated from the [O ii] emission line.
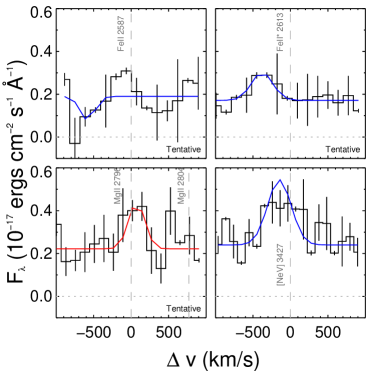
The top left panel of Figure 8 shows a very tentative Fe ii absorption line with only at Å, corresponding to a line redshift of . Likewise, we find marginal detection of the fine-structure Fe ii∗ emission line at the significant level at 5690.6 Å or (top right panel of Figure 8). The bottom left panel shows marginal detection of Mg ii emission line at Å, whose redshift, , is very close to the systemic redshifted derived from the [O ii] emission line. The last line, [Ne v], is detected with a high significance level of at Å, or . Its flux is derived to be erg s-1 cm-2. The properties of these absorption and emission lines are summarized in Table 4.
4. O iiBs 4 and 8
4.1. Spectroscopic Data
In addition to the VIMOS spectrum of O iiB 1, we also have spectroscopic data for another two blobs, O iiBs 4 and 8. The observations were carried out with the Faint Object Camera and Spectrograph (FOCAS) mounted on the Subaru Telescope. The spectrum of O iiB 4 was obtained with the 150 grism and an SY47 order-cut filter providing a spectral resolution of (08 slit) over 4700–9400 Å. The total exposure time was 3600 s. The spectrum of O iiB 8 was taken with the 300 blue grism and the SY47 order-cut filter with a spectral resolution of 500 (08 slit). The total exposure time was 7200 s. Data reduction is performed with IRAF following the standard method for the optical multi-slit spectroscopy. The estimated limiting flux density are erg s-1 cm-2 Å-1 and erg s-1 cm-2 Å-1 over Å spectral range for spectra of O iiBs 4 and 8, respectively.
4.2. Spectroscopic Properties
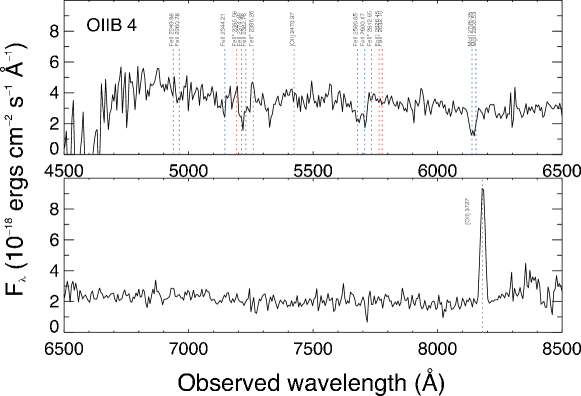
Figure 9 shows the FOCAS spectrum of O iiB 4 in the observed frame. There is a single emission line at 8181.6 Å. Here, we examine if this line is Ly, [O ii], [O iii], or H emission. It is not H emission at because of no detection of [O iii] line at 6242 Å and [O ii] line at 4646 Å. We also rule out the possibility that this is an [O iii] line at , because we find no [O iii] line at 8103 Å and no [O ii] line at 6090 Å. Likewise, the line is not Ly emission at as we certainly detect the continuum blueward of the line. We thus conclude that the single emission at 8181.6 Å is an [O ii] line emitted at . We fit the [O ii] emission line with a Gaussian profile by MPFIT. The best-fit line flux is erg s-1 cm-2, corresponding to the [O ii] luminosity of erg s-1. The spectrum of O iiB 4 shows a possible Mg ii doublet absorption in the FOCAS spectrum (Figure 9). The absorption is blueshifted from the systemic redshift determined from the [O ii] emission line with an average velocity offset of km s-1.
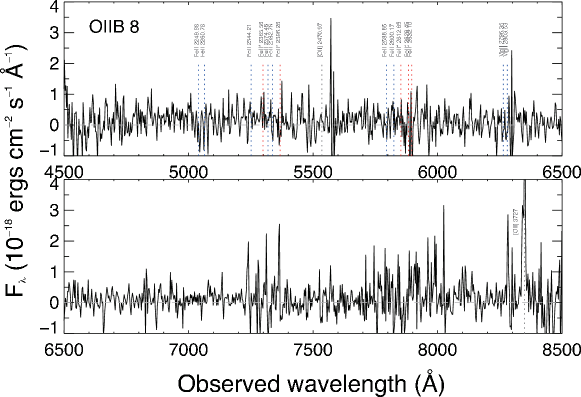
The spectrum of O iiB 8 is presented in Figure 10. This spectrum is so noisy that we detect no continuum, but one emission line at 8346.9 Å. We rule out the possibility that this is [O iii] emission of a source at , because we detect neither [O iii] line at 8267 Å nor [O ii] at 6213 Å. Similarly, this line is not H emission at , because of no detection of [O iii] at 6370 Å and [O ii] at 4733 Å. The line is not the Ly emission at , due to the clear () detections of continuum blueward of the line in the uBVR images. Using the spectrum, we confirm that the single line of O iiB 8 at 8346.9 Å is the [O ii] emission at . We estimate the [O ii] emission line flux and luminosity to be erg s-1 cm-2and erg s-1, respectively, by our Gaussian profile fitting.
| Line | (Å) | (Å)aaAn error on the observed wavelengths is a standard deviation obtained from fitting a line with a single Gaussian profile. | FluxaaAn error on the observed wavelengths is a standard deviation obtained from fitting a line with a single Gaussian profile. | ||
|---|---|---|---|---|---|
| (1) | (2) | (3) | (4) | (5) | |
| Fe iibbThese lines are just marginally detected. Discussion using these lines should be done with caution. | 2587 | Absorption? | |||
| Fe ii∗bbThese lines are just marginally detected. Discussion using these lines should be done with caution. | 2613 | Emission? | |||
| Mg iibbThese lines are just marginally detected. Discussion using these lines should be done with caution. | 2796 | Emission? | |||
| [Ne v] | 3427 | ||||
| [O ii] | 3727 |
Note. — (1)–(2) Line names and their rest-frame wavelengths. (3) Observed wavelengths of the lines obtained from best-fitting Gaussian profiles by MPFIT. (4) Redshifts. (5) Observed fluxes in the units of erg s-1 cm-2.
5. Discussion
5.1. AGN Activity
In this section, we examine the AGN activity of O iiB 1 from several aspects. As the first step, we classify O iiB 1 as an AGN due to the presence of [Ne v] emission. We have detected [Ne v] emission line with a flux of erg s-1 cm-2, while star-forming regions cannot provide enough energy to produce high-ionization lines such as [Ne v].
The nucleus of O iiB 1 is found to be an obscured type-2 AGN. The prominent 4000 Å break seen in the observed SED (Figure 5) indicates that we are not seeing the AGN continuum directly and that stellar components dominate the observed SED. Moreover, as listed in Table 3, the measured equivalent width of O iiB 1 is Å for the entire blob. It is much higher than the mean equivalent widths of typical quasars, which is Å (Miller et al. 1992) or more precisely Å for radio-loud quasars and Å for radio-quiet samples at (Kalfountzou et al. 2012). Although quasar samples in Kalfountzou et al. (2012) show a very broad [O ii]equivalent width distribution ranging from EW([O ii]) Å to EW([O ii]) Å, only a few of their quasars () show an EW([O ii]) as large as Å. The EW([O ii]) of O iiB 1 is far above those of the majority of quasars.
O iiB 1 can be further classified as a radio-quiet galaxy, because of a high mid-infrared to radio flux ratio, . We obtain after -correcting the 24 µm and 1.4 GHz radio fluxes (Simpson et al. 2012). This value is above the threshold used to separate radio-loud galaxies (Ibar et al. 2008). Recently, Liu et al. (2013) study extended ionized gas nebulae around 11 radio-quiet type-2 quasars at using [O iii] emission. Observing with an integral field spectrograph, Gemini/GMOS-N IFS, they have found that the [O iii] emission of radio-quiet objects is extended and nearly perfectly round rather than clumpy or elongated profiles seen in radio-loud galaxies (Nesvadba et al. 2008). O iiB 1, however, shows an asymmetric morphology as seen in Figure 2, unlike radio-quiet quasars at . The half-light radius of O iiB 1 calculated by SExtractor is kpc. It is notably larger than the [O iii] effective radii of radio-quiet samples in Liu et al., which range from 2.5 to 5.2 kpc with a median value of 3.2 kpc. However, it is noteworthy that the oxygen-line profile studied in this paper is the [O ii] emission, while it is [O iii] emission in Liu et al. (2013). A comparison of their profiles is not straightforward. According to the rest-frame optical spectra of radio-quiet quasars in Liu et al. (2013, their Figure 5), the [O ii] emission line is significantly weaker than the [O iii], indicating high [O iii]/[O ii] line ratios. If O iiB 1 has the same line ratio, its [O iii] emission would be very strong, being more luminous than the extended [O ii] emission. This implies that, similar to the [O ii] emission, [O iii] of our O iiB is possibly more extended than those of the radio-quiet quasars at .
5.2. Outflow Signature
As mentioned in Section 1, spatially extended profiles of metal emission lines such as [O ii] are likely to originate from outflow rather than inflow of pristine gas from metal-poor IGM. In this section, we examine whether or not O iiB 1 has outflows and discuss possible origins of the outflows. If interstellar absorption lines are blueshifted against the systemic redshift, it is strong evidence of outflows. Na i D doublet is one of the most popular absorption lines used to determine the outflow velocity of galaxies at low redshifts (e.g., Martin 2005; Rupke et al. 2005a, b). At higher redshifts (), low-ionization interstellar metal lines in the rest-frame UV wavelengths such as Fe ii Mg ii, or [S ii] lines have been used instead (e.g., Shapley et al. 2003; Martin et al. 2012; Kornei et al. 2012), as Na i lines are redshifted into near-infrared wavelengths and become difficult to be observed. The Fe ii∗ emission is a fine structure transition that is connected to the Fe ii resonance lines. Normally, Fe+ ions in the front side of the outflow produce blueshifted absorption and those in the far side generate redshifted emission with respect to the systemic velocity, thus producing a P-Cygni profile. However, excited Fe+ ions can produce fine-structure transitions causing the Fe ii∗ emission both blueward and redward of the systemic velocity (Prochaska et al. 2011; Rubin et al. 2011). Detecting these fine-structure Fe ii∗ emission lines can be another piece of evidence for outflows.
We have marginally detected both Fe ii absorption line and Fe ii∗ emission line with each. The Fe ii absorption line tentatively shows a rest-frame equivalent width (EW0) and a central velocity offset of Å and km s-1, respectively. The Fe ii∗ emission line is blueshifted at km s-1 from the systemic velocity. It is roughly consistent with the velocity offset of the Fe ii absorption line ( km s-1) within the uncertainties. Although the detection of Fe ii and Fe ii∗ lines is only marginal at each, the existence of both lines together in our spectrum tentatively supports the outflow scenario of O iiB 1.
5.3. Possible Origins of Spatially Extended Emission and Outflows
We find one remarkably extended O iiB, O iiB 1, at and its outflow process seems to be supported by the contingent detection of blueshifted Fe ii absorption and Fe ii∗ emission lines. Several scenarios are plausible to explain the outflow process of galaxies including star formation activity, photoionization by star-formation/AGN, AGN-driven wind, and/or shock excitation.
We constrain the origin of the marginal Fe ii∗ emission of O iiB 1 by following the description by Erb et al. (2012). They use CLOUDY code version 08.00 (Ferland et al. 1998) to construct the photoionization models by adopting the Starburst99 ionization spectrum (Leitherer et al. 1999). Constant star formation and a metallicity of are assumed. While Erb et al. (2012) calculate an electron density of 100 cm-3 from an observed ratio of [O ii][O ii], the [O ii] doublet of O iiB 1 is not resolved. Different values of the electron density lead to difference values in the ionization parameter (the ratio of ionizing photon density to the hydrogen density) in the sense that a higher density lowers the ionization parameter. The models show that the ratio of [O ii] to Fe ii∗ lines decrease with increasing (Figure 15 in Erb et al. 2012). In our case, the [O ii]/Fe ii∗ ratio is tentatively . The low [O ii]/Fe ii∗ ratio of O iiB 1 would imply a very high ionization parameter (). Although we have not corrected the line ratio for dust extinction, the implied ionization parameter would be even higher when taking the dust effect into account, as we expect to see more of a decrease in Fe ii∗ lines relative to the [O ii] line in the presence of dust. Lilly et al. (2003) have found the ionization parameter of galaxies at to be , which is remarkably lower than the ratio derived in this paper. It is thus unlikely that the Fe ii∗ emission originates from photoionization in H ii regions of O iiB 1. However, as the detection of Fe ii∗ emission is indeed marginal, the derived [O ii]/Fe ii∗ ratio is probably just a lower limit and the corresponding ionization parameter is subsequently lower than discussed here.
The outflow velocity is an important quantity for determining whether outflow is driven by SNe or AGN. Heckman et al. (2000) study outflows in 32 luminous infrared galaxies at including galaxies whose luminosities are powered by starburst as well as some powered by AGNs. They have found outflow velocities up to 400–600 km s-1. More recently, Rupke et al. (2005a) and Rupke & Veilleux (2013) study outflows from ULIRGs at various redshifts and conclude that the central outflow velocities of SNe-driven wind are on average km s-1, while those of AGN-powered galaxies are – km s-1. As described in the previous section, the central velocity offsets of Fe ii absorption line and Fe ii∗ emission line for O iiB 1 are km s-1 and km s-1, respectively. These central outflow velocities are generally comparable to those of AGN-powered galaxies. Thus O iiB 1 seems to favor the AGN-driven wind scenario that is thought to be one of the major effects of AGN feedback.
Shock excitation is another possible source powering large-scale outflow. Radiative shock can be formed at the interface of the fast-moving wind and a slow-moving ISM (Veilleux et al. 2005). Many studies found strong evidence of shock excitation dominating the emission (Veilleux & Rupke 2002; Veilleux et al. 2003; Lípari et al. 2004; Monreal-Ibero et al. 2010; Sharp & Bland-Hawthorn 2010; Rich et al. 2011). Shock can be distinguished from the others by examining various line ratios (e.g., [N ii]/H or [S ii]/H), which are not available in this study. Further spectroscopic observations especially with an integral field unit spectrograph covering those lines are necessary to determine whether the outflow of O iiB 1 is powered by shock heating.
5.4. Can Gas Escape Out of the O iiB 1?
We calculate the escape velocity inferred from the virial theorem using the simple equation of , where is the halo mass and is the radius of the galaxy. The halo mass of O iiB 1 is obtained from the derived stellar mass in Section 3.1 by applying the relationship between the stellar and halo masses given by Leauthaud et al. (2012). For the stellar mass of , the halo mass ranges . We define the radius of O iiB 1 of kpc as twice the Petrosian radius measured in the Rz continuum image. The Petrosian radius is first introduced by Petrosian (1976) as the radius at which the surface brightness is times the average surface brightness within this isophote. It is found that the magnitude within twice the Petrosian radius with is approximately equal to the total magnitude for objects with exponential and Gaussian profiles and is of the total magnitude in the case of objects with profiles (Bershady et al. 2000).
The estimated escape velocity is km s-1. This is larger than the velocity of the Fe ii absorption and Fe ii∗ emission lines ( km s-1). If the detection of Fe ii and Fe ii∗ lines is real, it indicates that the majority of gas cannot escape out of the gravitational potential well of O iiB 1 and cannot chemically enrich the IGM.
5.5. How Rare are the O iiBs?
Drake et al. (2013) calculate the comoving volume of their [O ii] emitter survey, corresponding to the FWHM of NB816 times the survey area, to be Mpc3. The number density of giant O iiBs like O iiB 1 is thus Mpc-3, whereas it is Mpc-3 for all O iiBs (including O iiB 1) selected by the same criterion as in Matsuda et al. (2004). The fraction of [O ii] emitters from Drake et al. that are blobs is 0.1% and 1.2% for giant O iiB and small blobs, respectively.
Faber et al. (2007) study the evolution of the galaxy luminosity function up to and propose a mixed scenario of star formation quenching, moving star-forming galaxies to the red sequence where they further merge with other small galaxies. They define blue and red galaxies according to the location on the versus diagram and find the mean density of blue galaxies at to be Mpc-3 down to mag in DEEP2 survey (Davis et al. 2003). To compare with this result, we estimate the rest-frame color from the observed color. The relationship between the and colors is determined using models with constant star formation history from Bruzual & Charlot (2003). All but one O iiBs at is located in the blue cloud region of the color-magnitude diagram. Down to the same UV limit, we calculate the number density of O iiBs at to be Mpc-3. It implies that of blue galaxies at are quenching star formation by the same process as for our O iiBs.
As O iiB 1 at is classified as an obscured type-2 AGN (Section 5.1), it is important to compare the estimated number density with those of AGNs at similar redshifts. The number density of AGNs at with hard X-ray luminosities of erg s-1 is Mpc-3 (Barger et al. 2005; Barger & Cowie 2005). An overall fraction of AGNs displaying outflows is approximately 60% (e.g., Ganguly & Brotherton 2008), albeit some variety depending on AGN properties. Consequently, the number density of AGNs with outflows at is roughly Mpc-3, which is in good agreement with the number density of giant blobs like O iiB 1. It is likely that the outflows from O iiB 1 can be explained solely by AGN. However, the number density of all 12 O iiBs is larger than those of AGNs with outflows, implying that not all O iiBs are powered by AGNs. Additional observations are desirable to understand the nature of the entire population of O iiBs.
Since there is no systematic study of O iiBs up to date, it is difficult to state whether O iiB 1 is a rare object or not. As a baseline of discussion, we compare the above number density to those corresponding to extended LABs at various redshifts. Studies of LABs at (Yang et al. 2009) and at (Matsuda et al. 2004; Saito et al. 2006) have determined their number densities of Mpc-3, Mpc-3, and Mpc-3, respectively. At higher redshift, Ouchi et al. (2009) discovered an extended Ly emitter at and calculate the number density of LAB to be Mpc-3. The number density of O iiB 1-type objects is at least an order of magnitude smaller than those of LABs at by Matsuda et al. (2004) and Saito et al. (2006), but comparable to the number densities of LABs at by Yang et al. (2009) and at by Ouchi et al. (2009). On the other hand, the number density of LABs at is comparable to our study if it is compared with the number density of the entire O iiB samples. Given that LAB surveys have shown that constraining the number density of the extended sources is challenging because of the intrinsic clustering or the selection criteria, we stress that the larger survey for O iiBs is required to further constrain their clustering and number density.
5.6. Diffuse [O ii] Halos
Steidel et al. (2011) and Matsuda et al. (2012) have identified the diffuse, extended Ly emission down to a very faint surface brightness limit in the composite images of UV-selected galaxies and/or LAEs at . The diffuse Ly emission is thought to be a generic property of star-forming galaxies at high redshifts. Steidel et al. (2011) argue that Ly emission of diffuse halos are produced by the resonance scattering of neutral H i gas in the circumgalactic medium (CGM).
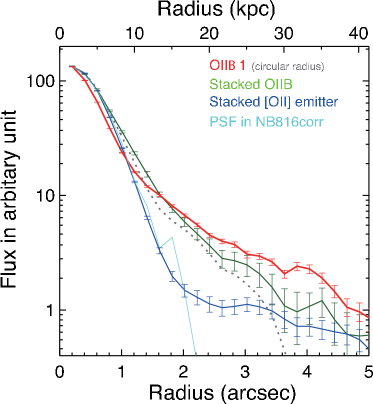
In this section, we investigate whether extended [O ii] emission is universally found in any [O ii] emitters, using [O ii] emission image (NB816corr) composites. Figure 11 presents the stacked [O ii] profiles for all O iiBs (the green line) and [O ii] emitters (the blue line). We compare these surface brightness profiles with the one of O iiB 1. Similar to O iiB 1, the stacked image of the O iiBs shows an extended component at the radius larger than 1″over the PSF. On the other hand, the stacked profile of the all [O ii] emitters of Drake et al. (2013) is similar to that of point sources (stars). We conclude that the extended nature of [O ii] emission is not a common feature of star-forming galaxies. Unlike Ly emission, [O ii] emission is not resonantly scattered by H i gas in the CGM. Thus, the [O ii] halos can probably be found only in high- galaxies with strong outflows.
6. Summary
We present the first systematic search for galaxies with spatially extended metal-line [O ii] emission at , which we call “O iiBs”. We have discovered a giant blob with a spectroscopic redshift of , O iiB 1. We have also discovered 12 small O iiBs. The O iiB 1 extends over 75 kpc above 28 mag arcsec-2 along its major axis. The rest-frame equivalent width (EW0) of the entire blob calculated from the NB816 and Rz images is Å and the [O ii] luminosity is erg s-1. The major results of our study are summarized as follows.
-
1.
A strong emission line has been detected at Å in the VIMOS spectrum. We conclude that it is the [O ii] emission at , because we do not find other strong emission lines at the bluer wavelengths which are expected if the line is H at or [O iii] at , because we detect continuum emission blueward of the line which is not expected if the line is Ly at , and because the probability distribution of its photometric redshifts is peaked around .
-
2.
We classify O iiB 1 as a radio-quiet obscured type-2 AGN according to the following properties. (1) Mg ii and [Ne v] emission lines are marginally detected in the VIMOS spectrum. (2) [O ii] line width of km s-1 is larger than those observed for normal star-forming galaxies but smaller than those for typical broad-line AGNs. (3) A much higher [O ii] equivalent width than typical AGNs and a prominent 4000 Å break indicate that the AGN continuum is largely obscured. (4) The ratio of mid-infrared to radio fluxes () is consistent with those for radio-quiet galaxies.
-
3.
The outflow signature of O iiB 1 is supported by the marginal existence of both Fe ii absorption and Fe ii∗ emission lines. Despite marginal detections, both lines show the consistent velocity offsets from the systemic velocity ( km s-1 and km s-1 for Fe ii and Fe ii∗ lines, respectively).
-
4.
Investigating the physical origins of the spatially extended [O ii] emission and outflow, we have found that O iiB 1 appears to favor the AGN-driven outflow scenario, though shock excitation and photoionization by AGN cannot be ruled out. Photoionization by star formation is unlikely, because the ionization parameter inferred from the [O ii]/Fe ii∗ ratio of is higher than the average values found in star-forming galaxies at similar redshifts. The AGN-driven wind is, in contrast, supported by the central outflow velocities derived from the Fe ii absorption and Fe ii∗ emission lines, which are larger than those found in normal galaxies without an AGN, though the detection is tentative.
-
5.
At , the number density of giant O iiBs like O iiB 1 is Mpc-3, while it is Mpc-3 for the entire O iiB sample. We estimate that approximately 3% of blue galaxies at may be experiencing star formation quenching process similar to the O iiBs. Comparing the number densities of the O iiBs with those of AGNs with outflow features at similar redshifts, we find that O iiB 1 seems to be explained by AGN, but it is unlikely for the other O iiBs.
We thank the anonymous referee for careful reading and valuable comments that improved clarity of the paper. We are also grateful to Masao Hayashi, Shota Kisaka, Tomoki Saito, and Wiphu Rujopakarn for their useful comments and discussions. This work was supported by KAKENHI (23244025) Grant-in-Aid for Scientific Research (A) through Japan Society for the Promotion of Science (JSPS). S.Y. acknowledges support from the JSPS through JSPS postdoctoral fellowship for foreign researchers. C.S. and A.B.D. acknowledge support from the UK Science and Technology Facilities Council.
References
- Aguirre et al. (2008) Aguirre, A., Dow-Hygelund, C., Schaye, J., & Theuns, T. 2008, ApJ, 689, 851
- Alexander et al. (2010) Alexander, D. M., Swinbank, A. M., Smail, I., McDermid, R., & Nesvadba, N. P. H. 2010, MNRAS, 402, 2211
- Barger & Cowie (2005) Barger, A. J. & Cowie, L. L. 2005, ApJ, 635, 115
- Barger et al. (2005) Barger, A. J., Cowie, L. L., Mushotzky, R. F., et al. 2005, AJ, 129, 578
- Barnes & Hernquist (1992) Barnes, J. E. & Hernquist, L. 1992, ARA&A, 30, 705
- Bershady et al. (2000) Bershady, M. A., Jangren, A., & Conselice, C. J. 2000, AJ, 119, 2645
- Bertin & Arnouts (1996) Bertin, E. & Arnouts, S. 1996, A&AS, 117, 393
- Bradshaw et al. (2013) Bradshaw, E. J., Almaini, O., Hartley, W. G., et al. 2013, MNRAS, 433, 194
- Brammer et al. (2013) Brammer, G. B., van Dokkum, P. G., Illingworth, G. D., et al. 2013, ApJ, 765, L2
- Bruzual & Charlot (2003) Bruzual, G. & Charlot, S. 2003, MNRAS, 344, 1000
- Bunker et al. (1995) Bunker, A. J., Warren, S. J., Hewett, P. C., & Clements, D. L. 1995, MNRAS, 273, 513
- Calzetti et al. (2000) Calzetti, D., Armus, L., Bohlin, R. C., et al. 2000, ApJ, 533, 682
- Coil et al. (2011) Coil, A. L., Weiner, B. J., Holz, D. E., et al. 2011, ApJ, 743, 46
- Cole et al. (2000) Cole, S., Lacey, C. G., Baugh, C. M., & Frenk, C. S. 2000, MNRAS, 319, 168
- Cowie et al. (2010) Cowie, L. L., Barger, A. J., & Hu, E. M. 2010, ApJ, 711, 928
- Daddi et al. (2004) Daddi, E., Cimatti, A., Renzini, A., et al. 2004, ApJ, 617, 746
- Daddi et al. (2007) Daddi, E., Dickinson, M., Morrison, G., et al. 2007, ApJ, 670, 156
- Davis et al. (2003) Davis, M., Faber, S. M., Newman, J., et al. 2003, Proc. SPIE, 4834, 161
- Dekel et al. (2009) Dekel, A., Sari, R., & Ceverino, D. 2009, ApJ, 703, 785
- Dekel & Silk (1986) Dekel, A. & Silk, J. 1986, ApJ, 303, 39
- Drake et al. (2013) Drake, A. B., Simpson, C., Collins, C. A., et al. 2013, MNRAS, 433, 796
- Elbaz et al. (2007) Elbaz, D., Daddi, E., Le Borgne, D., et al. 2007, A&A, 468, 33
- Erb et al. (2012) Erb, D. K., Quider, A. M., Henry, A. L., & Martin, C. L. 2012, ApJ, 759, 26
- Faber et al. (2007) Faber, S. M., Willmer, C. N. A., Wolf, C., et al. 2007, ApJ, 665, 265
- Fardal et al. (2001) Fardal, M. A., Katz, N., Gardner, J. P., et al. 2001, ApJ, 562, 605
- Ferland et al. (1998) Ferland, G. J., Korista, K. T., Verner, D. A., Ferguson, J. W., Kingdon, J. B., & Verner, E. M. 1998, PASP, 110, 761
- Fumagalli et al. (2011) Fumagalli, M., O’Meara, J. M., & Prochaska, J. X. 2011, Sci, 334, 1245
- Furusawa et al. (2008) Furusawa, H., Kosugi, G., Akiyama, M., et al. 2008, ApJS, 176, 1
- Ganguly & Brotherton (2008) Ganguly, R. & Brotherton, M. S. 2008, ApJ, 672, 102
- Geach et al. (2009) Geach, J. E., Alexander, D. M., Lehmer, B. D., et al. 2009, ApJ, 700, 1
- Heckman et al. (1990) Heckman, T. M., Armus, L., & Miley, G. K. 1990, ApJS, 74, 833
- Heckman et al. (2000) Heckman, T. M., Lehnert, M. D., Strickland, D. K., & Armus, L. 2000, ApJS, 129, 493
- Ibar et al. (2008) Ibar, E., Cirasuolo, M., Ivison, R., et al. 2008, MNRAS, 386, 953
- Kalfountzou et al. (2012) Kalfountzou, E., Jarvis, M. J., Bonfield, D. G., & Hardcastle, M. J. 2012, MNRAS, 427, 2401
- Kennicutt (1998) Kennicutt, R. C., J. 1998, ARA&A, 36, 189
- Kereš et al. (2009) Kereš, D., Katz, N., Davé, R., Fardal, M., & Weinberg, D. H. 2009, MNRAS, 396, 2332
- Kornei et al. (2012) Kornei, K. A., Shapley, A. E., Martin, C. L., et al. 2012, ApJ, 758, 135
- Lawrence et al. (2007) Lawrence, A., Warren, S. J., Almaini, O., et al. 2007, MNRAS, 379, 1599
- Leauthaud et al. (2012) Leauthaud, A., Tinker, J., Bundy, K., et al. 2012, ApJ, 744, 159
- Leitherer et al. (1999) Leitherer, C., Schaerer, D., Goldader, J. D., et al. 1999, ApJS, 123, 3
- Lilly et al. (2003) Lilly, S. J., Carollo, C. M., & Stockton, A. N. 2003, ApJ, 597, 730
- Lípari et al. (2004) Lípari, S., Mediavilla, E., Garcia-Lorenzo, B., et al. 2004, MNRAS, 355, 641
- Liu et al. (2013) Liu, G., Zakamska, N. L., Greene, J. E., Nesvadba, N. P. H., & Liu, X. 2013, MNRAS, 430, 2327
- Ly et al. (2012) Ly, C., Malkan, M. A., Kashikawa, N., et al. 2012, ApJ, 757, 63
- Markwardt (2009) Markwardt, C. B. 2009, in ASP Conf. Ser., Vol. 411, Astronomical Data Analysis Software and Systems XVIII, ed. D. A. Bohlender, D. Durand, & C. A. Dowler, P. (San Francisco, 251
- Martin (2005) Martin, C. L. 2005, ApJ, 621, 227
- Martin et al. (2012) Martin, C. L., Shapley, A. E., Coil, A. L., et al. 2012, ApJ, 760, 127
- Matsuda et al. (2004) Matsuda, Y., Yamada, T., Hayashino, T., et al. 2004, AJ, 128, 569
- Matsuda et al. (2012) —. 2012, MNRAS, 425, 878
- McIntosh et al. (2005) McIntosh, D. H., Bell, E. F., Rix, H.-W., et al. 2005, ApJ, 632, 191
- Miller et al. (1992) Miller, P., Rawlings, S., Saunders, R., & Eales, S. 1992, MNRAS, 254, 93
- Monreal-Ibero et al. (2010) Monreal-Ibero, A., Arribas, S., Colina, L., et al. 2010, A&A, 517, A28
- Mori et al. (2004) Mori, M., Umemura, M., & Ferrara, A. 2004, ApJL, 613, L97
- Murray et al. (2011) Murray, N., Ménard, B., & Thompson, T. A. 2011, ApJ, 735, 66
- Murray et al. (2005) Murray, N., Quataert, E., & Thompson, T. A. 2005, ApJ, 618, 569
- Naab & Trujillo (2006) Naab, T. & Trujillo, I. 2006, MNRAS, 369, 625
- Nesvadba et al. (2008) Nesvadba, N. P. H., Lehnert, M. D., De Breuck, C., Gilbert, A. M., & van Breugel, W. 2008, A&A, 491, 407
- Ouchi et al. (2009) Ouchi, M., Ono, Y., Egami, E., et al. 2009, ApJ, 696, 1164
- Ouchi et al. (2008) Ouchi, M., Shimasaku, K., Akiyama, M., et al. 2008, ApJS, 176, 301
- Ouchi et al. (2010) Ouchi, M., Shimasaku, K., Furusawa, H., et al. 2010, ApJ, 723, 869
- Petrosian (1976) Petrosian, V. 1976, ApJL, 209, L1
- Prochaska et al. (2011) Prochaska, J. X., Kasen, D., & Rubin, K. 2011, ApJ, 734, 24
- Rich et al. (2011) Rich, J. A., Kewley, L. J., & Dopita, M. A. 2011, ApJ, 734, 87
- Rubin et al. (2011) Rubin, K. H. R., Prochaska, J. X., Ménard, B., et al. 2011, ApJ, 728, 55
- Rupke et al. (2005a) Rupke, D. S., Veilleux, S., & Sanders, D. B. 2005a, ApJS, 160, 87
- Rupke et al. (2005b) —. 2005b, ApJS, 160, 115
- Rupke & Veilleux (2013) Rupke, D. S. N. & Veilleux, S. 2013, ApJ, 768, 75
- Saito et al. (2006) Saito, T., Shimasaku, K., Okamura, S., et al. 2006, ApJ, 648, 54
- Salpeter (1955) Salpeter, E. E. 1955, ApJ, 121, 161
- Shapley et al. (2003) Shapley, A. E., Steidel, C. C., Pettini, M., & Adelberger, K. L. 2003, ApJ, 588, 65
- Sharp & Bland-Hawthorn (2010) Sharp, R. G. & Bland-Hawthorn, J. 2010, ApJ, 711, 818
- Simpson et al. (2006) Simpson, C., Martínez-Sansigre, A., Rawlings, S., et al. 2006, MNRAS, 372, 741
- Simpson et al. (2012) Simpson, C., Rawlings, S., Ivison, R., et al. 2012, MNRAS, 421, 3060
- Smith & Jarvis (2007) Smith, D. J. B. & Jarvis, M. J. 2007, MNRAS, 378, L49
- Somerville et al. (2008) Somerville, R. S., Hopkins, P. F., Cox, T. J., Robertson, B. E., & Hernquist, L. 2008, MNRAS, 391, 481
- Soto et al. (2012) Soto, K. T., Martin, C. L., Prescott, M. K. M., & Armus, L. 2012, ApJ, 757, 86
- Springel & Hernquist (2003) Springel, V. & Hernquist, L. 2003, MNRAS, 339, 312
- Steidel et al. (2000) Steidel, C. C., Adelberger, K. L., Shapley, A. E., et al. 2000, ApJ, 532, 170
- Steidel et al. (2011) Steidel, C. C., Bogosavljević, M., Shapley, A. E., et al. 2011, ApJ, 736, 160
- Steidel et al. (2010) Steidel, C. C., Erb, D. K., Shapley, A. E., et al. 2010, ApJ, 717, 289
- Taniguchi & Shioya (2000) Taniguchi, Y. & Shioya, Y. 2000, ApJL, 532, L13
- Toomre (1977) Toomre, A. 1977, ARA&A, 15, 437
- Tremonti et al. (2004) Tremonti, C. A., Heckman, T. M., Kauffmann, G., et al. 2004, ApJ, 613, 898
- Trujillo & Aguerri (2004) Trujillo, I. & Aguerri, J. A. L. 2004, MNRAS, 355, 82
- Ueda et al. (2008) Ueda, Y., Watson, M. G., Stewart, I. M., et al. 2008, ApJS, 179, 124
- Veilleux et al. (2005) Veilleux, S., Cecil, G., & Bland-Hawthorn, J. 2005, ARA&A, 43, 769
- Veilleux & Rupke (2002) Veilleux, S. & Rupke, D. S. 2002, ApJL, 565, L63
- Veilleux et al. (2003) Veilleux, S., Shopbell, P. L., Rupke, D. S., Bland-Hawthorn, J., & Cecil, G. 2003, AJ, 126, 2185
- Weiner et al. (2009) Weiner, B. J., Coil, A. L., Prochaska, J. X., et al. 2009, ApJ, 692, 187
- Wilman et al. (2005) Wilman, R. J., Gerssen, J., Bower, R. G., et al. 2005, Nature, 436, 227
- Yang et al. (2009) Yang, Y., Zabludoff, A., Tremonti, C., Eisenstein, D., & Davé, R. 2009, ApJ, 693, 1579