Filling the Gap: a New Class of Old Star Cluster?
Abstract
It is not understood whether long-lived star clusters possess a continuous range of sizes and masses (and hence densities), or if rather, they should be considered as distinct types with different origins. Utilizing the Hubble Space Telescope (HST) to measure sizes, and long exposures on the Keck 10m telescope to obtain distances, we have discovered the first confirmed star clusters that lie within a previously claimed size-luminosity gap dubbed the ‘avoidance zone’ by Hwang et al (2011). The existence of these star clusters extends the range of sizes, masses and densities for star clusters, and argues against current formation models that predict well-defined size-mass relationships (such as stripped nuclei, giant globular clusters or merged star clusters). The red colours of these gap objects suggests that they are not a new class of object but are related to Faint Fuzzies observed in nearby lenticular galaxies. We also report a number of low luminosity UCDs with sizes of up to 50 pc. Future, statistically complete, studies will be encouraged now that it is known that star clusters possess a continuous range of structural properties.
keywords:
galaxies: formation – galaxies: star clusters – globular clusters: general1 Introductory Remarks
Old, compact star clusters have traditionally been classified into several types. These include globular clusters (GCs) first discovered in 1665 by Abraham Ihle (as noted by Schultz 1866). They are compact (having projected half-light sizes Rh of 3 pc) and span a wide range of mass. All large galaxies, including our own Milky Way, host a system of GCs.
In the last decade, several new types of star cluster containing an old stellar population have been identified. Deep imaging of the nearby lenticular galaxy NGC 1023 by the Hubble Space Telescope and spectroscopic follow-up using the 10m Keck I telescope revealed a population of low luminosity GC-like objects with large sizes ( 10 pc) dubbed Faint Fuzzies (FFs) by Larsen & Brodie (2000). Objects with similar sizes and luminosities were discovered around M31 by Huxor et al. (2005) and named Extended Clusters (ECs). Similar extended objects have been identified in galaxies ranging from dwarfs to giant ellipticals (e.g. Peng et al. (2006), Georgiev et al. (2009)), and may be related to the Palomar-type GCs found in the outer halo of the Milky Way.
Searches beyond the Local Group have revealed an additional population of star clusters called Ultra Compact Dwarfs (UCDs; Drinkwater et al. 2000). These spherical collections of stars were first thought to be very compact dwarf galaxies but they also resemble extended (Rh 10 pc) GCs, some two magnitudes brighter than EC/FFs. The origin of these various star clusters (GCs, EC/FFs and UCDs) and their relationship to each other is the subject of debate (e.g. Forbes & Kroupa (2011); Willman & Strader (2012)).
The size and luminosity distribution of star clusters was
summarised recently by Brodie et al. (2011) (to download database see:
http://sages.ucolick.org/downloads/sizetable.txt).
They included all types of
known star cluster with old ( 5 Gyr) stellar
ages. They also restricted their sample to objects
with confirmed distances. This is important if one is
exploring size and luminosity trends, but this has not always been the
case in the literature.
From size and luminosity,
the projected surface and volume densities can also be
derived.
In Figure 1 we show the fundamental parameters of size and luminosity from this state-of-the-art compilation for long-lived star clusters. The figure shows a U-shaped distribution. The high luminosity, extended star clusters are generally referred to as UCDs, the base of the U-shape is occupied by compact GCs and the low luminosity, extended size regime is associated with ECs and FFs. Two extreme Milky Way GCs are highlighted in the figure; NGC 2419 (the largest Galactic GC, which lies in the region near low luminosity UCDs) and Cen (the most luminous Galactic GC). The figure shows that star clusters with V band magnitudes MV brighter than –10 and projected half-light radii Rh greater than 5 pc are very rare, if not completely absent, in the Local Group of galaxies which is dominated by the Milky Way and Andromeda. Only a few objects beyond the Local Group are known with MV fainter than –8.5. This corresponds to an apparent magnitude limit of V 22.5 at the distance of the Virgo cluster (a typical limiting magnitude for spectroscopic studies on 8m class telescopes). The exception is the deep HST and Keck telescope observations of FFs in NGC 1023 by Larsen & Brodie (2000). The figure also highlights the lack of very compact, very luminous objects, i.e. those with ultra high densities. It has been argued by Hopkins et al. (2010) that feedback from massive stars sets an upper density limit, beyond which star clusters do not form.
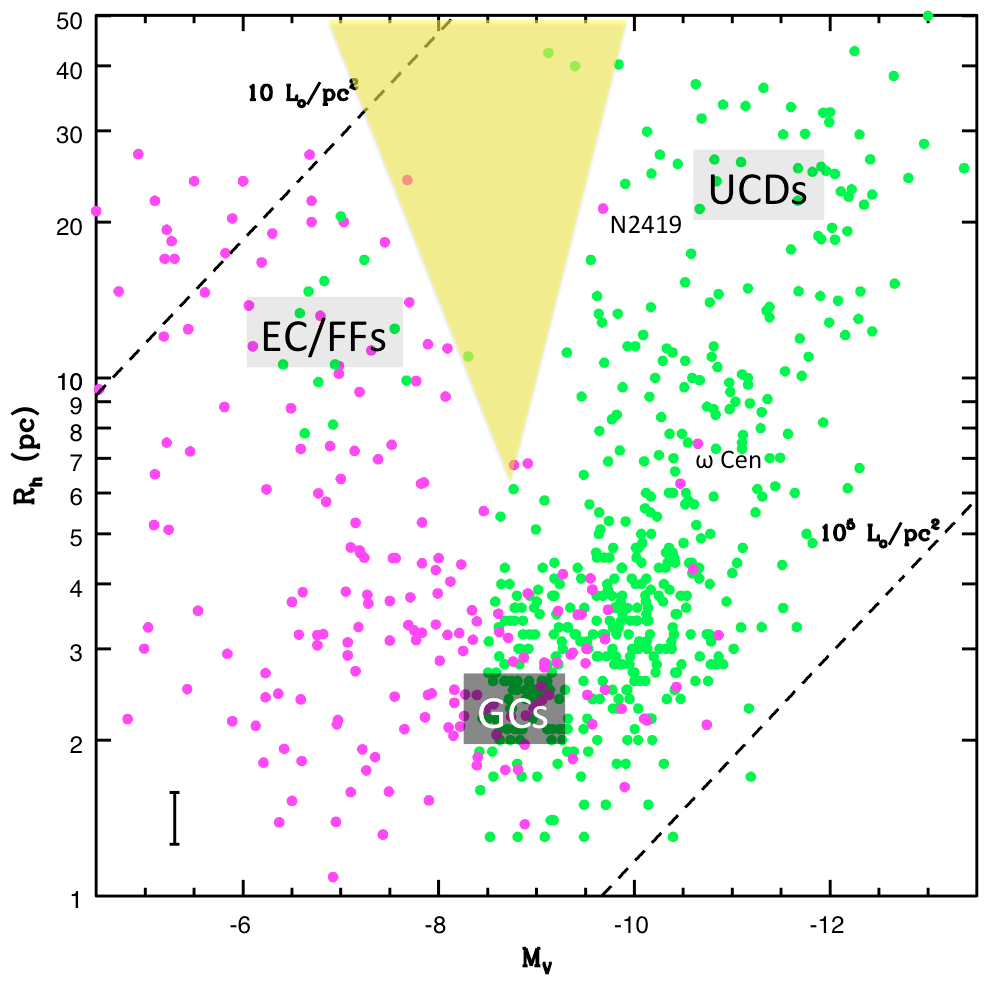
However, perhaps the most interesting feature of Figure 1 is the deficiency of objects around M and R pc, i.e. sizes and luminosities intermediate between EC/FFs and UCDs. This gap in the size-luminosity distribution has been called the star cluster ‘avoidance zone’ by Hwang et al. (2011). Such a gap could be due to physical processes or to an observational selection effect. A real gap would imply that EC/FFs are physically distinct from low luminosity UCDs and hence are formed by different mechanisms that have inherent upper and lower mass limits respectively. Continuity across the gap might suggest that one family of star cluster has a wider range of properties than previously known or that a new type of star cluster exists.
Here we briefly present the recession velocities, and hence physical sizes and luminosities for extended (Rh 5pc) star clusters around three elliptical galaxies. In particular, we investigate whether these star clusters occupy the ‘avoidance zone’ seen in Figure 1 or not.
2 The Data
To identify potential star clusters in the ‘avoidance zone’ the candidates need to be resolved in order to measure their sizes. This is best achieved with the superior spatial resolution of the Hubble Space Telescope (HST). A small number of nearby elliptical galaxies have been imaged by HST in two filters (required for colour selection) and over half a dozen pointings (needed to identify a large number of candidate star clusters associated with each galaxy). In particular, half-light sizes have been measured from g and z band HST/ACS images for candidate star clusters in NGC 4278 by Usher et al. (2013, in prep.) and NGC 4649 by Strader et al. (2012). In both the Usher et al. and Strader et al. works, objects were selected on the basis of having colours that matched those expected of candidate star clusters. Sizes were then determined using the ISHAPE software and visual inspection to remove obvious background galaxies. For NGC 4697 a similar procedure was used. The galaxies are located at distances of 15.6 Mpc (NGC 4278), 17.3 Mpc (NGC 4649) and 11.4 Mpc (NGC 4697). At these distances HST can resolve sizes as small as 1–2 pc.
After selecting resolved star cluster candidates (with GC-like colours) around these three galaxies, we designed several multi-object slit masks for the DEIMOS instrument on the 10m Keck II telescope. Typical exposures of 2 hrs, in 0.8–1.2 arcsec seeing conditions during the nights of 2013 January 11-12, were obtained. The resulting spectra were reduced using standard procedures and radial velocities measured, e.g. following the method of Pota et al. (2013). For each galaxy we confirmed several tens of GCs, with sizes of 3 pc, to have velocities consistent with that of their host galaxy. A small number of background galaxies, with significantly higher velocities, were confirmed in each mask. Their magnitudes, colors and angular sizes of the background galaxies are provided in the Appendix.
Here we focus on the confirmed objects with sizes greater than 5 pc. Table 1 lists their magnitudes, colours, average half-light radii from the g and z bands and apparent V band magnitudes from the transformation: (based on a large sample of GCs from Usher et al. 2013, in prep.). IDs for the objects come from Usher et al. (2013, in prep.), Strader et al. (2012) and this work for NGC 4278, 4649 and 4697 respectively.
| ID | z | err | (g–z) | err | Rh | err | MV |
|---|---|---|---|---|---|---|---|
| (mag) | (mag) | (mag) | (mag) | (pc) | (pc) | (mag) | |
| N4278 | |||||||
| acs0320 | 20.78 | 0.030 | 0.845 | 0.041 | 23.23 | 0.51 | -9.65 |
| acs0259 | 20.00 | 0.026 | 0.899 | 0.039 | 21.12 | 0.64 | -10.37 |
| acs0498 | 21.11 | 0.012 | 0.882 | 0.019 | 8.47 | 0.10 | -9.29 |
| acs1362 | 20.30 | 0.027 | 0.810 | 0.030 | 8.35 | 0.67 | -10.10 |
| acs2305 | 21.95 | 0.026 | 1.260 | 0.039 | 6.34 | 0.55 | -8.17 |
| acs1369 | 18.43 | 0.014 | 1.440 | 0.021 | 6.07 | 0.34 | -11.55 |
| acs0965 | 21.13 | 0.016 | 0.970 | 0.023 | 5.83 | 0.32 | -9.20 |
| acs1365 | 21.15 | 0.013 | 0.986 | 0.019 | 5.55 | 0.22 | -9.18 |
| acs1606 | 20.59 | 0.014 | 0.906 | 0.020 | 5.53 | 0.30 | -9.80 |
| acs1634 | 22.07 | 0.025 | 0.973 | 0.038 | 5.11 | 0.55 | -8.26 |
| acs1381 | 20.66 | 0.010 | 0.823 | 0.014 | 5.09 | 0.15 | -9.79 |
| N4649 | |||||||
| D68 | 19.66 | 0.062 | 0.991 | 0.087 | 47.42 | 3.37 | -10.78 |
| A155 | 21.59 | 0.039 | 1.026 | 0.047 | 39.52 | 4.22 | -8.83 |
| A32 | 19.91 | 0.018 | 0.923 | 0.023 | 36.48 | 2.64 | -10.57 |
| E91 | 21.85 | 0.020 | 1.690 | 0.031 | 16.09 | 1.65 | -8.04 |
| C84 | 21.46 | 0.021 | 1.591 | 0.031 | 14.99 | 1.37 | -8.53 |
| C42 | 20.80 | 0.016 | 0.919 | 0.021 | 14.91 | 1.11 | -9.69 |
| A122 | 21.73 | 0.027 | 1.600 | 0.040 | 14.69 | 1.51 | -8.25 |
| A51 | 21.10 | 0.016 | 1.659 | 0.025 | 13.79 | 1.14 | -8.83 |
| C28 | 20.58 | 0.015 | 0.927 | 0.019 | 13.58 | 0.99 | -9.90 |
| B139 | 21.71 | 0.021 | 0.952 | 0.028 | 11.17 | 0.96 | -8.76 |
| J67 | 19.81 | 0.019 | 0.877 | 0.031 | 9.83 | 0.17 | -10.72 |
| J623 | 20.93 | 0.049 | 0.934 | 0.065 | 6.88 | 0.26 | -9.55 |
| B8 | 18.62 | 0.010 | 1.314 | 0.015 | 5.58 | 0.39 | -11.59 |
| J76 | 19.19 | 0.022 | 1.230 | 0.042 | 5.55 | 0.15 | -11.08 |
| A197 | 22.76 | 0.031 | 1.085 | 0.041 | 5.04 | 0.72 | -7.61 |
| N4697 | |||||||
| acs52 | 19.25 | 0.002 | 0.846 | 0.004 | 27.30 | 2.59 | -10.49 |
| acs580 | 22.09 | 0.017 | 1.342 | 0.059 | 26.42 | 8.43 | -7.27 |
| acs112 | 20.05 | 0.004 | 0.882 | 0.006 | 19.15 | 1.92 | -9.67 |
| acs173 | 20.48 | 0.005 | 1.021 | 0.008 | 19.18 | 1.98 | -9.13 |
| acs132 | 20.24 | 0.004 | 0.865 | 0.007 | 15.57 | 2.25 | -9.49 |
| acs486 | 21.79 | 0.012 | 0.960 | 0.017 | 7.85 | 3.03 | -7.86 |
| acs071 | 19.60 | 0.003 | 0.906 | 0.005 | 5.37 | 2.14 | -10.10 |
| acs474 | 21.75 | 0.010 | 0.960 | 0.016 | 4.90 | 1.98 | -7.91 |
| acs782 | 22.59 | 0.021 | 1.515 | 0.039 | 7.08 | 3.14 | -6.65 |
| acs270 | 20.99 | 0.008 | 1.300 | 0.012 | 5.29 | 1.00 | -8.41 |
| acs607 | 22.18 | 0.016 | 1.445 | 0.029 | 6.14 | 2.81 | -7.11 |
| acs805 | 22.67 | 0.019 | 1.329 | 0.035 | 5.15 | 1.04 | -6.71 |
3 Filling the gap
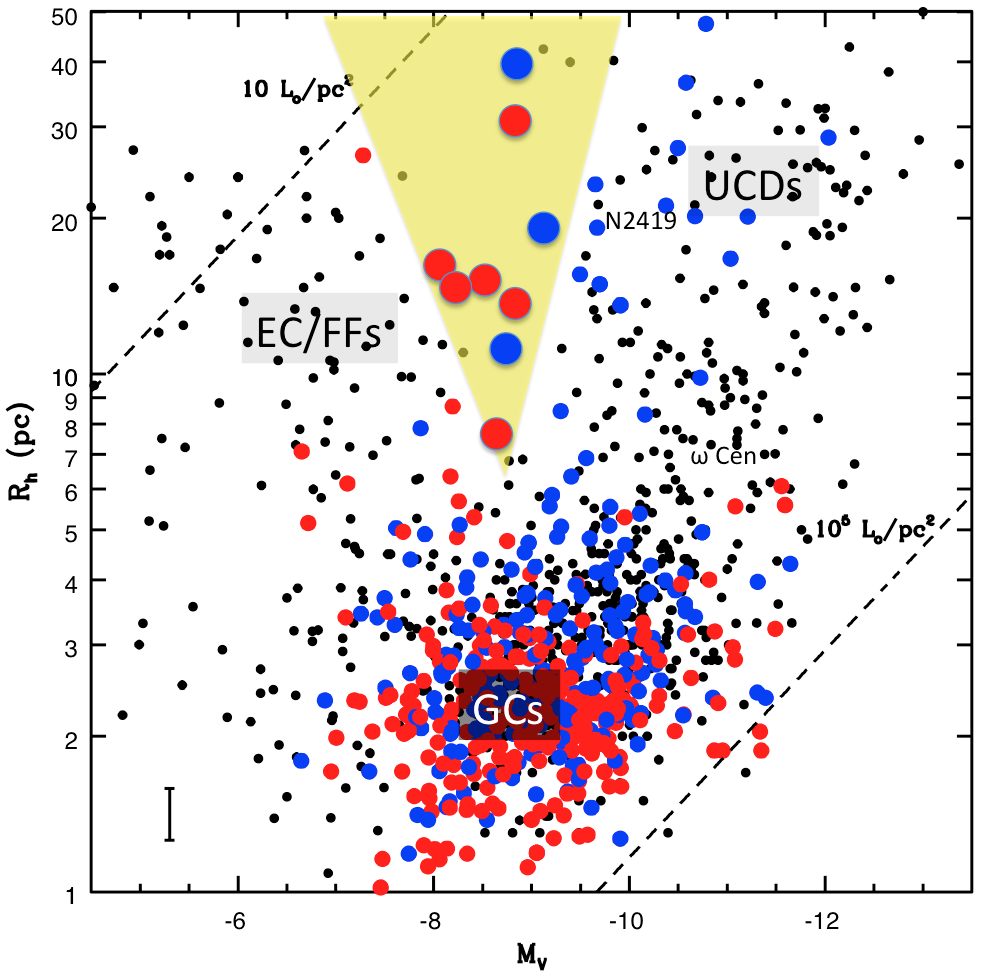
In Figure 2 we again show the data points from Brodie et al. (2011) and now include all the confirmed star clusters in NGC 4278, 4649 and 4697. Our main finding is that old star clusters do indeed occupy the ‘avoidance zone’ gap. The avoidance zone is therefore simply the result of a selection bias in previous works which were unable to reach low enough surface brightness levels beyond the Local Group. Here we confirm that long-lived star clusters cover a wide and continuous range of sizes and luminosities (and hence densities).
A clue to the nature of the extended size star clusters comes from their instrinsic colours. In Figure 2 objects have been coded by their colour, i.e. red or blue for a colour separation at (g–z) = 1.1, which corresponds to a metallicity of [Fe/H] –1. We find that the high luminosity star clusters tend to be blue (or metal-poor) and the low luminosity ones red (metal-rich). Focusing on the gap itself, the clusters are mostly red in colour indicating that they are metal-rich. This suggests that they are more closely related to the lower luminosity FFs found in NGC 1023 by Larsen & Brodie (2000) and the Diffuse Star Clusters (DSCs) of Peng et al. (2006) which are metal-rich and red in colour. These objects are typically associated with the disks of lenticular galaxies that reveal signs of a past interaction. Burkert, Brodie & Larsen (2005) suggest that FFs form in metal-rich disks as the result of an interaction and subsequent starburst. Goudfrooij (2012) has argued that the intermediate-aged diffuse star clusters in the merger remnant NGC 1316 may evolve to resemble FFs after the continued disruption by tidal shocks. Although all three host galaxies studied here are classified as ellipticals, we note that NGC 4278 contains a large HI ring (Raimond et al. 1981) that is perhaps a remnant of a past interaction, NGC 4649 reveals strong rotation in its outer region as might expected after a major merger (Hwang et al. 2008) and NGC 4697 is highly flattened (E6) and so may be a mis-classified S0 (Dejonghe et al. 1996).
We have also confirmed the existence of several other interesting objects. They include a number of blue low luminosity UCDs, similar to those found originally by Strader et al. (2011) and listed in their table 9. Two of these have sizes and luminosities very similar to the Milky Way GC NGC 2419, the largest known GC in the Milky Way. Like other massive GCs in the Milky Way, NGC 2419 contains multiple stellar populations, e.g. Cohen & Kirby (2012), which are traditionally associated with galaxies (Forbes & Kroupa (2011); Willman & Strader (2012)). Indeed Cohen & Kirby (2012) have suggested that NGC 2419 is not in fact a GC but the remnant nucleus of a stripped dwarf galaxy. If it was once part of a dark matter dominated dwarf galaxy, that dark matter appears to have been largely stripped away as none is detected today in its outer regions (Conroy, Loeb & Spergel (2011); Ibata et al. (2013)).
We also confirm an object (acs580) around NGC 4697 with a similar luminosity to the red FFs but with a larger size (26 pc). This object has the lowest surface density of any confirmed old star cluster beyond the Local Group. Finally, we note that one star cluster (D68) has a luminosity of MV = –10.8, similar to that of Cen (the most massive GC or remnant nucleus in the Milky Way) but with a half light radius some six times larger at 47 pc and hence a lower surface density by a factor of 35.

In Figure 3 we show several examples of our Keck spectra for selected star clusters. The examples include: acs112 which has a size and luminosity similar to that of the Milky Way GC NGC 2419; D68, the largest star cluster confirmed in this work; A51, a red star cluster located in the ‘avoidance zone’ and acs580 a large faint fuzzy (FF) analogue around NGC 4697.
We remind the reader that it becomes increasingly difficult with decreasing brightness and increasing size to confirm low density star clusters (the upper left hand side of Figure 2) and so a reduction in the number of star clusters in that region of the figure is probably due to current observational limitations. Future deep surveys may rectify this, finding that region is well-populated.
4 Concluding Remarks
A number of theories have been put forward to explain the origin of the different types of extended star cluster with corresponding predictions for their structural properties. For example, if UCDs are simply giant GCs (Murray (2009)) or the remnant nuclei of stripped dwarf galaxies (Bekki et al. (2001)) then a well-defined size-luminosity trend of near constant density is predicted. In the merging star cluster simulations of Bekki et al. (2004) the resulting UCDs are also predicted to have a well-defined size-luminosity relationship. Although a distinct size-luminosity relation may exist for more luminous objects (such as compact ellipticals), for luminosities fainter than MV = –13.5 we find a continuous range in size and luminosity for old star clusters. With the introduction of an external tidal field, and exploring a larger range of masses, the simulations of Brüns et al. (2011) produced merged star clusters with a large range of size and luminosity. However, their work indicated an upper limit to the maximum size that increased with star cluster mass. This is not generally seen in our data.
Individual star clusters were assumed to follow a distinct initial size-mass relationship in the simulations of Gieles et al. (2010) but the effects of stellar evolution, binaries and two-body relaxation over time resulted in their old clusters having large (Rh 10 pc) sizes. Tidal effects would tend to reduce this size further. While matching some aspects of our data, this model has difficulty reproducing the largest (Rh 10 pc) star clusters.
In summary, we find a continuity of
structural properties across a gap in size and luminosity
called the ‘avoidance zone’. The red colours of these gap objects
suggests that they are not a new class of object but are
related to the Faint Fuzzies observed in nearby lenticular galaxies.
We also report a number of low luminosity UCDs with sizes of up
to 50 pc.
No single model for the formation of extended star clusters can
currently reproduce the diversity of structural properties now observed for old
star clusters.
ACKNOWLEDGEMENTS
The data presented herein were obtained at the W.M. Keck Observatory, which is operated as a scientific partnership among the California Institute of Technology, the University of California and the National Aeronautics and Space Administration. The Observatory was made possible by the generous financial support of the W.M. Keck Foundation. The analysis pipeline used to reduce the DEIMOS data was developed at UC Berkeley with support from NSF grant AST-0071048. Based on observations made with the NASA/ESA Hubble Space Telescope, obtained from the data archive at the Space Telescope Science Institute. STScI is operated by the Association of Universities for Research in Astronomy, Inc. under NASA contract NAS 5-26555. DF thanks the ARC for support via DP130100388. JB acknowledges support from NSF grant AST-1109878. We thank the referee for several useful suggestions that have improved the paper.
References
- Bekki et al. (2001) Bekki K., Couch W. J., Drinkwater M. J., Gregg M. D., 2001, ApJL, 557, L39
- Bekki et al. (2004) Bekki K., Couch W. J., Drinkwater M. J., Shioya Y., 2004, ApJL, 610, L13
- Brodie et al. (2011) Brodie J. P., Romanowsky A. J., Strader J., Forbes D. A., 2011, AJ, 142, 199
- Brüns et al. (2011) Brüns R. C., Kroupa P., Fellhauer M., Metz M., Assmann P., 2011, A&A, 529, A138
- (5) Burkert A., Brodie J., Larsen S., 2005, ApJ, 628, 231
- Cohen & Kirby (2012) Cohen J. G., Kirby E. N., 2012, ApJ, 760, 86
- Conroy, Loeb & Spergel (2011) Conroy C., Loeb A., Spergel D. N., 2011, ApJ, 741, 72
- (8) Dejonghe H., de Bruyne V., Vauterin P., Zeilinger W., 1996, A&A, 306, 363
- (9) Drinkwater M., Jones J., Gregg M., Phillipps S., 2000, PASA, 17, 227
- Forbes & Kroupa (2011) Forbes D., Kroupa P., 2011, PASA, 28, 77
- Georgiev et al. (2009) Georgiev I., Puzia T., Hilker M., Goudfrooij P., 2009, MNRAS, 392, 879
- Gieles et al. (2010) Gieles M., Baumgardt H., Heggie D. C., Lamers H. J. G. L. M., 2010, MNRAS, 408, L16
- Goudfrooij (2012) Goudfrooij P., 2012, ApJ, 750, 140
- Hopkins et al. (2010) Hopkins P. F., Murray N., Quataert E., Thompson T. A., 2010, MNRAS, 401, L19
- Huxor et al. (2005) Huxor A. P., Tanvir N. R., Irwin M. J., Ibata R., Collett J. L., Ferguson A. M. N., Bridges T., Lewis G. F., 2005, MNRAS, 360, 1007
- Hwang et al. (2008) Hwang S., Park, J.-H., Sohn, Y., Lee, S., Rey, S., Lee, Y., Kim, H., 2008, ApJ, 674, 869
- Hwang et al. (2011) Hwang N., Lee M. G., Lee J. C., Park W.-K., Park H. S., Kim S. C., Park J.-H., 2011, ApJ, 738, 58
- Ibata et al. (2013) Ibata R., Nipoti C., Sollima A., Bellazzini M., Chapman S. C., Dalessandro E., 2013, MNRAS, 428, 3648
- Larsen & Brodie (2000) Larsen S., Brodie J., 2000, AJ, 120, 2938
- Murray (2009) Murray N., 2009, ApJ, 691, 946
- Peng et al. (2006) Peng E. W. et al., 2006, ApJ, 639, 838
- Pota et al. (2013) Pota V. et al., 2013, MNRAS, 428, 389
- (23) Raimond E., Faber S., Gallagher J., Knapp G., 1981, ApJ, 246, 708
- Schultz (1866) Schultz E., 1866, AN, 67, 1
- Strader et al. (2011) Strader J. et al., 2011, ApJS, 197, 33
- Strader et al.. (2012) Strader J. et al., 2012, ApJ, 760, 87
- Willman & Strader (2012) Willman B., Strader J., 2012, AJ, 144, 76
Appendix A Background objects
We caution that some researchers have attempted to explore the size-luminosity distribution of star clusters without having a confirmed distance to each object. This is a dangerous practice and can lead to incorrect conclusions. For example, some have been tempted to explore mean size trends with luminosity and to make subsequent comparisons with theoretical predictions. In Table A1 we list the objects which have similar apparent sizes and magnitudes to our confirmed objects but our spectroscopic redshifts indicate that they are actually distant background galaxies. The columns are ID, z magnitude and error, (g–z) colour and error, half-light radius and error.
| ID | z | err | (g–z) | err | Rh | err |
|---|---|---|---|---|---|---|
| (mag) | (mag) | (mag) | (mag) | (arcsec) | (arcsec) | |
| N4278 | ||||||
| acs2464 | 22.18 | 0.02 | 0.84 | 0.03 | 0.07 | 0.003 |
| acs0284 | 21.86 | 0.05 | 1.49 | 0.08 | 0.14 | 0.017 |
| N4649 | ||||||
| A78 | 21.14 | 0.020 | 1.56 | 0.028 | 0.23 | 0.026 |
| E86 | 21.68 | 0.023 | 0.61 | 0.029 | 0.18 | 0.015 |
| E123 | 22.14 | 0.029 | 1.85 | 0.048 | 0.17 | 0.025 |
| A221 | 22.48 | 0.033 | 1.33 | 0.048 | 0.17 | 0.024 |
| N4697 | ||||||
| acs836 | 22.76 | 0.022 | 0.92 | 0.022 | 0.19 | 0.009 |
| acs868 | 22.84 | 0.023 | 1.49 | 0.030 | 0.15 | 0.009 |