Constraining explosion type of young supernova remnants using 24 m emission morphology
Abstract
Determination of the explosion type of supernova remnants (SNRs) can be challenging, as SNRs are hundreds to thousands of years old and supernovae (SNe) are classified based on spectral properties days after explosion. Previous studies of thermal X-ray emission from Milky Way and Large Magellanic Cloud (LMC) SNRs have shown that Type Ia and core-collapse (CC) SNRs have statistically different symmetries, and thus these sources can be typed based on their X-ray morphologies. In this paper, we extend the same technique, a multipole expansion technique using power ratios, to infrared (IR) images of SNRs to test whether they can be typed using the symmetry of their warm dust emission as well. We analyzed archival Spitzer Space Telescope Multiband Imaging Photometer (MIPS) 24 m observations of the previously used X-ray sample, and we find that the two classes of SNRs separate according to their IR morphologies. The Type Ia SNRs are statistically more circular and mirror symmetric than the CC SNRs, likely due to the different circumstellar environments and explosion geometries of the progenitors. Broadly, our work indicates that the IR emission retains information of the explosive origins of the SNR and offers a new method to type SNRs based on IR morphology.
Subject headings:
methods: data analysis — ISM: supernova remnants — techniques: image processing — infrared: ISM1. Introduction
Supernovae (SNe) can be divided into two physically distinct classes: Type Ia and core-collapse (CC: Types Ib, Ic, and II) explosions. Type Ia SNe are thought to arise from the thermonuclear detonation of a white dwarf; CC SNe occur after the gravitational collapse of a massive star (8 ; Woosley & Janka 2005). Observationally, SNe are classified using their optical spectra near maximum brightness, days to weeks after the explosions (Filippenko, 1997). Thus, alternative means are necessary to constrain the explosion types of young supernova remnants (SNRs), the thermodynamical structures imprinted in the ISM hundreds to thousands of years after the SNe. In the literature, authors have employed numerous lines of evidence to elucidate the nature of SNR progenitors (see Vink 2012 for a review): abundance ratios of shock-heated ejecta, a coincident neutron star or pulsar, spectra of SN light echoes, and environment (e.g., a nearby OB association or emission from massive star wind material). Each of these indicators has associated challenges or shortcomings: for example, Type Ia SNRs have been found in star-forming (e.g., N103B: Lewis et al. 2003) or dense environments (e.g., Kepler: Reynolds et al. 2007), and SNRs may have chance alignments with pulsars (Kaspi, 1998). Therefore, complementary means to classify SNRs are useful to confirm the progenitors’ nature, and accurate typing of SNRs is critical to probe the recent, local population of SNe and their physical properties.
Recently, Lopez et al. (2009a, 2011, hereafter L09a and L11, respectively) have demonstrated that the X-ray morphology of SNRs can also be used to constrain explosion types. In particular, L09a and L11 performed a quantitative analysis of Chandra X-ray Observatory images of young (25000 years old) Milky Way and Large Magellanic Cloud (LMC) SNRs, and they showed that the X-ray line and thermal bremsstrahlung emission of Type Ia SNRs are more circular and mirror symmetric than core-collapse SNRs. The observed differences in morphologies are sufficiently large to permit a clean separation of the two explosion classes. These results arise due to the different geometries of the explosion mechanisms and circumstellar environments of Type Ia and CC SNRs.
| # | Source | AORKEY | AgeaaAges are uncertain for the sources which are not historical SNRs nor have detected light echoes. | Distance | RadiusbbRadius selected to enclose the entire source in the 24 m image; is determined assuming the distances given in the table. | Evidence of | References | ||
|---|---|---|---|---|---|---|---|---|---|
| (years) | (kpc) | (pc) | Explosion TypeccEvidence of explosion type: S = spectral properties (e.g. Prominent line emission associated with Type Ia SNe (Fe L emission) or core-collapse SNe (enhanced O, Mg, and/or Ne); L = light echoes; N = detection of a neutron star | () | () | ||||
| Type Ia Sources | |||||||||
| 1 | 050967.5 | 11542016 | 350–450 | 50 | 9.42 | S, L | 1, 2 | ||
| 2 | Kepler | 10914816 | 405 | 5.0 | 4.39 | S | 3 | ||
| 3 | 051969.0 | 11542272 | 400–800 | 50 | 10.49 | S, L | 4, 5 | ||
| 4 | N103B | 11531520 | 860 | 50 | 10.85 | S | 6 | ||
| 5 | DEM L71 | 11521536 | 4360 | 50 | 15.17 | S | 7 | ||
| Core-collapse Sources | |||||||||
| 6 | Cas A | 8099840 | 309–347 | 3.4 | 4.27 | N, S, L | 8 | ||
| 7 | W49B | 11021824 | 1000 | 8.0 | 7.31 | S | 9 | ||
| 8 | G15.90.2 | 15575808 | 1000 | 8.5 | 9.24 | N, S | 10 | ||
| 9 | G11.20.3 | 15629824 | 1623 | 5.0 | 4.50 | N, S | 11 | ||
| 10 | Kes 73 | 15651840 | 500–2200 | 8.0 | 7.82 | N, S | 12 | ||
| 11 | N132D | 11527168 | 3150 | 50 | 25.23 | S | 13 | ||
| 12 | G292.01.8 | 23088896 | 3300 | 6.0 | 9.69 | N, S | 14 | ||
| 13 | 050668.0 | 11533824 | 4600 | 50 | 16.88 | N, S | 15 | ||
| 14 | N49B | 11526912 | 10000 | 50 | 28.14 | S | 16 | ||
| 15 | B0453685 | 11532288 | 13000 | 50 | 23.20 | N, S | 17 | ||
References. — [1] Badenes et al. (2008); [2] Rest et al. (2008); [3] Reynolds et al. (2007); [4] Rest et al. (2005); [5] Hughes et al. (1995); [6] Lewis et al. (2003); [7] Hughes et al. (2003); [8] Hwang et al. (2004); [9] Lopez et al. (2013); [10] Reynolds et al. (2006); [11] Kaspi et al. (2001); [12] Gotthelf & Vasisht (1997); [13] Borkowski et al. (2007); [14] Hughes et al. (2001); [15] Hughes et al. (2006); [16] Park et al. (2003); [17] Gaensler et al. (2003)
In this paper, we extend the symmetry technique of L09a and L11 to Spitzer Space Telescope infrared (IR) images of young SNRs to test whether Type Ia and CC SNR morphologies are distinct at these wavelengths as well. The IR emission of SNRs arises from several mechanisms: e.g., stochastically and thermally heated dust (Reach et al., 2006; Andersen et al., 2011; Pinheiro Gonçalves et al., 2011), atomic/molecular lines (e.g., Arendt et al. 1999), polycyclic aromatic hydrocarbons (PAHs; e.g., Tappe et al. 2012), and synchrotron radiation (Rho et al., 2003). Previous IR surveys of SNRs with IRAS (e.g., Saken et al. 1992) and with Spitzer Space Telescope (e.g., Borkowski et al. 2006; Williams et al. 2006a; Pinheiro Gonçalves et al. 2011) have shown that a substantial component of the mid-IR emission comes from dust collisionally heated by the hot plasma generated by SNR shocks (Draine, 1981; Dwek, 1987). This conclusion is supported by the morphological similarities between 24 m emission and X-ray features in Chandra images (Borkowski et al., 2006; Williams et al., 2006a; Pinheiro Gonçalves et al., 2011), where the IR appears to trace the SNR blast waves seen in X-rays. Thus, we may expect a similar morphological difference between Type Ia and CC SNRs at IR wavelengths as in X-ray wavelengths.
The organization of this paper is as follows. We discuss the sample and data used in our analyses in Section 2. We outline the power-ratio method (PRM), a multipole expansion technique, employed for our symmetry analyses in Section 3. In Section 4, we present the results and discuss the implications regarding the IR morphological differences of Type Ia and CC SNRs. Section 5 summarizes the findings of this work.
2. Sample & Data Preparation
We analyzed archival Spitzer Multiband Imaging Photometer (MIPS; Rieke et al. 2004) observations of the 15 SNRs listed in Table 1 and shown in Figures 1 and 2. We have selected SNRs in both the Milky Way and the LMC which have resolved, extended emission in the Spitzer images. Our IR sample is a subset of the 24 SNRs in the L11 X-ray sample. We have excluded 9 L11 sources which are not detected in the mid- or far-IR, are not well separated from the IR background, or are not available publicly in the Spitzer archive. The 15 SNRs have been observed with Spitzer MIPS, either through targeted observations or via surveys of the Galactic plane (Churchwell et al., 2009) and of the LMC (Meixner et al., 2006). In our sample, 5 of the sources have been shown to have likely originated from Type Ia SNe, while 10 are considered to have been from CC SNe. The basis for these SN classifications (and associated references) is listed in Table 1.
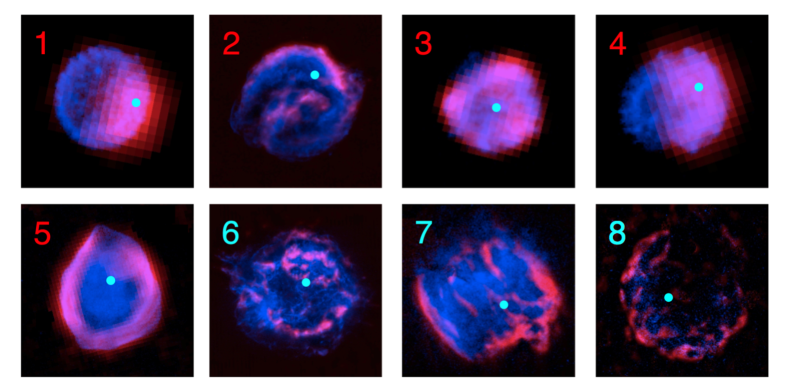
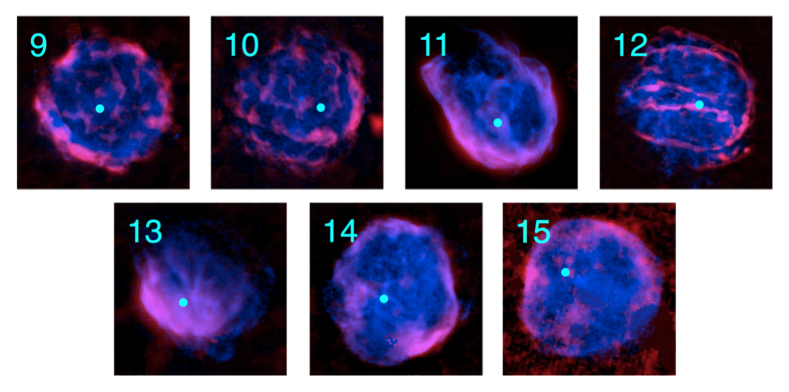
We opted to measure the Spitzer IR morphologies of our sample at 24 m for several reasons. At the near-IR wavelengths of the Infrared Array Camera (IRAC: Fazio et al. 2004), the emission of galaxies is dominated by starlight (at 5 m: Helou et al. 2004) and by PAHs (at 8m: Draine & Li 2007). At mid-IR wavelengths, several emission mechanisms contribute (see Section 1), but the dominant component of the IR radiation in the ISM is from warm dust at 24 m and 70 m (Draine & Li, 2007). Based on previous Spitzer surveys of SNRs at 24 m and 70 m, the former wavelength has the highest detection rate, with 32% of the Green SNR Catalog (Green, 2009) detected at 24 m (Pinheiro Gonçalves et al., 2011). Figures 1 and 2 shows the MIPS 24 m images of the 15 SNRs that comprise our sample together with the Chandra X-ray images (from L11).
Data were downloaded from the Spitzer Heritage Archive111http://archive.spitzer.caltech.edu/ and processed through the Spitzer MOSaicker and Point source EXtractor (MOPEX) GUI 18.5.0. We employed MOPEX to remove the background from each source by following the Overlap, Mosaic, and APEX 1frame template pipelines.
3. Methods
Following the data preparation, we applied the power-ratio method (PRM) to compare the IR morphologies of Type Ia and CC SNRs. The PRM quantifies the asymmetry in surface brightness distributions via calculation of multipole moments in a circular aperture. The PRM was used to characterize the X-ray morphologies of galaxy clusters (Buote & Tsai, 1996; Jeltema et al., 2005). Subsequently, the technique was extended to Chandra observations of SNRs to quantify the relative distribution of elements in individual SNRs (Lopez et al., 2009b) and to compare the morphologies of X-ray line and thermal bremsstrahlung emission in Type Ia and CC SNRs (L09a and L11).
The PRM employs a two-dimensional multipole expansion, which is derived similarly to the 2D expansion of a gravitational potential within an enclosed radius :
| (1) | |||||
where is the gravitational constant and the moments and are
Here, the position vector , and is the surface mass density, or for our analysis, the 24 m surface brightness.
The powers of the multipole expansion are obtained through integration of the magnitude of (the mth term in the multipole expansion) over a circle of radius :
| (2) |
The above equation reduces to:
| (3) |
To account for the different fluxes of sources, we divide the powers by to form the power ratios, .
The morphology and shape of the infrared emission is reflected through the moments and and the power ratios . Higher-order terms are probing the asymmetry at successively smaller scales. We have set the origin from which we draw our radius at the centroid of the 24 m surface brightness, so the dipole power, , approaches zero. Higher-order powers’ values quantify the morphology of the emission. For our analysis, we focus on the quadrupole power ratio and the octupole power ratio . The quadrupole power ratio, , is a measurement of the ellipticity of the distribution. Large values are derived for sources with elliptical/elongated morphologies; conversely, circular distributions give small values. The octupole power ratio, , characterizes the mirror asymmetry of a source. Asymmetric or non-uniform surface brightness distributions yield large , while mirror symmetric sources have small .
To estimate the uncertainty in the derived power ratios, we used a Monte Carlo approach similar to that of Lopez et al. (2009b, 2011). In particular, we took our background-subtracted images and smoothed out noise. Then, we put noise back into the image by assuming each pixel intensity is the mean of a Poisson distribution and selecting a new intensity from that distribution. We repeated this process 100 times for each SNR IR image, thus creating 100 mock images of each source; Figure 3 gives example mock images of two sources, N132D and Kepler, following this procedure. Then, we calculated the power ratios of the 100 images, and the 1- confidence limits were determined based on the values of the sixteenth highest and lowest power ratios obtained from the 100 mock images.
4. Results and Discussion
The resulting and values for the MIPS 24 m images of our 15 sources are plotted in Figure 4. Overall, we find that the Type Ia and CC SNRs have statistically significant different power ratios. The CC SNRs have a mean = () and a mean = (); the Type Ia SNRs have a mean = () and a mean = (). To verify the statistical separation of the Type Ia and CC SNR subsamples, we performed T-tests on their and values. The values of the two subsamples are different at the 99.4% confidence level, and values are distinct with 99.97% likelihood. A two-dimensional Kolmogorov-Smirnov (KS) test confirmed these findings, showing the Type Ia and CC SNRs have different power ratios with 99.9% confidence.
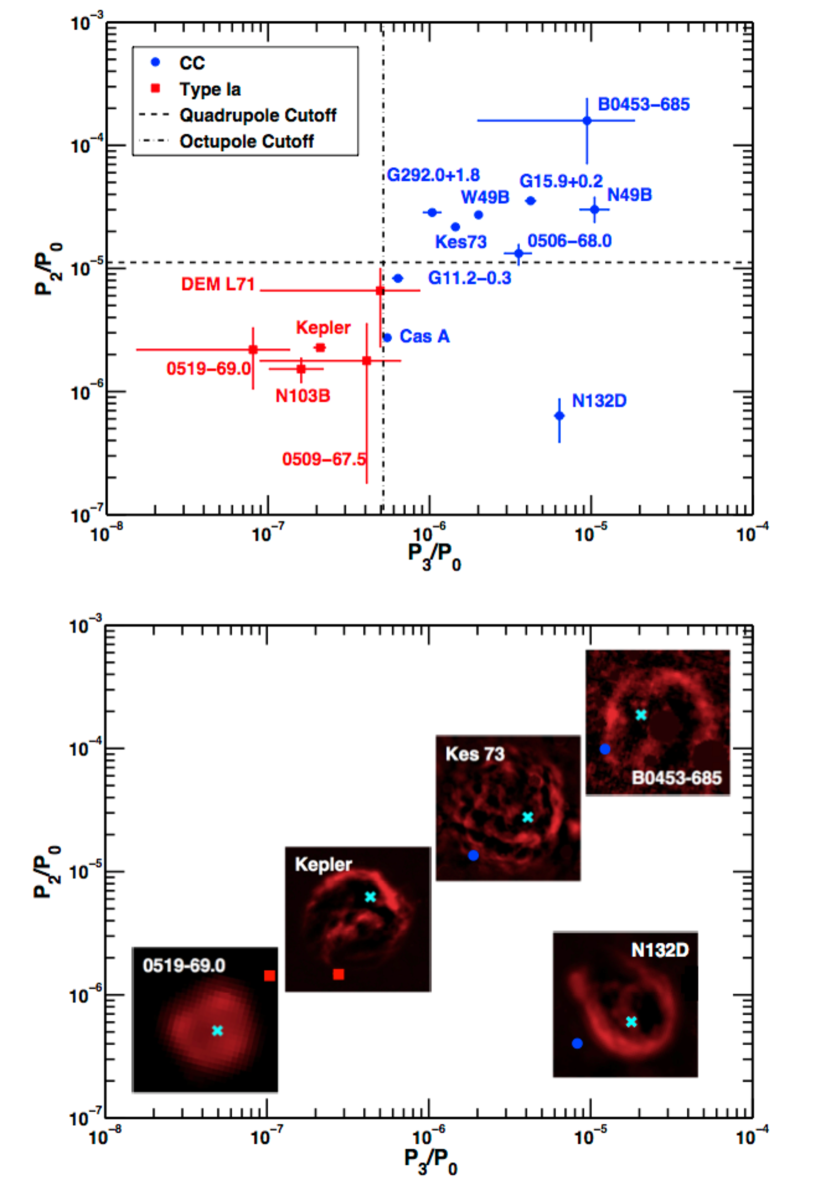
Generally, the CC SNRs populate a distinct part of the power ratio diagram than the Type Ia SNRs, and thus we can define boundaries in and between the two classes. Most of the CC SNRs have (although a few CC sources are below this limit: N132D, Cas A, and G11.20.3), while all of the Type Ia SNRs have . All of the CC SNRs have , and the Type Ia SNRs all have lower (although the uncertainty in for DEM L71 extends into the CC range). We note that the boundaries dividing the two regions are somewhat uncertain given the small number of sources in our sample. However, the typing of individual SNRs of unknown origin based on 24 m morphology is likely reliable if the and values are significantly above or below these dividing boundaries.
These quantitative results suggest that as a class, Type Ia SNRs have more circular and mirror symmetric IR emission than CC SNRs. These findings complement those from the X-ray analyses of L09a and L11, which showed that the X-ray line and thermal bremsstrahlung emission of Type Ia SNRs is more circular and mirror symmetric than CC SNRs. Although the morphological results in these two wavelength regimes are similar, the IR and X-ray emissions probe distinct emitting regions. In particular, the thermal X-rays trace the ejecta material heated by the reverse shock, while the IR originates from circumstellar dust heated by interaction with the blast wave (see Figures 1 and 2 for a comparison of the IR and X-ray images). However, the asymmetries derived from both the X-rays and IR are highly sensitive to the shape of the contact discontinuity, where the reverse-shocked ejecta are impacting the shocked ISM, since emission at larger radii is weighted more heavily in the moment calculation. As the contact discontinuity is shaped by both explosion geometry as well as the structure of the surrounding medium, the distinct symmetries of Type Ia and CC SNRs at 24 m reflect the different explosion mechanisms and environments of the two classes.
We note that the sample included in this study is only young-to-middle aged (300–13000 year old) SNRs with bright thermal X-ray emission. The IR emission of these SNRs is thought to be dominated by warm dust, but the IR emission in other SNRs may arise from the various mechanisms described in Section 1. For example, most of the IR flux density in plerionic SNRs (those shaped by their pulsar wind nebulae, like the Crab Nebula) comes from synchrotron losses (Strom & Greidanus, 1992), and the morphological properties of these sources may differ from those considered here. Furthermore, older SNRs will eventually “forget” their explosive origin as their shocks slow down and become radiative.
5. Summary
In this paper, we have used the power-ratio method (PRM) to quantify the 24 m IR morphologies of young SNRs. We have demonstrated that Type Ia SNRs have statistically more circular and mirror symmetric IR emission due to the distinct explosion mechanisms and environments of the two classes of SNe. The ability to distinguish between the two populations offers a new means to constrain SNR explosion types using IR imaging. Specifically, CC SNRs have and . In this wavelength regime, several all-sky surveys have been undertaken, such as the recent Wide-field Infrared Survey Explorer (WISE; Wright et al. 2010), and these data could be employed to explore the explosive origin of other nearby SNRs. Future high-resolution mid-IR imaging, with e.g., the James Webb Space Telescope Mid-Infrared Instrument (MIRI: Wright et al. 2004), may allow the typing of SNRs in more distant Local Group galaxies with this method as well.
References
- Andersen et al. (2011) Andersen, M., Rho, J., Reach, W. T., Hewitt, J. W., & Bernard, J. P. 2011, ApJ, 742, 7
- Arendt et al. (1999) Arendt, R. G., Dwek, E., & Moseley, S. H. 1999, ApJ, 521, 234
- Badenes et al. (2008) Badenes, C., Hughes, J. P., Cassam-Chenaï, G., & Bravo, E. 2008, ApJ, 680, 1149
- Borkowski et al. (2007) Borkowski, K. J., Hendrick, S. P., & Reynolds, S. P. 2007, ApJ, 671, L45
- Borkowski et al. (2006) Borkowski, K. J., et al. 2006, ApJ, 642, L141
- Buote & Tsai (1996) Buote, D. A., & Tsai, J. C. 1996, ApJ, 458, 27
- Carey et al. (2009) Carey, S. J., et al. 2009, PASP, 121, 76
- Churchwell et al. (2009) Churchwell, E., et al. 2009, PASP, 121, 213
- Draine (1981) Draine, B. T. 1981, ApJ, 245, 880
- Draine & Li (2007) Draine, B. T., & Li, A. 2007, ApJ, 657, 810
- Dwek (1987) Dwek, E. 1987, ApJ, 322, 812
- Fazio et al. (2004) Fazio, G. G., et al. 2004, ApJS, 154, 10
- Filippenko (1997) Filippenko, A. V. 1997, ARA&A, 35, 309
- Gaensler et al. (2003) Gaensler, B. M., Hendrick, S. P., Reynolds, S. P., & Borkowski, K. J. 2003, ApJ, 594, L111
- Gotthelf & Vasisht (1997) Gotthelf, E. V., & Vasisht, G. 1997, ApJ, 486, L133
- Green (2009) Green, D. A. 2009, Bulletin of the Astronomical Society of India, 37, 45
- Helou et al. (2004) Helou, G., et al. 2004, ApJS, 154, 253
- Hughes et al. (2003) Hughes, J. P., Ghavamian, P., Rakowski, C. E., & Slane, P. O. 2003, ApJ, 582, L95
- Hughes et al. (2006) Hughes, J. P., Rafelski, M., Warren, J. S., Rakowski, C., Slane, P., Burrows, D., & Nousek, J. 2006, ApJ, 645, L117
- Hughes et al. (2001) Hughes, J. P., Slane, P. O., Burrows, D. N., Garmire, G., Nousek, J. A., Olbert, C. M., & Keohane, J. W. 2001, ApJ, 559, L153
- Hughes et al. (1995) Hughes, J. P., et al. 1995, ApJ, 444, L81
- Hwang et al. (2004) Hwang, U., et al. 2004, ApJ, 615, L117
- Jeltema et al. (2005) Jeltema, T. E., Canizares, C. R., Bautz, M. W., & Buote, D. A. 2005, ApJ, 624, 606
- Kaspi (1998) Kaspi, V. M. 1998, Advances in Space Research, 21, 167
- Kaspi et al. (2001) Kaspi, V. M., Roberts, M. E., Vasisht, G., Gotthelf, E. V., Pivovaroff, M., & Kawai, N. 2001, ApJ, 560, 371
- Lewis et al. (2003) Lewis, K. T., Burrows, D. N., Hughes, J. P., Slane, P. O., Garmire, G. P., & Nousek, J. A. 2003, ApJ, 582, 770
- Lopez et al. (2009a) Lopez, L. A., Ramirez-Ruiz, E., Badenes, C., Huppenkothen, D., Jeltema, T. E., & Pooley, D. A. 2009a, ApJ, 706, L106
- Lopez et al. (2013) Lopez, L. A., Ramirez-Ruiz, E., Castro, D., & Pearson, S. 2013, ApJ, 764, 50
- Lopez et al. (2011) Lopez, L. A., Ramirez-Ruiz, E., Huppenkothen, D., Badenes, C., & Pooley, D. A. 2011, ApJ, 732, 114
- Lopez et al. (2009b) Lopez, L. A., Ramirez-Ruiz, E., Pooley, D. A., & Jeltema, T. E. 2009b, ApJ, 691, 875
- Meixner et al. (2006) Meixner, M., et al. 2006, AJ, 132, 2268
- Park et al. (2003) Park, S., Hughes, J. P., Slane, P. O., Burrows, D. N., Warren, J. S., Garmire, G. P., & Nousek, J. A. 2003, ApJ, 592, L41
- Pinheiro Gonçalves et al. (2011) Pinheiro Gonçalves, D., Noriega-Crespo, A., Paladini, R., Martin, P. G., & Carey, S. J. 2011, AJ, 142, 47
- Reach et al. (2006) Reach, W. T., et al. 2006, AJ, 131, 1479
- Rest et al. (2005) Rest, A., et al. 2005, Nature, 438, 1132
- Rest et al. (2008) —. 2008, ApJ, 680, 1137
- Reynolds et al. (2006) Reynolds, S. P., Borkowski, K. J., Hwang, U., Harrus, I., Petre, R., & Dubner, G. 2006, ApJ, 652, L45
- Reynolds et al. (2007) Reynolds, S. P., Borkowski, K. J., Hwang, U., Hughes, J. P., Badenes, C., Laming, J. M., & Blondin, J. M. 2007, ApJ, 668, L135
- Rho et al. (2003) Rho, J., Reynolds, S. P., Reach, W. T., Jarrett, T. H., Allen, G. E., & Wilson, J. C. 2003, ApJ, 592, 299
- Rieke et al. (2004) Rieke, G. H., et al. 2004, ApJS, 154, 25
- Saken et al. (1992) Saken, J. M., Fesen, R. A., & Shull, J. M. 1992, ApJS, 81, 715
- Sibthorpe et al. (2010) Sibthorpe, B., et al. 2010, ApJ, 719, 1553
- Strom & Greidanus (1992) Strom, R. G., & Greidanus, H. 1992, Nature, 358, 654
- Tappe et al. (2012) Tappe, A., Rho, J., Boersma, C., & Micelotta, E. R. 2012, ApJ, 754, 132
- Vink (2012) Vink, J. 2012, A&A Rev., 20, 49
- Williams et al. (2006a) Williams, B. J., et al. 2006a, ApJ, 652, L33
- Williams et al. (2006b) Williams, R. M., Chu, Y.-H., & Gruendl, R. 2006b, AJ, 132, 1877
- Woosley & Janka (2005) Woosley, S., & Janka, T. 2005, Nature Physics, 1, 147
- Wright et al. (2010) Wright, E. L., et al. 2010, AJ, 140, 1868
- Wright et al. (2004) Wright, G. S., et al. 2004, in Society of Photo-Optical Instrumentation Engineers (SPIE) Conference Series, Vol. 5487, Society of Photo-Optical Instrumentation Engineers (SPIE) Conference Series, ed. J. C. Mather, 653–663