A Molecular Line Survey of the Carbon-Rich Proto-Planetary Nebula AFGL 2688 in the 3 mm and 1.3 mm Windows
Abstract
We present a spectral line survey of the proto-planetary nebula AFGL 2688 (catalog ) in the frequency ranges of 71–111 GHz, 157–160 GHz, and 218–267 GHz using the Arizona Radio Observatory 12 m telescope and the Heinrich Hertz Submillimeter Telescope. A total of 143 individual spectral features associated with 32 different molecular species and isotopologues were identified. The molecules C3H, CH3CN, H2CO, H2CS, and HCO+ were detected for the first time in this object. By comparing the integrated line strengths of different transitions, we are able to determine the rotation temperatures, column densities, and fractional abundances of the detected molecules. The C, O, and N isotopic ratios in AFGL 2688 are compared with those in IRC+10216 and the Sun, and were found to be consistent with stellar nucleosynthesis theory. Through comparisons of molecular line strengths in asymptotic giant branch stars, proto-planetary nebulae, and planetary nebulae, we discuss the evolution in circumstellar chemistry in the late stages of evolution.
1 Introduction
Circumstellar envelopes (CSEs) created by stellar winds from stars on the Asymptotic Giant Branch (AGB) stage are active sites of molecular synthesis. Thus far, more than 70 molecular species have been detected in CSEs (Cernicharo et al., 2011, and references therein). During the post-AGB evolution,the effective temperatures of the central stars steeply increase, while at the same time, the remnants of the CSE expand and disperse. The increasing ultraviolet (UV) radiation fields gradually dissociate the molecules, and finally ionize the envelopes, leading to the formation of planetary nebulae (PNs). The proto-planetary nebula (PPN) is a rapid ( yr) transition phase between the AGB and PN phases (Kwok, 1993). The chemical processes during the evolution from the AGB to PN phases, however, are far from fully understood. Different carbon-to-oxygen abundance ratio sets up different reaction routes. Although the molecular species in carbon-rich environments is generally thought to be more abundant than that in oxygen-rich environments, Ziurys et al. (2007) recently found unexpected complexity of the chemistry in oxygen-rich environments. Unbiased spectral line survey is the best way to globally investigate the physical conditions and molecular composition in CSEs (see Cernicharo et al., 2011, for a recent review). Most of the work, however, has been focused on the brightest carbon star IRC+10216 (see, e.g., Kawaguchi et al., 1995; Cernicharo et al., 2000, 2010; Patel et al., 2011, etc). In order to better understand the processes involved in circumstellar chemistry, it would be useful to study objects at different stages of evolution, especially in the post-AGB and PN phases.
In order to understand the interactions between the molecular processes, stellar evolution, and chemical environment, our research group has undertaken a long-term project devoted to systematic molecular line surveys of a sample of evolved stars over a wide frequency range. We have reported the observations of carbon-rich AGB stars IRC+10216, CIT 6, AFGL 3068, and a young PN NGC 7027 in 1.3 mm, 2 mm, 3 mm, and 7 mm bands (He et al., 2008; Zhang et al., 2008, 2009a, 2009b; Chau et al., 2012). Since the same instrumental settings were used, the systematic uncertainties in the study of circumstellar chemistry are minimized. Our results demonstrate that the evolved stars in the AGB stage have similar chemical compositions and the differences in the abundance of long carbon-chain and Si-bearing molecules can be explained by slightly different evolutionary status and carbon abundances. In the PN stage, the chemical composition changes dramatically with the enhancement of ionized species and the destruction of long-chain molecules, implying the considerable influence of UV radiation field and/or shock waves on the circumstellar chemistry. The present paper is the sixth part of this series. We present a 3 mm and 1.3 mm spectral line survey toward the carbon-rich PPN AFGL 2688, with the goal of investigating the chemical transition in the short evolutionary timescale between the AGB and PN stages.
AFGL 2688 (CRL 2688, V1610 Cyg, the Egg Nebula) is a bipolar PPN whose visible appearance consists of a pair of bipolar lobes, a dark equatorial lane, and a large number of roughly concentric arcs (Sahai et al., 1998b). The dark equatorial lane exhibits strong emission from H2 and CO (Sahai et al., 1998a; Cox et al., 2000), suggesting the presence of molecular matter. Details of the stellar wind history and the nebular structures have been thoroughly discussed by Balick et al. (2012), who obtained an expansion velocity of 15–18 km s-1. The dynamical age of the nebula and mass loss rate were estimated to be 350 yr and M☉ yr-1, respectively (Ueta et al., 2006; Lo & Bechis, 1976). The central star of AFGL 2688 is a completely obscured F-type supergiant with an effective temperature of about 7250 K and enhanced abundances of carbon, nitrogen, neon, and yttrium (Ishigaki et al., 2012). The distance to this PPN is highly uncertain. Ney et al. (1975) and Cohen & Kuhi (1977) estimated a distance of 1–1.5 kpc, while a smaller value (0.3–0.42 kpc) was obtained by Ueta et al. (2006) and Balick et al. (2012) based on the expansion velocity. In lack of an accurate determination, we have adopted the commonly used value of 1 kpc (Sahai et al., 1998b).
Because of their brightness in the infrared and strong molecular emissions, AFGL 618 and AFGL 2688 are two of the most well studied PPNs, and are therefore suitable for spectral line surveys at millimeter wavelengths. In terms of morphology, both objects are bipolar nebulae and Woods et al. (2005) suggested that the molecular richness observed in the two PPNs is due to the presence of dense and optically thick equatorial tori separating the bipolar lobes. Based on the spectral type (B0) of the central star, AFGL 618 is more evolved than AFGL 2688 and is closer to becoming a PN. The line survey of AFGL 618 has been performed by Pardo et al. (2007) with the IRAM 30 m telescope in the frequency range of 80–276 GHz. For AFGL 2688, most of previous observations were limited to specific molecular lines. Park et al. (2008) surveyed this object in the frequency range of 85–116 GHz. Recently, Wesson et al. (2010) reported the Herschel-SPIRE FTS spectra of AFGL 618 and AFGL 2688 in the wavelength range from 195 to 670 m, which trace the warm inner regions of the CSEs. Differing from AFGL 618, AFGL 2688 does not show emission from ionized species, suggesting that its cool central star has not yet provided enough UV photons to alter the chemistry of the CSE.
A comparison between the chemical compositions of the two PPNs can inform us about the efficiency of chemical processes in PPN stage. For this purpose, a spectral line survey of AFGL 2688 over a wider frequency range and with higher sensitivity is desirable. As of 2013, the reported detected and tentatively detected molecules in AFGL 2688 include C2, C3, C4, CO, CN, CS, C2S, C2H, C4H, C5H, C6H, C4H2, C6H2, C3N, HCN, HNC, HC3N, HC5N, HC7N, HC9N, HCP, PH3, PN, NH3, SiS, SiO, SiC2, H2, H2O, NaCN, MgNC, AlF, and NaCl (see Cernicharo et al., 2001, 2011; Highberger et al., 2001, 2003; Tenenbaum & Ziurys, 2008; Milam et al., 2008; Park et al., 2008; Ishigaki et al., 2012; Wesson et al., 2010, and references therein).
The spectra of AFGL 2688 presented in this paper represent the most complete line survey of this object to date. In Section 2, we describe the observations and the data reduction. In Section 3, we present the detected molecular lines, intensity measurements, rotation diagram analysis, calculations of molecular abundances, as well as isotopic ratios. In Section 4, we discuss the implication of our observations on circumstellar chemistry. Finally, the conclusions are summarized in Section 5.
2 Observations and data reduction
The spectral line survey at the 3 mm and 1.3 mm windows were performed during the period from 2005 April and 2006 September with the Arizona Radio Observatory (ARO) 12 m telescope at Kitt Peak and the Heinrich Hertz Submillimeter Telescope (SMT) 10 m telescope at Mt. Graham. The observations were conducted in beam switching mode, with an azimuth beam throw of 2′. Pointing and focus were checked every two hours using nearby planets. We obtained the spectra of AFGL 2688 in the frequency ranges of 71–111 GHz, 157–160 GHz111The 157–160 GHz spectum was obtained using the 2 mm receiver on the 12 m telescope. Our original proposal is to also perform a complete 2 mm line survey (see He et al., 2008; Zhang et al., 2009a, b). However, because of limited observation time and poor weather, only a narrow spectral range was observed at the 2 mm window., and 218–267 GHz, with an on-source integration time of around one hour for each frequency setting. The dual-channel SIS receivers were employed in single sideband dual polarization mode. The system temperatures were 150–400 K and 400–700 K for the 3 mm and 1.3 mm bands, respectively. The image rejection ratio was typically better than 20 dB. The half-power beamwidths (HPBWs) of the ARO 12 m telescope and the SMT are 86′′–38′′ and 32′′–28′′ over the frequency ranges 71–160 GHz and 218–267 GHz, respectively. For the 3 mm observations, the receiver back-ends were equipped with two 256-channel filter banks (FBs) with spectral resolutions of 500 kHz and 1 MHz and a millimeter autocorrelator (MAC) with 3072 channels and 195 kHz resolution. The 3 mm data were calibrated to the temperature scale, which was corrected for atmospheric attenuation, radiative loss, and rearward and forward scattering and spillover by the chopper-wheel method. The main beam brightness temperature was derived using , where is the corrected beam efficiency (0.94–0.71 over the frequency range 71–161 GHz). For the 1.3 mm observations, the spectrometers used were a 2048-channel acousto-optical spectrometer (AOS) with a spectral resolution of 500 kHz per channel and 1024-channel Forbes Filterbanks (FFBs) with a spectral resolution of 1 MHz per channel. The temperature scale was given in term of , which was corrected for atmospheric attenuation. The main beam temperature was derived using , where the main beam efficiency, , is . The conversion factors are 32.5–29.1 Jy K-1 and 35 Jy K-1 for 3 mm and 1.3 mm observations, respectively.
The spectra were reduced using the CLASS software package in GILDAS, which is developed and distributed by the Observatorie de Grenoble and IRAM. The scans due to bad atmospheric conditions and receiver instabilities were discarded, and the calibrated spectral data were co-added using the noise of each spectrum as weights. Spectral baselines were subtracted by fitting the line-free spectral regions to the low-order polynomial. The 3 mm and 1.3 mm spectra were smoothed and rebinned to a frequency resolution of 1 MHz and 3 MHz, respectively. This led to a typical noise levels of mK in main beam temperature unit for both spectra.
3 Results
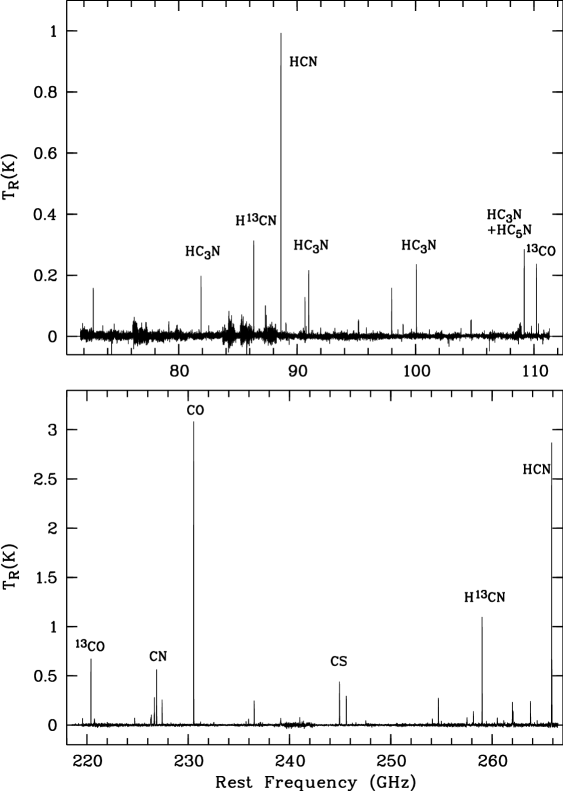
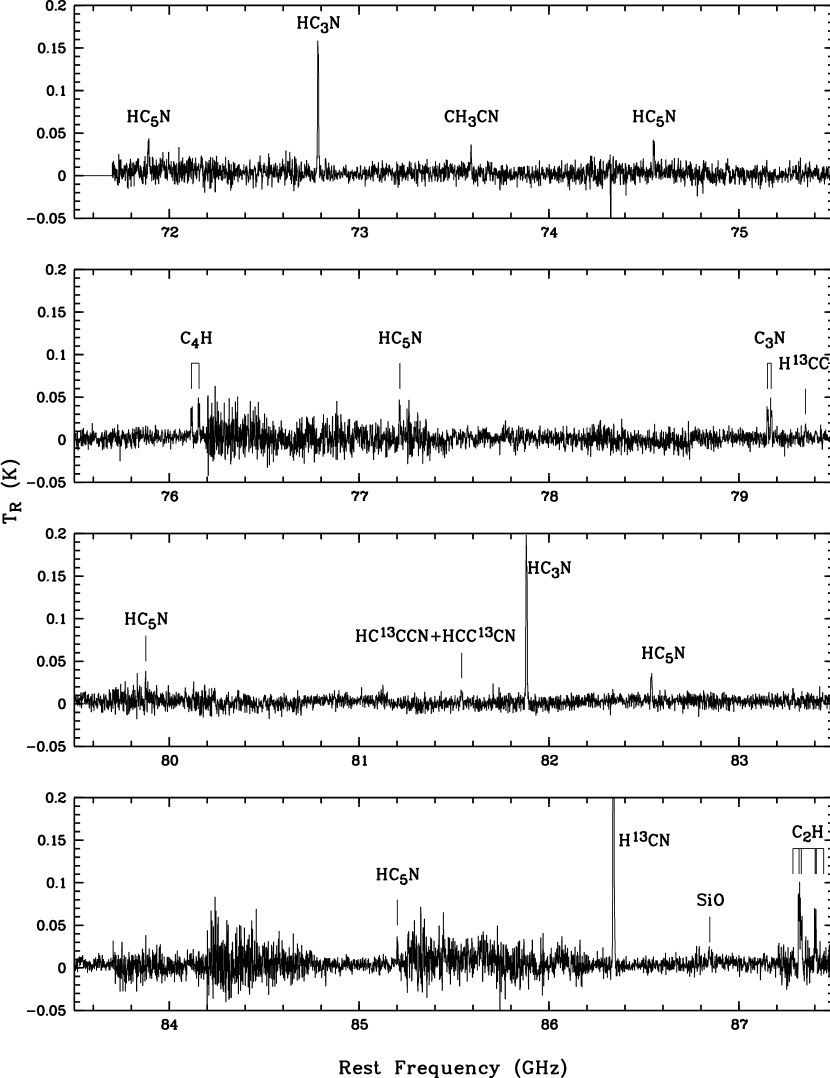
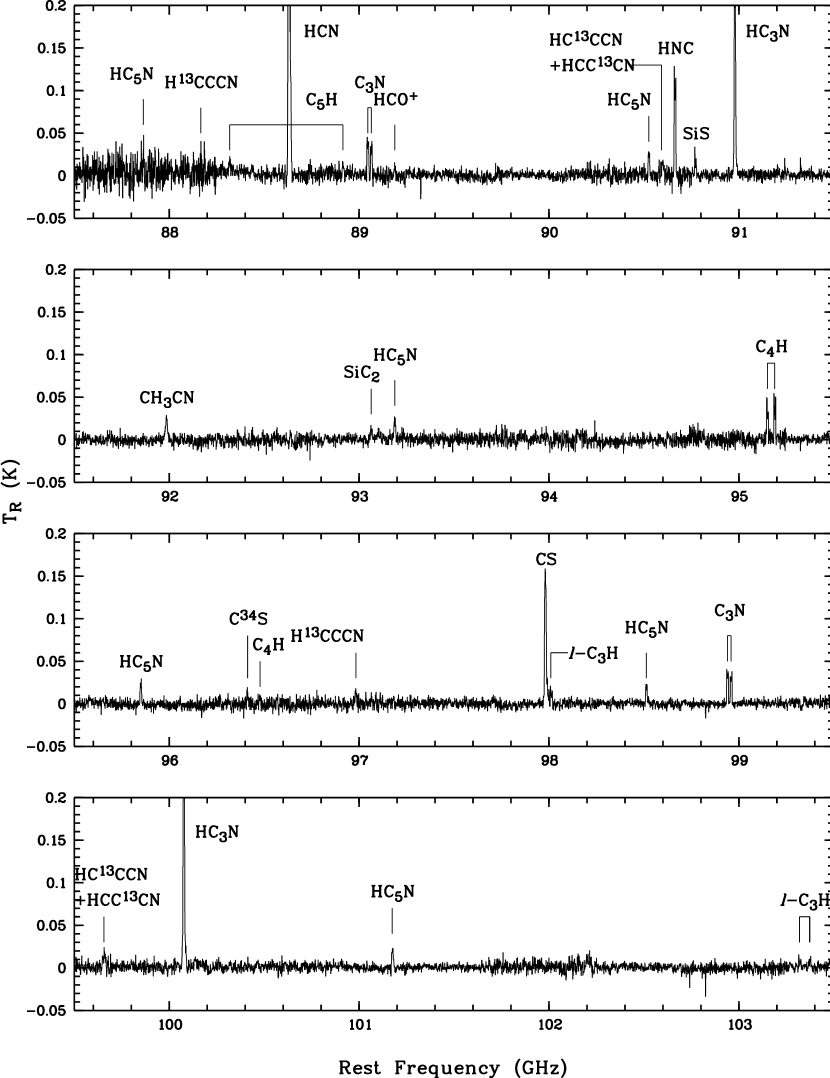
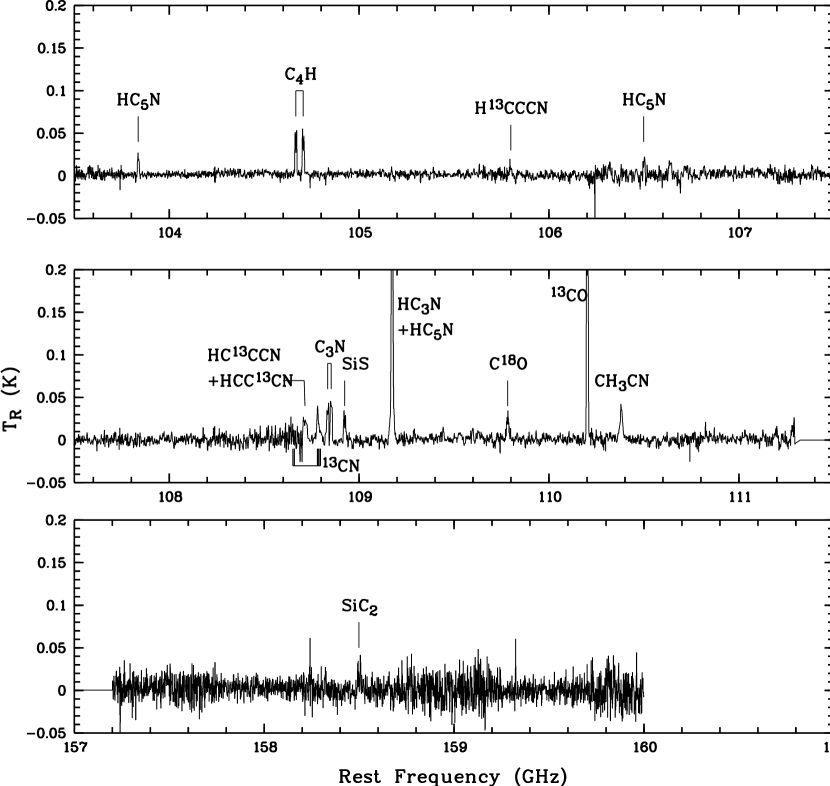
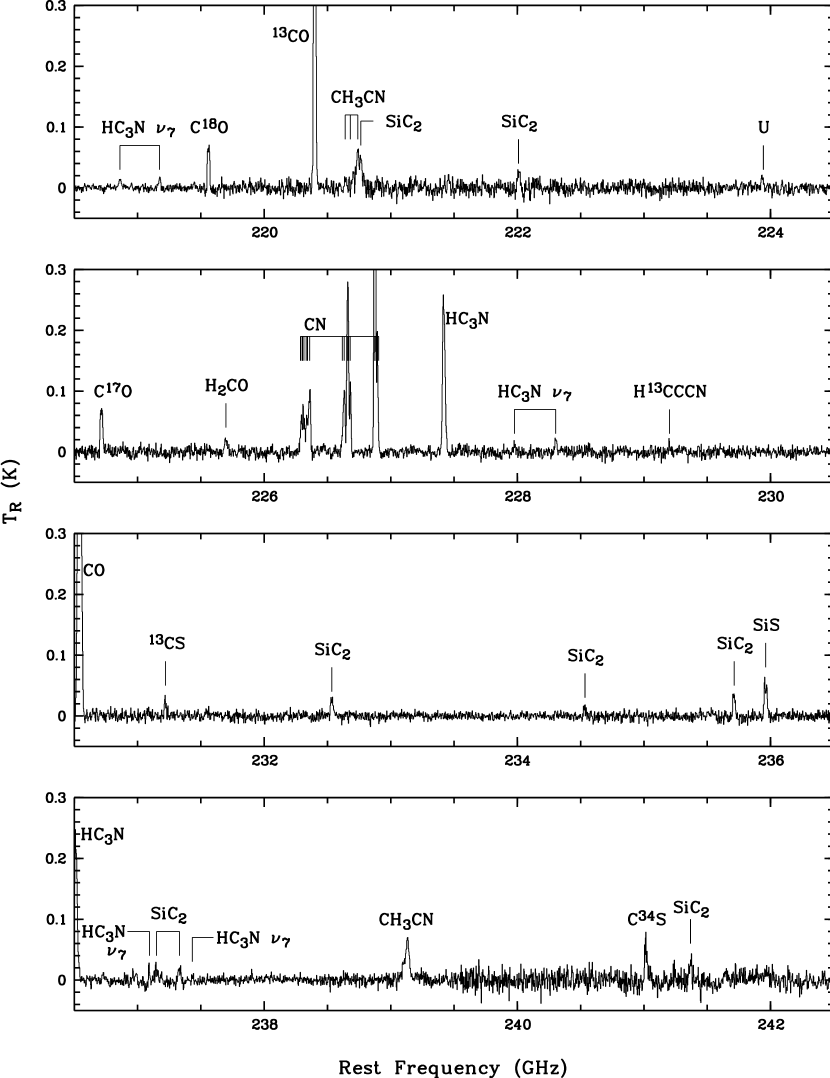
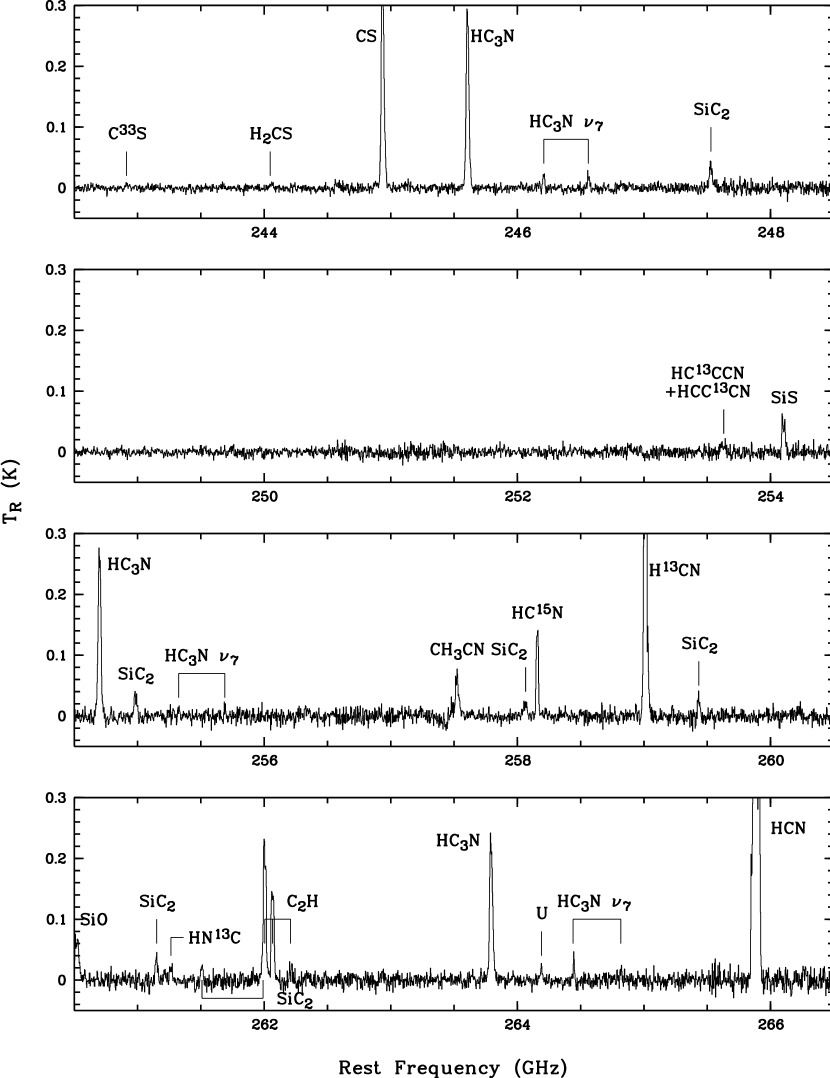
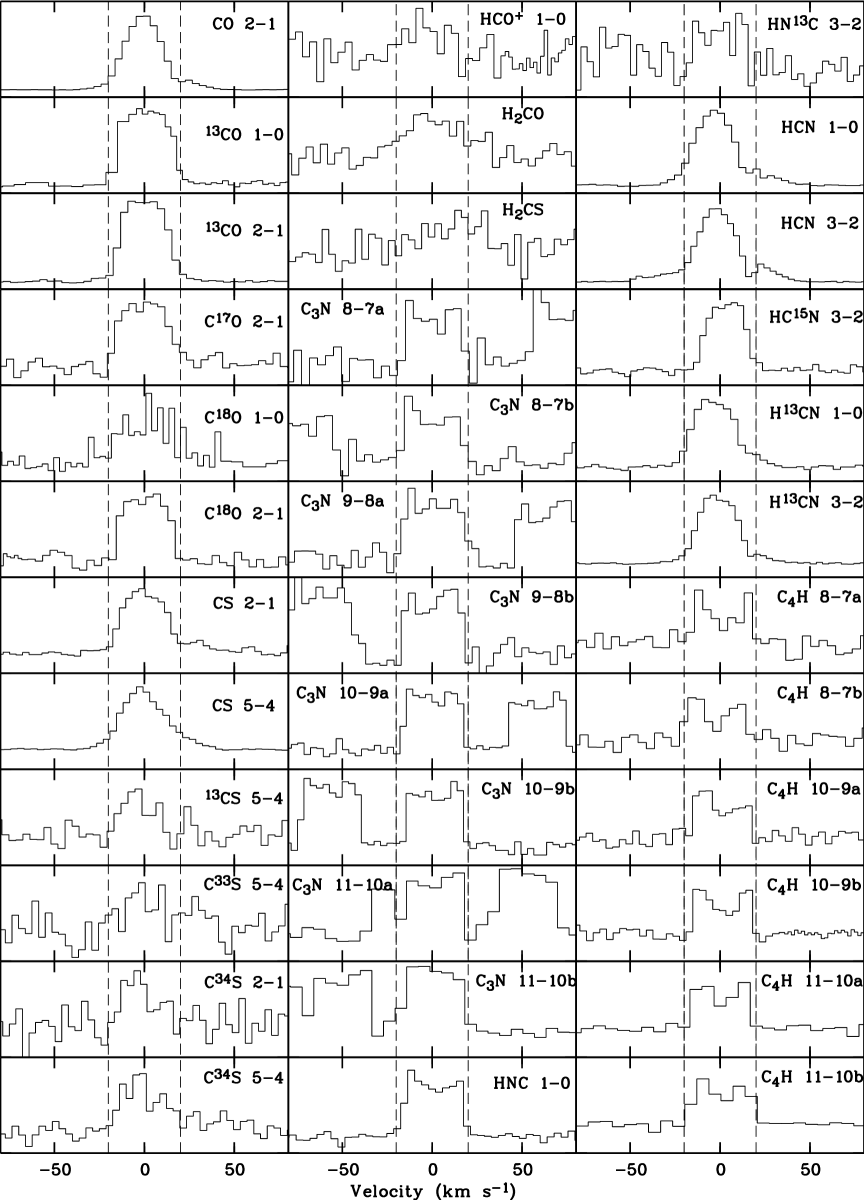
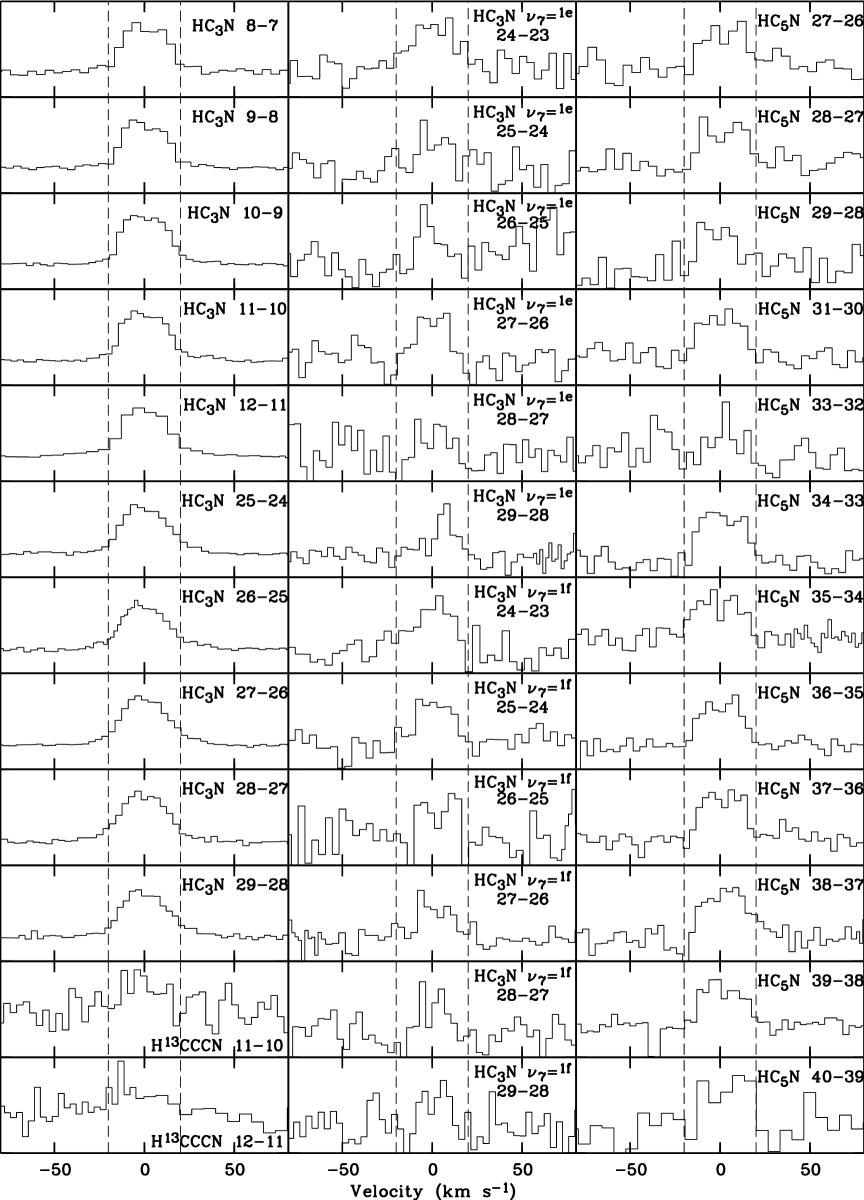
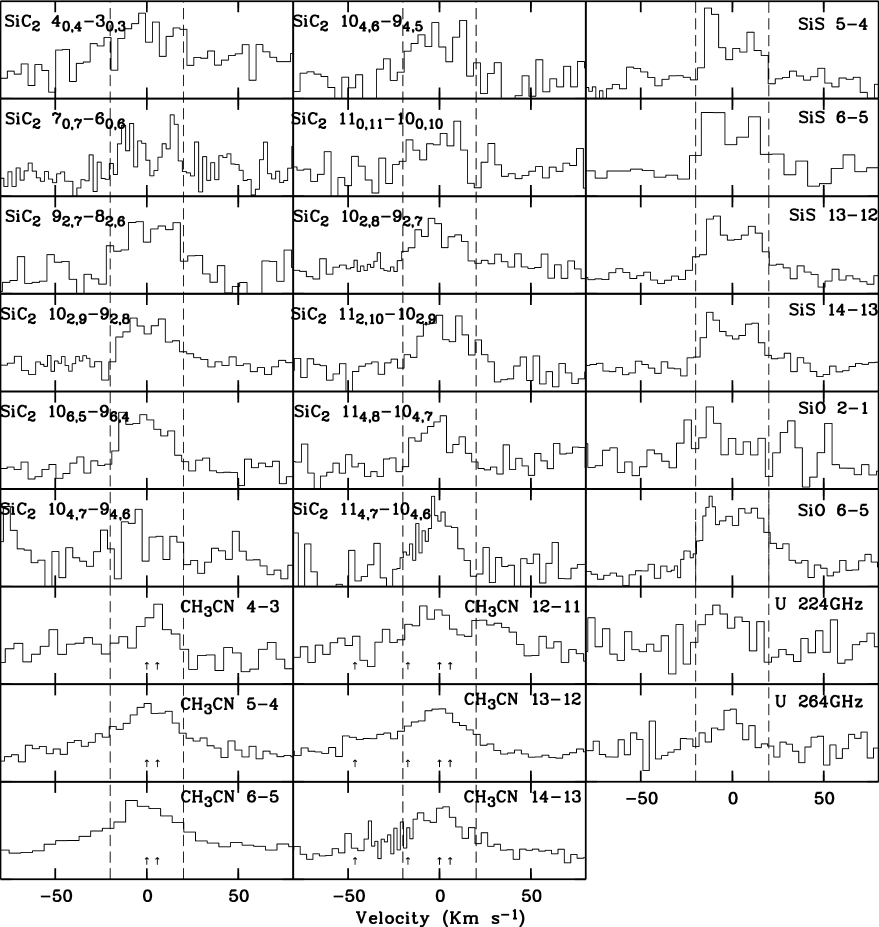
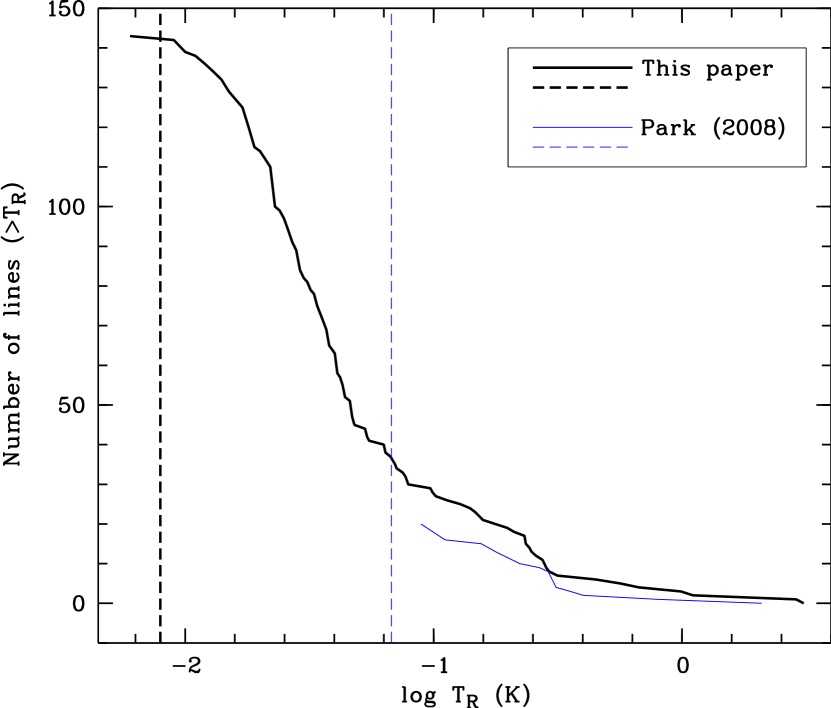
The 3 mm and 1.3 mm overall spectra are shown in Fig. 1 with the strong lines identified. More detailed spectra with expanded frequency scales for the 3 mm and 1.3 mm observations are shown in Fig. 2 and 3, respectively, with identified lines marked in the spectra. Complete data of the spectra are available in the on-line version of the Journal. Figures 4 shows the individual line profiles in velocity units. Including uncertain detections, we detected a total of 143 lines (or groups of lines) belonging to 19 different molecular species and 13 isotopologues. For the line detections, we have carefully examined the spectra to eliminate artifacts near the band edge. Although some lines are faint (with intensities lower than 3 noise level), we still consider them as real or tentative detections because other transitions from the same species are clearly detected in this object or they have been commonly observed in other evolved stars. Most lines lie well within km s-1 of the central velocity. Unlike AFGL 618, no line is found to show P Cygni profiles. Except SiS and SiO, all the observed molecules contain carbon. The line density is about 1.6 lines per GHz for both spectra. Figure 5 shows the cumulative number of detected lines exceeding a given main beam temperature. For comparison, we have also included the results from Park et al. (2008) in Figure 5. We can see that many more lines are detected in the present work because of higher sensitivity and/or wider frequency range coverage. The line identifications were made using the JPL (Pickett et al., 1998), CDMS (Müller et al., 2001, 2005), and LOVAS (Lovas, 1992) spectral line databases. To confirm our identifications, we checked the presence of other transitions of the same species at other frequencies, and compared the identifications with those from previous observations of other sources (Cernicharo et al., 2000; Pardo et al., 2007; He et al., 2008). We can confidently identify all the features, except two lines at 233.938 GHz and 264.191 GHz. Although these lines are close to the HC13CCCCN (85–84) line at 223.937 GHz and the Si13CC (151,14–151,15) line at 264.190 GHz, we do not make the association as the other transitions of HC13CCCCN and Si13CC are not detected. Table 1 lists the line identification as well as the integrated line intensities (d). The overall spectral properties are similar to that of IRC+10216. No new species are detected in AFGL 2688 beyond those seen in IRC+10216 and most of the non-detections could be due to the larger distance of AFGL 2688 compared to IRC+10216.
3.1 Individual molecules
3.1.1 CO
The –1 transitions of CO, 13CO, C17O, and C18O as well as the –0 transitions of C17O and C18O were detected. Interferometric observations of the 13CO (1–0) line have revealed three components: a bright central core with an expansion velocity of 19.6 km s-1, extensions with clumpy structure, and a high-velocity component (Yamamura et al., 1995). The high angular resolution map of Cox et al. (2000) shows that the CO (2–1) emission originates mostly from a central core with a diameter of 4″and multiple collimated outflows. As shown in Figure 4, the CO line has a parabolic shape, suggesting that it is optically thick. There is a weak absorption feature at the blue wing ( km s-1), which is presumably caused by cold foreground gas in the optically dark lane at the center. Showing rectangular or double-peak profiles, the isotopologue lines are less optically thick. Using the IRAM telescope, Truong-Bach et al. (1990) obtained the main-beam brightness temperature of the CO (1–0) line to be about 15 K at the center. Considering the different beam sizes (12″ for the IRAM observation), their measurement is consistent with ours. The integrated-intensity ratio of the CO and 13CO (2–1) lines is 4.07, in good agreement with that of the –0 transitions (4.76) obtained by Park et al. (2008).
3.1.2 CS
The –1 and –4 transitions of CS were detected in the 2 mm and 1.3 mm windows, respectively. We also detected the isotopic transitions of 13CS, C33S, and C34S. The C33S emission is, however, extremely faint and its detection is only marginal. Kasuga et al. (1997) mapped the CS (2–1) line and found its emission peaking at both sides of the central dark lane, probably as the result of enhancement of CS abundance by shock. They obtained a peak flux density of 4.5 Jy, in good agreement with our observation (4.7 Jy). Figure 4 shows that both CS (2–1) and (5–4) lines are optically thick. The absorption feature observed in the blue wing of the CO (2–1) line is also present in the CS (2–1) line, but not seen in the higher transitions. We obtained the integrated intensity ratios of (12CS 5–4)/(13CS 5–4) and (C32S 5–4)/(C34S 5–4), respectively, representing the lower limits to the 12C/13C and 32S/32S abundance ratios.
3.1.3 CN
The cyanogen radical (CN) has one unpaired electron which splits the rotational states into doublets, each of which is split into hyperfine components because of the nuclear spin () of the N nucleus (Kwok 2007, section 7.10). Three –1 fine-structure groups (–3/2, –1/2, and –3/2) of CN were clearly detected in the 1.3 mm window. The strongest two groups have been detected by Bachiller et al. (1997a). We also observed two –0 groups (–1/2, –1/2) of 13CN in the 3 mm window. The –1 groups are split into 18 hyperfine structure components, and can serve as a useful probe of the optical depth of molecular gas (Bachiller et al., 1997b). Under the assumption of optically thin and local thermodynamic equilibrium (LTE) conditions, the intrinsic integrated intensity ratio between the three CN groups are and , which are larger than the measured values of 1.4 and 1.7. Therefore, the two strongest CN groups are likely to have a large opacity.
3.1.4 C3N and CnH (–)
We detected four pairs C3N transitions and three pairs of C4H transitions from –7 to –10 in the 3 mm window. The C4H (9–8) transition at 85.6 GHz unfortunately falls within a spectral region with a high noise level. A vibrationally excited line of C4H was marginally detected. Each rotational transition of C3N and C4H is split into two components with a similar intensity because of fine-structure interactions. The C3N (9–8) and C4H (10–9) lines have been observed by Lucas et al. (1986) and Fukasaku et al. (1994). Considering different beam sizes, their intensity measurements are consistent with ours. The spectra of C3N and C4H show an optically thin and resolved emission with an U-shaped profile (Figure 4).
Five C4H transitions from –23 to –27 fall within the 1.3 mm window and are relatively strong in IRC+10216 (He et al., 2008). Although this molecular radical appears to be more abundant in AFGL 2688 than in IRC+10216 (Lucas et al., 1986; Fukasaku et al., 1994), none of these higher- transitions was detected in our spectra. This probably implies that the C4H emission region of AFGL 2688 is much colder than that of IRC+10216. The first detection of ethynyl radical (C2H) in AFGL 2688 was reported by (Huggins et al., 1984). There are fine-structure groups (–0 and –2) of C2H lying within the frequency range of our line survey. Both of them were clearly detected. The propynylidyne radical (C3H) can be linear () or cyclic () form. Although faint, three blended features from the state of C3H were clearly detected in the 1.3 mm window. C3H is higher in energy and less stable than C3H. The strongest C3H features lying within the 3 mm band are the 5(1,4)–4(1,3) transitions at 252.7 GHz and 252.9 GHz, which were not detected. We also detected two faint features belonging to the and states of the pentadiynylidyne radical (C5H) in the 1.3 mm window.
3.1.5 HNC
The 1–0 transition of HNC was clearly detected in the 3 mm window. The other HNC transitions lie outside the frequency range of our survey. The 1–0 and 3–2 transitions of its isotopologue HN13C fall within the spectral range. We detected the 3–2 transition in the 1.3 mm window. The 1–0 transition in the 3 mm window is overwhelmed by noise. Park et al. (2008) suggested that the HNC (1–0) line is optically thick with a parabolic shape. However, the present more sensitive observations showed that the HNC emission is optically thin with a well-defined U-shaped profile (Figure 4).
3.1.6 HC2n+1N (–)
The 1–0 and 3–2 transitions of HCN and its isotopologues H13CN and HC15N are strong lines in AFGL 2688. Bieging & Nguyen-Quang-Rieu (1988) mapped the HCN (1–0) line and found that the HCN emission is greatly enhanced in the optically dark lane and is not seen in the bipolar lobes, indicating a toroidal density distribution of this molecule. In our spectral survey, the HCN (3–2) and CO (2–1) lines have comparable intensities and are the strongest lines in the spectrum. As shown in Figure 4, the profiles of HCN lines closely resemble to that of the CO line, showing an optically thick parabolic shape with an absorption feature at the blue wing. The profiles of isotopologue transitions appear more rectangular and are partially optically thin. The integrated intensity ratio of H12CN to H13CN is (H12CN 1–0)/(H13CN 1–0) and (H12CN 3–2)/(H13CN 3–2), suggesting that the higher- transition of H13CN is less optically thick.
Ten transitions in the ground vibrational state of HC3N from –7 to –28 lie in the frequency range of our survey. All of them were prominently detected with mK. We also detected 12 vibrationally excited lines of HC3N and 10 transitions of the isotopologues H13CCCN, HC13CCN, and HCC13CN. Figure 4 shows that these vibrationally excited lines have relatively narrow profiles, suggesting that they probably originate from inner warm regions. To the best of our knowledge, only lower transitions of HC3N in the 3 mm window have been detected in previous studies (e.g. Fukasaku et al., 1994; Park et al., 2008). The current detections of HC3N transitions from levels covering a wider energy range allow us to more accurately derive physical conditions of the envelope.
The integrated intensity ratios of HC3N to H13CCCN increase with increasing values, ranging from 11.8 for the –8 transitions to 38.4 for the –25. This is presumably ascribed to the effect of optical depth.
There are 15 HC5N transitions from –27 to –40 in the frequency range of our survey. Except the –40 transition which is badly blended with a HCN line, all of them were detected in our spectra. Figure 4 shows that the shape is more parabolic with the center part being quite flat, without the sharp edges typical of optically thin lines from expanding envelope. The HCN (5-4) line observed with the VLA shows that the line is close to optically thick, with depression near systemic velocity due to the disruption of the HC3N hollow shell by the collimated outflows (Dinh-V-Trung & Lim, 2009).
3.1.7 CH3CN
We report the first detection of methyl cyanide (CH3CN) in AFGL 2688. Previously, the CH3CN (1–0) transition has been searched for but only upper limits were reported (Matthews & Sears, 1983). Because of centrifugal distortion, each of the rotational transition of CH3CN is split into different lines (Kwok 2007, section 7.8.2). In the spectral range covered by our survey, there are a total of six groups consisting of 24 transitions from –3 to –13. All of them were evidently detected in spite of relatively weak in intensities.
3.1.8 H2CO and H2CS
We detected a H2CO transition (–21,1) that is only marginally above the noise level. It is the strongest H2CO line within the frequency range of our survey. We report a tentative detection of a H2CS transition (71,6–61,5). Both transitions were detected in the 1.3 mm band with SMT, which provides a high sensitivity. This is the first detection of H2CO and H2CS in this object.
3.1.9 HCO+
As far as we know, there is no previous report on the detection of ionized species in AFGL 2688. The 1–0 transition of the molecular ion HCO+ was previously searched for in AFGL 2688, but only upper limits of 0.1 K in main beam temperature were obtained (Zuckerman et al., 1976; Bachiller et al., 1997b). Here we present the first tentative detection of this species. A weak peak at 89.2 GHz is clearly visible in the 3 mm window, and can be tentatively assigned to the HCO+ 1–0 line.
3.1.10 SiS, SiO, and SiC2
In AFGL 2688, lines from Si-bearing compounds are generally much fainter than those from C-bearing compounds. The SiS (5–4) transition was first detected in AFGL 2688 by Fukasaku et al. (1994), but the line was not detected by Park et al. (2008). Four SiS transitions from –4 to –13 are in the frequency range of our survey. All of them were detected with well-defined profiles. We also detected the –1 and –5 transitions of SiO. The U-shaped profiles, as shown in Figure 4, indicate that these SiS and SiO lines are optically thin.
SiC2 is a triangular ring molecule and the SiC2 (6–5) transition was detected in AFGL 2688 by Bachiller et al. (1997b). Our observations revealed a total of 21 SiC2 transitions from –3 to –11. Emission lines from this refractory molecule are relatively faint, and most of them have less well defined profiles, but the strongest SiC2 line shows a double-peak profile.
3.2 Comparison with Park et al. (2008)
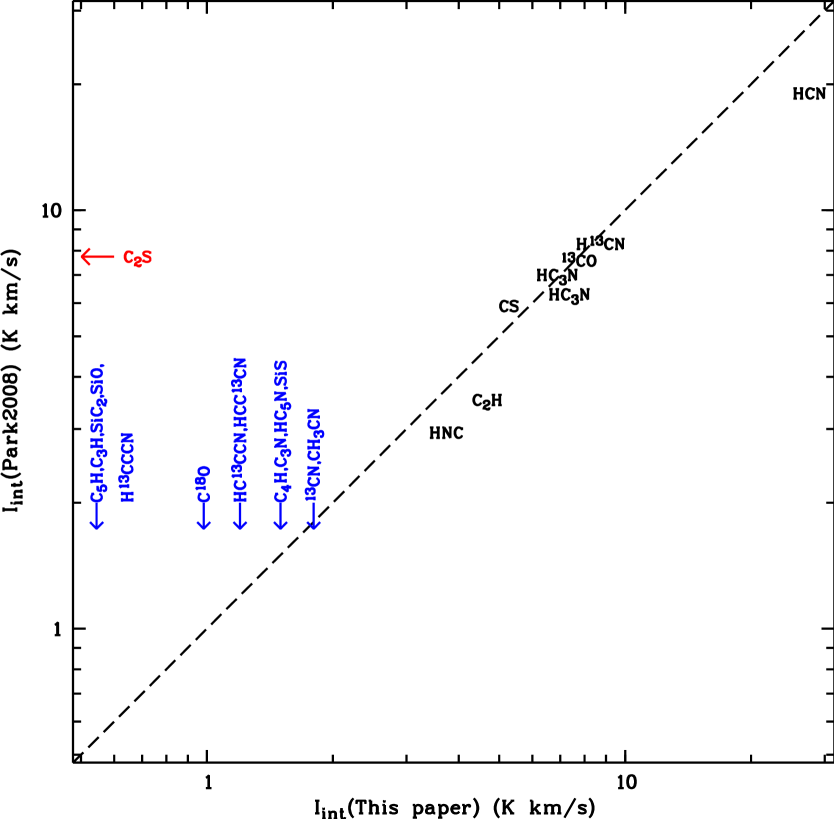
The mm spectral line survey of Park et al. (2008) resulted in the detections of eight molecules in AFGL 2688. As illustrated in Figure 5, our spectra are about one order of magnitude deeper and are therefore able to reveal 5 times more lines than theirs. There is an overlapping frequency range (85–111 GHz) between the survey of Park et al. (2008) and ours. In Figure 6, we compare the integrated intensities of the lines detected in the overlapping region. Because the beam sizes of the two observations are similar, we do not correct for the effect of beam dilution. Inspection of Figure 6 shows that the intensities of the lines detected in the two observations are in excellent agreement. Our observations detected all the species in those of Park et al. (2008), except C2S (shown in red). There are 14 molecules detected in our survey (shown in blue) that were not detected by Park et al. (2008).
Park et al. (2008) claimed the first detection of C2S in AFGL 2688 through one transition (–7). The intensity of this C2S line given by Park et al. (2008) is well above our detection limit. However, we did not detect this line with a 3 upper limit of 0.01 K. Furthermore, Park et al. (2008) did not detect the –6 and –8 transitions of C2S which also lie in the frequency range of their survey and have comparable strengths to the –7 line in IRC+10216 (Cernicharo et al., 1987). Therefore, we suspect that this detection is not real, and C2S cannot be detected in this object at the present sensitivity level.
3.3 Rotation temperatures, column densities, and fractional abundances
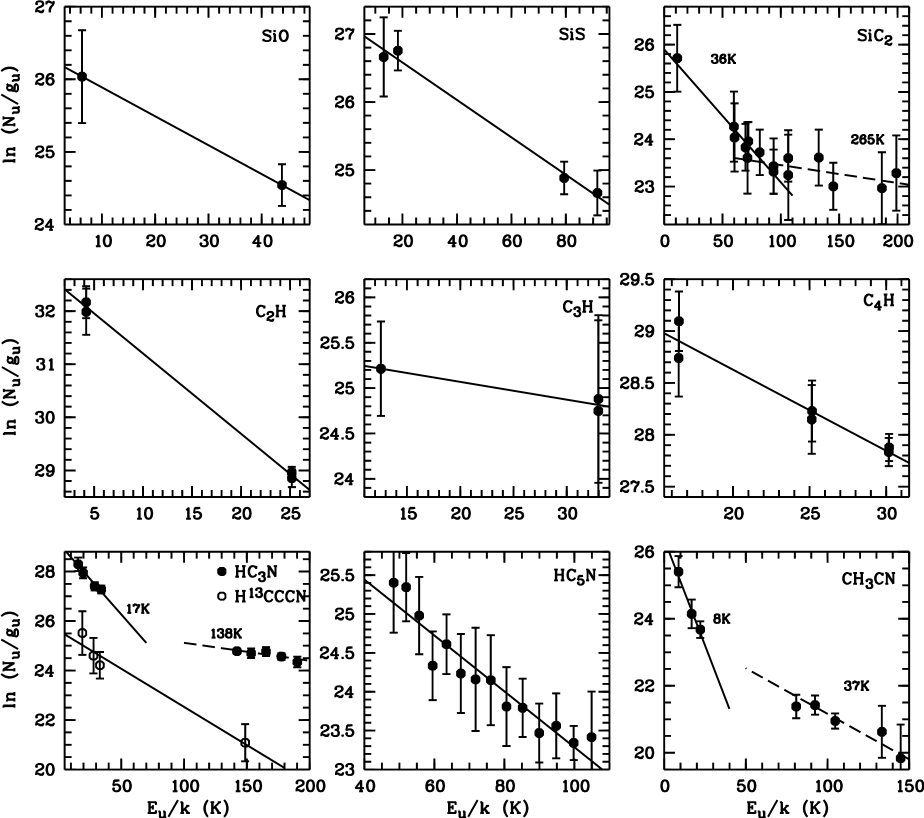
We have applied the rotation-diagram technique to derive the excitation temperatures () and column densities () of the molecules detected in our spectra, assuming LTE, optically thin condition and negligible background temperature. In Figure 7, we have plotted the populations of the upper levels () against the corresponding excitation energies () in the transitions, using the equation,
| (1) |
where is the degeneracy of the upper level, the line strength, the dipole moment, the line frequency, the rotational partition function, and the Boltzmann constant. Assuming that the surface brightness has a Gaussian distribution, the source brightness temperature is given by , where is the antenna HPBW and is source size. The value may be different for different molecules, and is poorly known for most of the species. We followed the assumption by Park et al. (2008) as well as Fukasaku et al. (1994) and took an uniform of for all the species. This assumption leads to a factor of two uncertainty in . If a given molecule has more than one transition detected, its and can be deduced using a straight-line fit to versus . When more transitions are detected, the results are more reliable. Departure from the linear relation may imply non-LTE excitation, different excitation mechanisms, effect of optical thickness, misidentification, and/or line blending. The effects of saturation and subthermal excitation on the rotation diagram have been extensively discussed by Goldsmith & Langer (1999). Since our present survey covers a wide frequency range and our detections include molecular transitions arising from energy levels over a wide energy range, the rotational diagram analysis can be particularly useful.
The rotation diagrams for ten molecules detected in our survey are shown in Figure 7. The derived values of and are given in Table 2, together with the results by Fukasaku et al. (1994) and those of IRC+10216 (He et al., 2008) for comparison. may be different from species to species. Generally, there are good linear relationships between and . Nevertheless, some molecules (i.e. SiC2, HC3N, and CH3CN) appear to arise from regions with temperature variations. The average of HC3N is 46.1 K, higher than the 25.8 K value obtained by Park et al. (2008) using only mm data. Figure 7 clearly shows that the higher- transitions of HC3N have a higher . HC5N transitions were detected only in the 3 mm band and have a low value of 27.8 K, in good agreement with the that of HC3N deduced by Park et al. (2008). This implies that the cyanopolyynes coexist in the same regions. The deduced column densities are in order-of-magnitude agreement with the results of Fukasaku et al. (1994). Goldsmith & Langer (1999) suggested that finite opitical depth can cause deviations of the points from a straight line on the rotation diagram, and an optical correction factor should be introduced in the rotation diagram. However, using the “population diagram” technique presented by Goldsmith & Langer (1999), we found that the values for all the species in Figure 7 are too small () to affect our results.
We also calculated the fractional abundances () of the detected molecules relative to H2 using the formula proposed by Olofsson (1996). A detailed explanation of the method can be found in Zhang et al. (2009b). The deduced values and those normalized to HC3N are given by Table 2, where the results for IRC+10216 and AFGL 618 (Woods et al., 2003; Pardo & Cernicharo, 2007) are listed for comparison. It should bear in mind that the calculations were based on assumed mass-loss rate, distance, and geometry of the shell, which are not well known. We estimate that the error of amounts to a factor of 5. Nevertheless, when comparing the relative between detected molecules, the uncertainties invoked by these assumed parameters can be greatly reduced.
3.4 Isotopic ratios
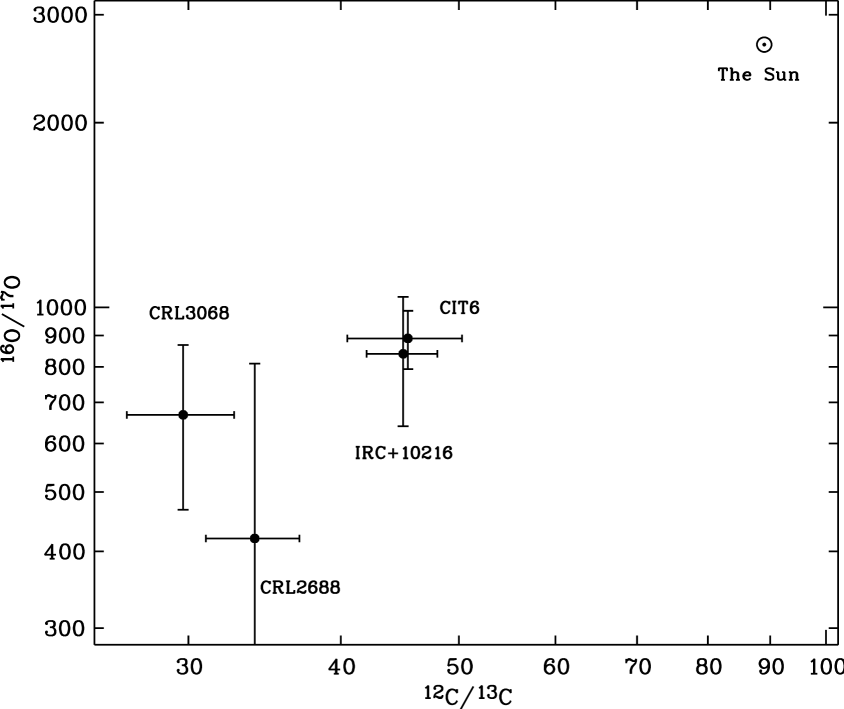
The circumstellar envelopes of evolved stars are constantly replenished by products of nucleosynthesis in the stellar interior. As a star evolves, changes of nuclear process changes lead to changing isotopic compositions, which are eventually reflected in the composition of the CSE. The isotopic ratios in the CSE of IRC+10216 have been obtained by several groups (i.e. Wannier et al., 1991; Kahane et al., 2000). These studies suggest that the 12C/13C, 16O/17O, and 18O/17O ratios are lower compared to the solar values, while the 14N/15N ratio is more than 10 times larger than solar. The 16O/18O ratio and those of heavier elements are consistent with the solar values. We have determined the isotopic ratios of C, N, O, and S in AFGL 2688 through the same transitions of molecules and their isotopologues. The calculations are based on the assumptions that the main and isotopic lines are optically thin and the lines are under the same excitation conditions. The results, along with those of IRC+10216 and the Sun, are presented in Table 3. The main lines of CO, HCN, and CS are optically thick, and thus only give the lower limits of the corresponding isotopic ratios.
We have detected the rare species 12C34S and 13C32S. The 12C34S/13C32S ratio is . Assuming the that 32S/34S ratio is solar, we obtained 12C/13C. 12C/13C can also be obtained through the HC3N and isotopic lines which are likely to be optically thin. A comparison the two results suggests a 12C/13C ratio of 31–37, slightly lower than that of IRC+10216 and significantly lower than the solar value. We note that the results obtained by previous authors scatter over a wide range of 20–66 (see Milam et al., 2009). The low 12C/13C ratio is typical for carbon-rich CSEs and is suggestive of the existence of a nonstandard mixing mechanism (or cool bottom processing; e.g., Charbonnel, 1995) during the red giant phase of low-mass AGB stars. A more detailed discussion about the implications of 12C/13C for AGB nucleosynthesis can be found in Milam et al. (2009).
Although not strictly true, the derived 16O/17O abundance ratio is expected to be positively correlated with that of 12C/13C since both 13C and 17O are produced by 12C and 16O through () reactions followed by decay. Assuming that the 13CO and C16O lines are optically thin and the 12C/13C ratio is smaller than the solar value, we derive a 16O/17O ratio of 810 in AFGL 2688, or at least three times smaller than the solar value.
From the –1 transitions of C18O and C17O, we obtain an 18O/17O ratio of , a value consistent with that in IRC+10216 and significantly lower than the solar value, suggesting that 17O in this object has been substantially enhanced. Combining the present data with those of other CSEs previously reported by us (He et al., 2008; Zhang et al., 2009a, b), we can clearly see a positive correlation between 16O/17O and 12C/13C ratios (Figure 8).
On the other hand, 13C and 17O can be destroyed by the reactions 13C()14N and 17O()14N. Both paths lead to the overproduction of 14N. The enhancement of 14N in carbon-rich CSEs has been confirmed by the observations of Wannier et al. (1991), who obtained a lower limit of 544 for the 14N/15N ratio in AFGL 2688, about twice higher than the solar value. Assuming that the 3–2 transitions of H12C14N and H13C15N are optically thin and the 12C/13C is smaller than the solar value, we obtained an upper limit for 14N/15N of 751, about 6 times lower than the lower limit in IRC+10216. The lower 14N/15N value in AFGL 2688 may be related to the slightly lower 12C/13C and 16O/17O ratios than those in IRC+10216 (Figure 8), suggesting that the two objects probably have different intrinsic properties, such as metallicity and mass.
The nucleosynthesis of sulfur isotopes 33S and 34S requires relatively high temperatures, which are are unlikely to be achieved in the interior of intermediate- and low- mass stars. This is supported by our results that no discrepancy between the S isotopic ratios in AFGL 2688 and the solar values is found.
4 Discussion
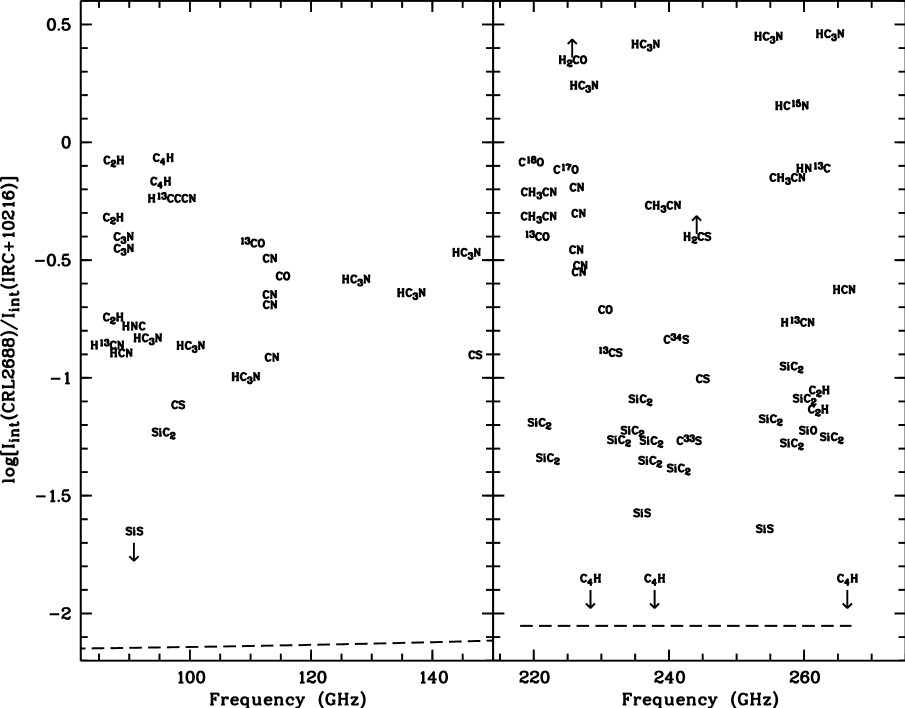
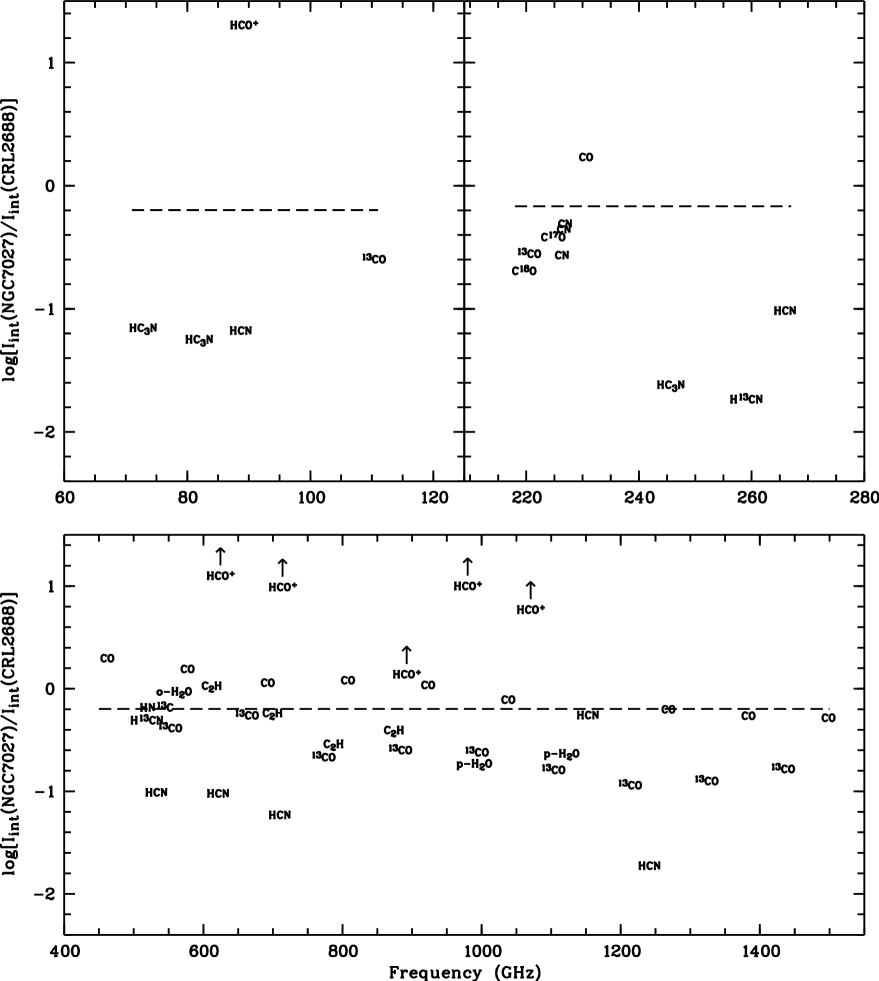
In order to investigate the chemical evolution of circumstellar envelopes during the AGB–PPN–PN transitions, we have plotted the integrated-intensity ratios of the molecular lines in AFGL 2688, IRC+10216 and NGC 7027 in Figures 9 and 10, respectively. The (AFGL2688)/(IRC+10216) and (NGC7027)/(AFGL2688) ratios of the lines from the molecular species X [respectively represented as (X) and (X) hereafter] can, to some extent, reflect the relative abundance of X in these objects. Although line intensity ratios can be affected by factors in addition to molecular abundance, such as different excitation conditions and optical depths, these effects can be substantially reduced by comparing lines arising from different levels. Therefore, our observations covering a wide frequency range are particularly suited for such a study. Our results show that (X) ranges from 0.02 to 2.89 with a mean value of 0.41, while (X) ranges from 0.02 to 20.2 with a mean value of 1.64. Generally, the chemical pattern of AFGL 2688 is more similar to that of IRC+10216 compared to NGC 7027, suggesting that the radiation field from the central star plays an important role on circumstellar chemistry and can alter chemical composition over a short time scale.
IRC+10216 is the closest carbon-rich star (120 pc, Loup et al., 1993). NGC 7027 has a similar distance (880 pc, Masson, 1989) as AFGL 2688. If the three objects had nearly identical intrinsic brightness, the line intensities should be proportional to , as denoted by the dashed lines in Figures 9 and 10. We can infer from Figures 9 and 10 that the intrinsic molecular line strengths in AFGL 2688 and NGC 7027 are consistently at least one order of magnitude higher than those in IRC+10216 if they are at the same distance from the earth. This suggests that the detection of abundant molecular species in IRC+10216 is not so much because of its unique chemical nature, but its proximity. Furthermore, the degree of chemical activity has increased, not decreased, since the end of AGB.
Nevertheless, there are some differences in the molecular abundance of IRC+10216 and AFGL 2688. As shown in Figure 9, the abundance of CN-bearing molecules, such as HC3N and CH3CN, is enhanced in AFGL 2688. CN-bearing molecules have a chemical link with NH3, a molecule formed near the central star. Nguyen-Q-Rieu et al. (1984) found that the NH3 lines in AFGL 2688 are stronger than those in IRC+10216 by a factor of . Therefore, it can be inferred that the injection of NH3 during the AGB-to-PPN evolution enhances the production of CN-bearing molecules in AFGL 2688 through subsequent reactions. Figure 9 also indicates that Si-bearing molecules (SiS, SiO, and SiC2) appear to be depleted in AFGL 2688 with respect to IRC+10216, suggesting that the refractory species have partly condensed into dust grains. SiS appears to be more depleted than SiO and SiC2. This can be attributed to the fact that SiS has been converted into other silicon species in the outer envelope through gas-phase photochemical reactions. Detailed discussions about the chemistry of SiS and SiO in circumstellar envelopes have been given by other authors (e.g. Bachiller et al., 1997b; Schöier et al., 2006, 2007).
We also found that the H2CO line in AFGL 2688 is much stronger than that in IRC+10216. H2CO is known to be formed through the reaction between CO and H on grain surface, and can be further transformed into methanol. The H2CO line has a broader profile (see Figure 4) than the other molecular lines, probably implying it originates from an extended dust region. The detection of H2CO, therefore, suggests that grain surface chemistry may be actively processing molecular gas in this PPN. Based on their 3 mm observations, Lucas et al. (1986) found that the C4H radical seems enhanced in AFGL 2688 with respect to IRC+10216. However, this is not supported by our 1.3 mm observations, which do not reveal C4H lines (Figure 9). The strengths of C4H lines suggest that this species is located at a very cool region so that the low-N transitions are strengthened whereas the high-N transitions are strongly suppressed.
The central-star temperature of NGC 7027 is about 30 times higher than that of AFGL 2688. Figure 10 shows that most of neutral carbon chain molecules are destroyed during the evolution from PPN to PN, while HCO+ is enhanced by a factor of . This is consistent with previous findings (e.g. Cernicharo et al., 2011) and can be attributed to the chemistry activated by UV photons from the central star. The 12CO/13CO line ratios in NGC 7027 are larger than those in AFGL 2688, which can be attributed to decreasing optical depth as the result of nebular expansion.
5 Conclusions
Using the ARO 12 m and SMT 10 m telescopes, we have carried out a molecular-line survey of the PPN AFGL 2688 at the 3 mm and 1.3 mm windows. A total of 143 spectral lines corresponding to 32 molecular species and isotopologues were detected. Only two faint lines remain unidentified. Five molecules, namely C3H, CH3CN, H2CO, H2CS, and HCO+, are new detections in this object. The sensitive spectra show no evidence for the presence of C2S in AFGL 2688, contrary to the result of Park et al. (2008). We calculated the rotation temperature, the column densities and fractional abundances (or their lower-limits) of the identified molecules.
Using the observed line ratios of several molecules, we are able to determine the isotopic abundance ratios of several elements. The 12C/13C and 16O/17O ratios are typical of circumstellar envelopes of evolved stars, and are considerably lower than the solar values. The 14N/15N ratio in AFGL 2688 significantly differs from that in IRC+10216, probably reflecting different metallicities or/and masses of their progenitor stars.
By comparing the chemical compositions of AFGL 2688 with those of the AGB star IRC+10216 and the PN NGC 7027, we have come to the conclusion that AFGL 2688 and NGC 7027 have thicker molecular envelopes than IRC+10216. While the chemical patterns of AFGL 2688 and IRC+10216 are generally similar, we note that the chemistry in NGC 7027 is different, probably as the result of a drastically different radiation environment and photochemistry. Nevertheless, we do note that there are slight differences between the molecular line strengths in and AFGL 2688 and IRC+10216, providing evidence for chemical evolution during the AGB-to-PPN transition. Specially, CN-containing molecules are enhanced and refractory molecules are depleted as the result of stellar evolution.
While we are able to come to some useful conclusions on chemical evolution in the circumstellar environment, we do wish to note that the origin of chemical diversity in circumstellar envelopes can be complicted by a number of factors. The difference in molecular abundance can be the result of stellar evolution, metallicities, initial masses, mass-loss processes, dust properties, shock processes, morphological structures, interactions with the surrounding interstellar medium, just to name a few. In order to understand the roles of these various factors in circumstellar chemistry, it would be necessary to perform high-sensitivity spectral line survey of a large sample of evolved stars over wide frequency ranges. High angular resolution mapping of a large variety of lines would also be useful. We hope that this paper will provide the impetus of future work using larger facilities such as ALMA.
References
- Bachiller et al. (1997a) Bachiller, R., Fente, A., Bujarrabal, V. et al. 1997a, A&AS, 319, 235
- Bachiller et al. (1997b) Bachiller, R., Fente, A., Huggins, P. J., & Cox, P. 1997, A&AS, 324, 1123
- Balick et al. (2012) Balick B., Gomez T., Vinković D., Alcolea J., Corradi R. L. M., & Frank A., 2012, ApJ, 745, 188
- Bieging & Nguyen-Quang-Rieu (1988) Bieging, J. H., & Nguyen-Quang-Rieu, 1988, ApJ, 324, 516
- Cernicharo et al. (1987) Cernicharo, J., Guelin, M., Hein, H., & Kahane, C. 1987, A&A, 181, L9
- Cernicharo et al. (2011) Cernicharo, J., Agúndez, M. & Guélin, M. 2011, in IAU Symp. 280, The Molecular Universe, J. Cernicharo, & R. Bachiller (eds), ASP, p. 237
- Cernicharo et al. (2000) Cernicharo, J., Guélin, M., & Kahane, C. 2000, A&AS, 142, 181
- Cernicharo et al. (2001) Cernicharo, J., Heras, A. M., Tielens, A. G. G. M. et al. 2001, ApJ, 546, L123
- Cernicharo et al. (2010) Cernicharo, J., Waters, L. B. F. M., Decin, L., et al. 2010, A&A, 521, L8
- Charbonnel (1995) Charbonnel, C. 1995, ApJ, 453, L41
- Chau et al. (2012) Chau, W, Zhang, Y., Nakashima, J., Deguchi, S., & Kwok, S. 2012, ApJ, 760, 66
- Cohen & Kuhi (1977) Cohen, M., & Kuhi, L. V. 1977, ApJ, 213, 79
- Cox et al. (2000) Cox, P., Lucas, R., & Huggins, P. J. et al. 2000, A&A, 353, L25
- Dinh-V-Trung & Lim (2009) Dinh-V-Trung, & Lim, J. 2009, ApJ, 698, 439
- Fukasaku et al. (1994) Fukasaku, S., Hirahara, Y., Masuda, A. et al. 1994, ApJ, 437, 410
- Goldsmith & Langer (1999) Goldsmith, P. F. & Langer, W. 1999, ApJ, 517, 209
- He et al. (2008) He, J.-H., Dinh-V-Trung, Kwok, S. et al. 2008, ApJS, 177, 275
- Highberger et al. (2001) Highberger, J. L., Savage, C., Bieging, J. H., & Ziurys, L. M. 2001, ApJ, 562, 790
- Highberger et al. (2003) Highberger, J. L., Thomson, P. A., Young, P. A., Arnett, D., & Ziurys, L. M. 2003, ApJ, 593, 393
- Huggins et al. (1984) Huggins, P. J., Carlson, W. J., & Kinney, A. L. 1984, A&A, 133, 347
- Ishigaki et al. (2012) Ishigaki, M. N., Parthasarathy, M., & Reddy, B. E. et al. 2012, MNRAS, 425, 997
- Kahane et al. (2000) Kahane, C., Dufour, E., Busso, M., et al. 2000, A&A, 357, 669
- Kasuga et al. (1997) Kasuga, T., Yamamura, I., & Deguchi, S. A&A, 320, 575
- Kawaguchi et al. (1995) Kawaguchi, K., Kasai, Y., Ishikawa, S.-I., & Kaifu, N. 1995, PASJ, 47, 853
- Kwok (1993) Kwok, S. 1993, ARA&A, 31, 63
- Kwok (2007) Kwok, S. 2007, Physics and Chemistry of the Interstellar Medium, University Science Books
- Lo & Bechis (1976) Lo, K. Y., & Bechis, K. P. 1976, ApJ, 205, L21
- Lodders (2003) Lodders, K. 2003, ApJ, 591, 1220
- Loup et al. (1993) Loup, C., Forveille, T., Omont, A., & Paul, J. F. A&AS, 99, 291
- Lovas (1992) Lovas, F. J. 1992, J. Phys. Chem. Ref. Data, 21, 181
- Lucas et al. (1986) Lucas, R., Omont, A., Guilloteau, S., & Nguyen-Q-Rieu, 1986, A&A, 154, L12
- Masson (1989) Masson, C. R. 1989, ApJ, 336, 294
- Matthews & Sears (1983) Matthews, H., & Sears, T. J. 1983, ApJ, 267, L53
- Milam et al. (2008) Milam, S. N., Halfen, D. T., Tenenbaum, E., D., Apponi, A. J., Woolf, N. J., & Ziurys, L. M. 2008, ApJ, 684, 618
- Milam et al. (2009) Milam, S. N., Woolf, N. J., & Ziurys, L. M. 2009, ApJ, 690, 837
- Müller et al. (2001) Müller, H. S. P., Thorwirth, S., Roth, D. A., & Winnewisser, G. 2001, A&A, 370, L49
- Müller et al. (2005) Müller, H. S. P., Schlöder, F., Stutzki, J., & Winnewisser, G. 2005, J. Mol. Struct., 742, 215
- Ney et al. (1975) Ney, E. P., Merrill, K. M., Becklin, E. E., Neugebauer, G., & Wynn-Williams, C. G. 1975, apj, 330, 374
- Nguyen-Q-Rieu et al. (1984) Nguyen-Q-Rieu, Graham, D., & Bujarrabal, V. 1984 A&A, 138, L5
- Olofsson (1996) Olofsson, H. 1996, in IAU Symp. 178, Molecules in Astrophysics: Probes & Processes, E. van Dishoeck (ed), Dordrecht: Kluwer, p. 457
- Pardo & Cernicharo (2007) Pardo, J. R., & Cernicharo, J. 2007, ApJ, 654, 978
- Pardo et al. (2007) Pardo, J. R., Cernicharo, J., Goicoechea, J. R., Gu’elin, M., & Ramos, A. A. 2007, ApJ, 661, 250
- Park et al. (2008) Park, J. A., Cho, S.-H., Lee, C. W., & Yang, J. 2008, AJ, 136, 2350
- Patel et al. (2011) Patel, N. A., Young, K. H., Gottlieb, C. A., et al. 2011, ApJS, 193, 17
- Pickett et al. (1998) Pickett, H. M., Poynter, R. L., Cohen, E. A., Delitsky, M. L., Pearson, J. C., & Muller, H. S. P. 1998, J. Quant. Spectrosc. & Rad. Transfer, 60, 883
- Sahai et al. (1998a) Sahai, R., Hines, D. C., & Kastner, J. H. et al. 1998a, ApJ, 492, L163
- Sahai et al. (1998b) Sahai, R., Trauger, J. T., & Watson, A. M. et al. 1998b, ApJ, 493, 301
- Schöier et al. (2006) Schöier, F. L., Olofsson, H., & Lundgren, A. A. 2006, A&A, 454, 247
- Schöier et al. (2007) Schöier, F. L., Bast, J., Olofsson, H., & Lindqvist, M. 2007, A&A, 473, 871
- Tenenbaum & Ziurys (2008) Tenenbaum, E. D., & Ziurys, L. M. 2008, ApJ, 680, L121
- Truong-Bach et al. (1990) Truong-Bach, Nguyen-Q-Rieu, Morris, D., & Deguchi, S. 1990, A&A, 230, 431
- Ueta et al. (2006) Ueta, T., Murakawa, K., & Meixner, M. 2006, ApJ, 641, 1113
- Wannier et al. (1991) Wannier, P. G., Andersson, B.-G., Olofsson, H., & Young, K. 1991, ApJ, 380, 593
- Wesson et al. (2010) Wesson, R., Cernicharo, J., Barlow, M. J. et al. 2010, A&A, 518, L144
- Woods et al. (2005) Woods, P. M., Nyman, L.-Å, Schöier, F. L., Zijlstra, A. A., Millar, T. J., & Olofsson, H. 2005, A&A, 429, 977
- Woods et al. (2003) Woods, P. M., Schöier, F. L., Nyman, L.-Å, & Olofsson, H. 2003, A&A, 402, 617
- Yamamura et al. (1995) Yamamura, I., Onaka, T., Kamijo, F., Deguchi, S., & Ukita, N. 1995, ApJ, 439, L13
- Zhang et al. (2008) Zhang, Y., Kwok, S., & Dinh, V. T. 2008, ApJ, 687, 328
- Zhang et al. (2009a) Zhang, Y., Kwok, S., & Dinh, V. T. 2009a, ApJ, 691, 1660
- Zhang et al. (2009b) Zhang, Y., Kwok, S., & Nakashima, J. 2009b, ApJ, 700, 1262
- Ziurys et al. (2007) Ziurys, L. M., Milam, S. N., Apponi, A. J., & Woolf, N. J. 2007, Nature, 447, 1094
- Zuckerman et al. (1976) Zuckerman, B., Gilra, D. P., Turner, B. E., Morris, & Palmer, P. 1976, ApJ, 205, L15
| Frequency | Species | Transition | rms | d | Note | |
|---|---|---|---|---|---|---|
| (MHz) | (upper–lower) | (mK) | (K) | (K km/s) | ||
| 226287.4 | CN | N(J,F)=2(3/2,1/2)–1(3/2,1/2) | 6.2 | 0.078 | 2.860 | |
| 226298.9 | CN | N(J,F)=2(3/2,1/2)–1(3/2,3/2) | — | — | — | |
| 226303.0 | CN | N(J,F)=2(3/2,3/2)–1(3/2,1/2) | — | — | — | |
| 226314.5 | CN | N(J,F)=2(3/2,3/2)–1(3/2,3/2) | — | — | — | |
| 226332.5 | CN | N(J,F)=2(3/2,3/2)–1(3/2,5/2) | 6.2 | 0.102 | 3.693 | |
| 226341.9 | CN | N(J,F)=2(3/2,5/2)–1(3/2,3/2) | — | — | — | |
| 226359.9 | CN | N(J,F)=2(3/2,5/2)–1(3/2,5/2) | — | — | — | |
| 226616.6 | CN | N(J,F)=2(3/2,1/2)–1(1/2,3/2) | 5.4 | 0.099 | 2.756 | |
| 226632.2 | CN | N(J,F)=2(3/2,3/2)–1(1/2,3/2) | — | — | — | |
| 226659.6 | CN | N(J,F)=2(3/2,5/2)–1(1/2,3/2) | 5.4 | 0.279 | 6.460 | |
| 226663.7 | CN | N(J,F)=2(3/2,1/2)–1(1/2,1/2) | — | — | — | |
| 226679.3 | CN | N(J,F)=2(3/2,3/2)–1(1/2,1/2) | 4.5 | 0.113 | 1.917 | |
| 226874.2 | CN | N(J,F)=2(5/2,5/2)–1(3/2,3/2) | 4.5 | 0.566 | 12.804 | |
| 226874.8 | CN | N(J,F)=2(5/2,7/2)–1(3/2,5/2) | — | — | — | |
| 226875.9 | CN | N(J,F)=2(5/2,3/2)–1(3/2,1/2) | — | — | — | |
| 226887.4 | CN | N(J,F)=2(5/2,3/2)–1(3/2,3/2) | — | — | — | |
| 226892.1 | CN | N(J,F)=2(5/2,5/2)–1(3/2,5/2) | 4.5 | 0.198 | 3.007 | |
| 226905.4 | CN | N(J,F)=2(5/2,3/2)–1(3/2,5/2) | — | — | — | |
| 108651.3 | 13CN | 1/2–1/2 F=2–1 F1=0 F2=1–0 | 6.0 | 0.026 | 0.352: | |
| 108657.6 | 13CN | 1/2–1/2 F=2–2 F1=1 F2=1–1 | — | — | — | |
| 108658.9 | 13CN | 1/2–1/2 F=1–2 F1=1 F2=1–1 | — | — | — | |
| 108780.2 | 13CN | 3/2–1/2 F=3–2 F1=1 F2=2–1 | 6.0 | 0.038 | 1.702 | |
| 108782.4 | 13CN | 3/2–1/2 F=2–1 F1=1 F2=2–1 | — | — | — | |
| 108787.0 | 13CN | 3/2–1/2 F=1–0 F1=1 F2=2–1 | — | — | — | |
| 108793.8 | 13CN | 3/2–1/2 F=1–1 | — | — | — | |
| 108796.4 | 13CN | 3/2–1/2 F=2–2 | — | — | — | |
| 230538.0 | CO | J=2–1 | 5.4 | 3.087 | 83.055 | |
| 110201.4 | 13CO | J=1–0 | 3.9 | 0.235 | 7.702 | |
| 220398.7 | 13CO | J=2–1 | 7.3 | 0.671 | 20.398 | |
| 224714.4 | C17O | J=2–1 | 5.8 | 0.071 | 2.248 | |
| 109782.1 | C18O | J=1–0 | 3.8 | 0.032 | 0.983 | |
| 219560.4 | C18O | J=2–1 | 4.9 | 0.070 | 2.015 | |
| 97981.0 | CS | J=2–1 | 3.5 | 0.158 | 5.252 | |
| 244935.6 | CS | J=5–4 | 4.5 | 0.449 | 13.162 | |
| 231221.0 | 13CS | J=5–4 | 5.2 | 0.034 | 0.720 | |
| 242913.6 | C33S | J=5–4 | 3.5 | 0.009 | 0.162: | |
| 96412.9 | C34S | J=2–1 | 3.5 | 0.015 | 0.385 | |
| 241016.1 | C34S | J=5–4 | 10.0 | 0.079 | 1.950 | |
| 86847.0 | SiO | J=2–1 | 4.9 | 0.023 | 0.397 | |
| 260518.0 | SiO | J=6–5 | 7.2 | 0.075 | 3.013 | |
| 90771.5 | SiS | J=5–4 | 6.6 | 0.034 | 0.682 | |
| 108924.3 | SiS | J=6–5 | 3.2 | 0.033 | 1.310 | |
| 235961.1 | SiS | J=13–12 | 5.1 | 0.064 | 1.931 | |
| 254102.9 | SiS | J=14–13 | 6.6 | 0.063 | 1.957 | |
| 87284.6 | C2H | N=1–0 J,F=3/2,1–1/2,1 | 9.7 | 0.020 | 0.580: | |
| 87317.1 | C2H | N=1–0 J,F=3/2,2–1/2,1 | 9.7 | 0.097 | 4.670 | |
| 87328.7 | C2H | N=1–0 J,F=3/2,1–1/2,0 | — | — | — | |
| 87402.1 | C2H | N=1–0 J,F=1/2,1–1/2,1 | 9.7 | 0.067 | 1.820 | |
| 87407.2 | C2H | N=1–0 J,F=1/2,0–1/2,1 | — | — | — | |
| 87446.4 | C2H | N=1–0 J,F=1/2,1–1/2,0 | 9.7 | 0.019 | 0.510: | |
| 262005.3 | C2H | N=3–2 J=7/2–5/2 | 8.2 | 0.232 | 7.621 | |
| 262066.1 | C2H | N=3–2 J=5/2–3/2 | 8.2 | 0.147 | 4.630 | |
| 262208.4 | C2H | N=3–2 J=5/2–5/2 | 8.2 | 0.030 | 0.540: | |
| 88631.6 | HCN | J=1–0 | 4.9 | 0.990 | 29.090 | |
| 265886.4 | HCN | J=3–2 | 10.6 | 2.878 | 84.870 | |
| 265852.8 | HCN | =11e J=3–2 | — | — | — | |
| 258154.7 | HC15N | J=3–2 | 5.5 | 0.140 | 3.593 | |
| 86340.2 | H13CN | J=1–0 | 5.0 | 0.315 | 8.710 | |
| 259011.8 | H13CN | J=3–2 | 6.9 | 1.106 | 30.313 | |
| 90663.6 | HNC | J=1–0 | 4.9 | 0.128 | 3.720 | |
| 261263.4 | HN13C | J=3–2 | 7.5 | 0.027 | 0.618 | |
| 93063.6 | SiC2 | 40,4–30,3 | 4.0 | 0.017 | 0.410 | |
| 158499.2 | SiC2 | 70,7–60,6 | 8.4 | 0.034: | 0.320: | |
| 220773.7 | SiC2 | 100,10–90,9 | 7.4 | 0.054 | 1.333 | |
| 222009.4 | SiC2 | 92,7–82,6 | 7.2 | 0.030 | 0.923 | |
| 232534.1 | SiC2 | 102,9–92,8 | 5.1 | 0.031 | 0.930 | |
| 234534.0 | SiC2 | 108,2–98,1 | 4.8 | 0.019 | 0.298 | |
| 234534.0 | SiC2 | 108,3–98,2 | — | — | — | |
| 235713.0 | SiC2 | 106,5–96,4 | 5.9 | 0.036 | 1.016 | |
| 235713.1 | SiC2 | 106,4–96,3 | — | — | — | |
| 237150.0 | SiC2 | 104,7–94,6 | 4.5 | 0.029 | 0.505 | |
| 237331.3 | SiC2 | 104,6–94,5 | 4.5 | 0.023 | 0.567 | |
| 241367.7 | SiC2 | 110,11–100,10 | 10.8 | 0.043 | 0.903 | |
| 247529.1 | SiC2 | 102,8–92,7 | 6.0 | 0.044 | 1.177 | |
| 254981.5 | SiC2 | 112,10–102,9 | 6.4 | 0.040 | 1.091 | |
| 258065.0 | SiC2 | 118,3–108,2 | 6.1 | 0.023 | 0.716 | |
| 258065.0 | SiC2 | 118,4–108,3 | — | — | — | |
| 259433.3 | SiC2 | 116,6–106,5 | 6.8 | 0.041 | 0.800 | |
| 259433.3 | SiC2 | 116,5–106,4 | — | — | — | |
| 261150.7 | SiC2 | 114,8–104,7 | 7.6 | 0.046 | 0.902 | |
| 261509.3 | SiC2 | 114,7–104,6 | 7.9 | 0.025 | 0.631 | |
| 261990.7 | SiC2 | 120,12–110,11 | — | — | — | |
| 98011.6 | C3H | J=9/2–7/2 F=5–4 f | 3.3 | 0.019 | 0.545 | |
| 98012.5 | C3H | J=9/2–7/2 F=4–3 f | — | — | — | |
| 103319.3 | C3H | J=9/2–7/2 F=5–4 f | 4.0 | 0.012 | 0.367 | |
| 103319.8 | C3H | J=9/2–7/2 F=4–3 f | — | — | — | |
| 103372.5 | C3H | J=9/2–7/2 F=5–4 e | 4.0 | 0.013 | 0.419 | |
| 103373.1 | C3H | J=9/2–7/2 F=4–3 e | — | — | — | |
| 79151.1 | C3N | N=8–7 a | 5.3 | 0.038 | 0.935 | |
| 79170.0 | C3N | N=8–7 b | 5.3 | 0.047 | 1.084 | |
| 89045.7 | C3N | N=9–8 a | 5.6 | 0.044 | 1.454 | |
| 89064.4 | C3N | N=9–8 b | 5.6 | 0.039 | 1.212 | |
| 98940.0 | C3N | N=10–9 a | 3.3 | 0.041 | 1.170 | |
| 98958.8 | C3N | N=10–9 b | 3.3 | 0.037 | 1.048 | |
| 108834.3 | C3N | N=11–10 a | 3.2 | 0.043 | 1.442 | |
| 108853.0 | C3N | N=11–10 b | 3.2 | 0.044 | 1.610 | |
| 76117.4 | C4H | N=8–7 a | 4.6 | 0.037 | 1.016 | |
| 76157.0 | C4H | N=8–7 b | 4.6 | 0.048 | 1.276 | |
| 95150.3 | C4H | N=10–9 a | 5.3 | 0.048 | 1.385 | |
| 95188.9 | C4H | N=10–9 b | 5.3 | 0.054 | 1.358 | |
| 104666.6 | C4H | N=11–10 a | 2.4 | 0.053 | 1.507 | |
| 104705.1 | C4H | N=11–10 b | 2.4 | 0.055 | 1.438 | |
| 96478.3 | C4H | =1 J=21/2–19/2 | 4.8 | 0.010 | 0.289: | |
| 89188.5 | HCO+ | J=1–0 | 5.0 | 0.010 | 0.267: | |
| 225697.8 | H2CO | 3(1,2)-2(1,1) | 6.0 | 0.023 | 0.739 | |
| 244047.8 | H2CS | 7(1,6)-6(1,5) | 3.7 | 0.010 | 0.239: | |
| 88315.1 | C5H | J=37/2–35/2 e | 4.4 | 0.018 | 0.543 | |
| 88320.9 | C5H | J=37/2–35/2 f | — | — | — | |
| 88914.1 | C5H | J=37/2–35/2 e | 5.5 | 0.015 | 0.546 | |
| 88916.2 | C5H | J=37/2–35/2 f | — | — | — | |
| 72783.8 | HC3N | J=8–7 | 4.8 | 0.158 | 4.840 | |
| 81881.5 | HC3N | J=9–8 | 4.8 | 0.198 | 5.475 | |
| 90979.0 | HC3N | J=10–9 | 3.9 | 0.211 | 6.860 | |
| 100076.4 | HC3N | J=11–10 | 4.1 | 0.235 | 7.335 | |
| 109173.6 | HC3N | J=12–11 | 3.6 | 0.284 | 9.560 | |
| 227418.9 | HC3N | J=25–24 | 5.6 | 0.258 | 8.069 | |
| 236512.8 | HC3N | J=26–25 | 5.0 | 0.248 | 7.686 | |
| 245606.3 | HC3N | J=27–26 | 4.4 | 0.292 | 9.496 | |
| 254699.5 | HC3N | J=28–27 | 6.5 | 0.274 | 8.724 | |
| 263792.3 | HC3N | J=29–28 | 6.9 | 0.243 | 7.705 | |
| 218860.6 | HC3N | =11eJ=24–23 | 3.4 | 0.014 | 0.457 | |
| 219173.6 | HC3N | =11fJ=24–23 | 3.4 | 0.018 | 0.498 | |
| 227977.1 | HC3N | =11eJ=25–24 | 5.4 | 0.019 | 0.243 | |
| 228303.0 | HC3N | =11fJ=25–24 | 5.9 | 0.023 | 0.524 | |
| 237093.2 | HC3N | =11eJ=26–25 | 5.3 | 0.027 | 0.264 | |
| 237432.0 | HC3N | =11fJ=26–25 | 5.3 | 0.011 | 0.220 | |
| 246208.9 | HC3N | =11eJ=27–26 | 4.2 | 0.023 | 0.423 | |
| 246560.7 | HC3N | =11fJ=27–26 | 4.2 | 0.029 | 0.434 | |
| 255324.3 | HC3N | =11eJ=28–27 | 6.3 | 0.017 | 0.209 | |
| 255689.1 | HC3N | =11fJ=28–27 | 6.3 | 0.023 | 0.210 | |
| 264439.3 | HC3N | =11eJ=29–28 | 6.4 | 0.047 | 0.473 | |
| 264817.0 | HC3N | =11fJ=29–28 | 6.4 | 0.024 | 0.314 | |
| 79350.5 | H13CCCN | J=9–8 | 5.0 | 0.017 | 0.465 | |
| 88166.8 | H13CCCN | J=10–9 | 5.3 | 0.038 | 0.292: | |
| 96983.0 | H13CCCN | J=11–10 | 4.3 | 0.018 | 0.393 | |
| 105799.1 | H13CCCN | J=12–11 | 3.4 | 0.019 | 0.396 | |
| 229203.1 | H13CCCN | J=26–25 | 5.5 | 0.022 | 0.200 | |
| 81534.1 | HC13CCN | J=9–8 | 4.5 | 0.015 | 0.542 | |
| 90593.1 | HC13CCN | J=10–9 | 4.9 | 0.017 | 0.794 | |
| 99651.8 | HC13CCN | J=11–10 | 3.6 | 0.023 | 0.758 | |
| 108710.5 | HC13CCN | J=12–11 | 6.7 | 0.025 | 1.531 | |
| 253619.1 | HC13CCN | J=28–27 | 6.4 | 0.022 | 0.541 | |
| 71889.6 | HC5N | J=27–26 | 9.0 | 0.042 | 1.204 | |
| 74552.0 | HC5N | J=28–27 | 6.0 | 0.041 | 1.402 | |
| 77214.4 | HC5N | J=29–28 | 7.8 | 0.047 | 1.044 | |
| 79876.7 | HC5N | J=30–29 | 5.6 | 0.038 | 0.645 | |
| 82539.0 | HC5N | J=31–30 | 4.6 | 0.036 | 0.909 | |
| 85201.3 | HC5N | J=32–31 | 6.1 | 0.036 | 0.774 | |
| 87863.6 | HC5N | J=33–32 | 10.4 | 0.047 | 0.764: | |
| 90525.9 | HC5N | J=34–33 | 5.2 | 0.027 | 0.894 | |
| 93188.1 | HC5N | J=35–34 | 4.4 | 0.026 | 0.675 | |
| 95850.3 | HC5N | J=36–35 | 3.5 | 0.028 | 0.765 | |
| 98512.5 | HC5N | J=37–36 | 2.9 | 0.023 | 0.638 | |
| 101174.7 | HC5N | J=38–37 | 3.2 | 0.023 | 0.738 | |
| 103836.8 | HC5N | J=39–38 | 1.9 | 0.026 | 0.663 | |
| 106498.9 | HC5N | J=40–39 | 4.1 | 0.021 | 0.800 | |
| 109161.0 | HC5N | J=41–40 | — | — | — | |
| 73588.8 | CH3CN | 4(1)–3(1) | 5.6 | 0.036 | 0.869 | |
| 73590.2 | CH3CN | 4(0)–3(0) | 5.6 | — | — | |
| 91985.3 | CH3CN | 5(1)–4(1) | 4.0 | 0.028 | 1.186 | |
| 91987.1 | CH3CN | 5(0)–4(0) | — | — | — | |
| 110381.4 | CH3CN | 6(1)–5(1) | 3.4 | 0.041 | 1.697 | |
| 110383.5 | CH3CN | 6(0)–5(0) | — | — | — | |
| 220641.1 | CH3CN | 12(5)–11(5) | 7.5 | 0.018 | 0.418: | |
| 220679.3 | CH3CN | 12(4)–11(4) | 7.5 | 0.018 | 0.156: | |
| 220709.0 | CH3CN | 12(3)–11(3) | 7.5 | 0.029 | 0.637 | |
| 220730.3 | CH3CN | 12(2)–11(2) | 7.5 | 0.064 | 2.154 | |
| 220743.0 | CH3CN | 12(1)–11(1) | — | — | — | |
| 220747.3 | CH3CN | 12(0)–11(0) | — | — | — | |
| 239022.9 | CH3CN | 13(5)-12(5) | 6.7 | 0.012 | 0.127: | |
| 239064.3 | CH3CN | 13(4)-12(4) | 6.7 | 0.013 | 0.195: | |
| 239096.5 | CH3CN | 13(3)-12(3) | 6.7 | 0.029 | 0.392 | |
| 239119.5 | CH3CN | 13(2)-12(2) | 6.7 | 0.070 | 3.010 | |
| 239133.3 | CH3CN | 13(1)-12(1) | — | — | — | |
| 239137.9 | CH3CN | 13(0)-12(0) | — | — | — | |
| 257403.6 | CH3CN | 14(5)-13(5) | 5.8 | 0.006 | 0.030: | |
| 257448.1 | CH3CN | 14(4)-13(4) | 5.8 | 0.014 | 0.086: | |
| 257482.8 | CH3CN | 14(3)-13(3) | 5.8 | 0.032 | 0.419: | |
| 257507.6 | CH3CN | 14(2)-13(2) | 5.8 | 0.077 | 2.400 | |
| 257522.4 | CH3CN | 14(1)-13(1) | — | — | — | |
| 257527.4 | CH3CN | 14(0)-13(0) | — | — | — | |
| 223938 | U | 4.3 | 0.021 | 0.541 | ||
| 264191 | U | 6.3 | 0.029 | 0.540 |
-
a Unsolved hyperfine structure lines.
-
b The C2H and SiC2 lines are blended with each other. The former is stronger.
-
c The HC3H and HC5H lines are blended with each other. The former is stronger.
-
d Blended with the corresponding transitions from HCC13CN.
| Species | a | (cm-2) | ||||||
|---|---|---|---|---|---|---|---|---|
| (K) | This paperb | F94c | IRC+10216d | This paperb | IRC+10216e | This paperb | AFGL 618f | |
| CN | 21.49 | 3.03 | ||||||
| 13CN | 7.06 | 0.07 | ||||||
| CO | 100 | |||||||
| 13CO | 2.5 | |||||||
| C17O | 0.29 | |||||||
| C18O | 0.20 | |||||||
| CS | 0.17 | 0.13 | ||||||
| 13CS | 0.04 | |||||||
| C33S | 0.01 | |||||||
| C34S | 0.13 | |||||||
| SiO | 25.1 | 0.02 | 0.01 | |||||
| SiS | 36.4 | 0.35 | ||||||
| C2H | 6.6 | 3.03 | 0.50 | |||||
| HCN | 1.53 | 1.49 | ||||||
| HC15N | 0.07 | |||||||
| H13CN | 1.32 | 0.03 | ||||||
| HNC | 1.42 | 0.17 | ||||||
| HN13C | 0.01 | 0.004 | ||||||
| SiC2 | 95.3 | 2.9 | 0.66 | |||||
| C3H | 51.1 | 1.00 | 0.02 | |||||
| C3N | 1.32 | 0.12 | ||||||
| C4H | 12.8 | 9.79 | 1.0 | |||||
| C5H | 0.61 | 0.005 | ||||||
| HCO+ | 0.06 | 0.10 | ||||||
| H2CO | 0.08 | 0.13 | ||||||
| H2CS | 0.05 | |||||||
| HC3N | 46.1 | 1.0 | 1.0 | |||||
| H13CCCN | 32.4 | 0.08 | ||||||
| HC5N | 27.8 | 0.21 | ||||||
| CH3CN | 28.0 | 0.19 | 0.03 | |||||
| Isotopic ratio | AFGL 2688 | IRC+10216a | Solarb | |
|---|---|---|---|---|
| Species | Value | |||
| 12C/13C | 12C34S/13C32S | 45 | 89 | |
| H12C3N/H13CCCN | ||||
| 12CO/13CO | ||||
| 12CS/13CS | ||||
| H12CN/H13CN | ||||
| 14N/15N | HC14N/HC15N | 272 | ||
| H13C14N/H12C15N | ||||
| 16O/17O | C16O/C17O | 2681 | ||
| 13C16O/12C17O | ||||
| 18O/17O | C18O/C17O | 5.37 | ||
| 32S/34S | C32S/C34S | 22.5 | ||
| 33S/34S | C33S/C34S | 0.18 | ||