11email: rkale@ira.inaf.it 22institutetext: INAF-Istituto di Radioastronomia, via Gobetti 101, 40129 Bologna, Italy 33institutetext: Department of Astronomy, University of Maryland, College Park, MD 20742, USA 44institutetext: Joint Space-Science Institute, University of Maryland, College Park, MD, 20742-2421, USA 55institutetext: Laboratoire Lagrange, UMR7293, Universit´e de Nice Sophia-Antipolis, CNRS, Observatoire de la Cˆote dAzur, 06300 Nice, France 66institutetext: Indian Institute of Science Education and Research (IISER), Pune, India
The Extended GMRT Radio Halo Survey I: New upper limits on radio halos and mini-halos
Abstract
Context. A fraction of galaxy clusters host diffuse radio sources called radio halos, radio relics and mini-halos. These are associated with the relativistic electrons and magnetic fields present over Mpc scales in the intra-cluster medium.
Aims. We aim to carry out a systematic radio survey of all luminous galaxy clusters selected from the REFLEX and eBCS X-ray catalogs with the Giant Metrewave Radio Telescope, to understand the statistical properties of the diffuse radio emission in galaxy clusters.
Methods. We present the sample and first results from the Extended GMRT Radio Halo Survey (EGRHS), which is an extension of the GMRT Radio Halo Survey (GRHS, Venturi et al. 2007, 2008).
Results. Analysis of radio data at 610/ 235/ 325 MHz on 12 galaxy clusters are presented. We report the detection of a newly discovered mini-halo in the cluster RXJ1532.9+3021 at 610 MHz. The presence of a small scale relic ( kpc) is suspected in the cluster Z348. We do not detect cluster-scale diffuse emission in 11 clusters. Robust upper limits on the detection of radio halo of size of 1 Mpc are determined. We also present upper limits on the detections of mini-halos in a sub-sample of cool-core clusters. The upper limits for radio halos and mini-halos are plotted in the radio power- X-ray luminosity plane and the correlations are discussed. Diffuse extended emission, not related to the target clusters, but detected as by-products in the sensitive images of two of the cluster fields (A689 and RXJ0439.0+0715) are reported.
Conclusions. Based on the information about the presence of radio halos (or upper limits), available on 48 clusters out of the total sample of 67 clusters (EGRHS+GRHS), we find that of the clusters host radio halos. The radio halo fraction rises to , when only the clusters with X-ray luminosities erg s-1 are considered. Mini-halos are found in of cool-core clusters. A qualitative examination of the X-ray images of the clusters with no diffuse radio emission indicates that a majority of these clusters do not show extreme dynamical disturbances and supports the idea that mergers play an important role in the generation of radio halos/relics. The analysis of the full sample will be presented in a future work.
Key Words.:
radio continuum:galaxies–galaxies:clusters:general1 Introduction
Galaxy clusters are massive ( M☉) assemblies of dark matter, diffuse gas and galaxies. The diffuse gas, called the intra-cluster medium (ICM), mainly consists of hot thermal gas ( K). It emits thermal Bremsstrahlung radiation and is detected in X-rays. Relativistic particles (with Lorentz factors ) and magnetic fields ( G) are mixed with the thermal gas. The synchrotron emission associated with the ICM, detectable in the radio band, is a direct probe of the relativistic electrons and magnetic fields.
The radio emission from the ICM has been classified into three main types: radio halos, radio relics and mini-halos (see Feretti et al. 2012, for a review). Radio halos are Mpc sized sources having synchrotron spectra111, where is the flux density at frequency and is the spectral index. with typical spectral indices, and morphologies co-spatial with the extended X-ray emission from the ICM. Radio relics are diffuse radio sources at cluster peripheries, typically with filamentary, arc-like or irregular morphologies. Relics are also highly polarized and can have sizes in the range 0.2 to 2 Mpc. Mini-halos are 150 – 500 kpc in size and have been found around dominant radio galaxies at cluster centers.
Radio relics having elongated or arc-like morphologies that are located at cluster peripheries, have been proposed to be produced by electrons that are accelerated by merger or accretion shocks (Enßlin et al. 1998). In some cases, the polarization properties and the spectral steepening from outer to inner edges have been observed which confirms their connection with the out-going cluster merger shock waves (e.g. Giacintucci et al. 2008; van Weeren et al. 2010; Kale et al. 2012). The Mach numbers of the shocks have been estimated to be in the range based on the X-ray observations (see Akamatsu & Kawahara 2011; Akamatsu et al. 2011; Ogrean & Brüggen 2012; Sarazin et al. 2012; Bourdin et al. 2013, for recent results). Shocks with such low Mach numbers are inefficient in accelerating electrons to the observed energies and the acceleration mechanism behind relics is still not understood (see Markevitch 2010; Jones 2012; Kang et al. 2012; Pinzke et al. 2013).
The origin of radio halos and mini-halos is still a matter of debate. The long diffusion times of the relativistic electrons compared to their short radiative lifetimes require an in-situ mechanism of generation of relativistic electrons in the ICM (Jaffe 1977).
Mini-halos have been found in relaxed, cool core clusters (e.g. Gitti et al. 2002; Govoni et al. 2009; Giacintucci et al. 2011). Re-acceleration of a pre-existing population of relativistic electrons in cool cores by turbulence has been proposed to explain the mini-halos (Gitti et al. 2002; Mazzotta & Giacintucci 2008; ZuHone et al. 2013). The origin of turbulence in the ICM of cool core clusters is still unclear, however it might be generated by gas sloshing (Mazzotta & Giacintucci 2008). The seed relativistic electrons may be injected from the activity of central AGN (e.g. Cassano et al. 2008) and/or may be secondary products of hadronic collisions in the ICM (e.g. Pfrommer & Enßlin 2004; Keshet & Loeb 2010).
In the case of radio halos, there are two main classes of theoretical models, namely, the ‘secondary electron’ models and the turbulent re-acceleration based models. According to the secondary electron models, the relativistic electrons which are produced as secondary products of the hadronic collisions in the ICM, in the presence of magnetic fields lead to the generation of sources like radio halos (e.g. Dennison 1980; Blasi & Colafrancesco 1999; Dolag & Enßlin 2000; Keshet & Loeb 2010). The gamma rays expected from the hadronic collisions in the ICM have so far not been detected and this poses a challenge to the secondary electron models (e.g. Jeltema & Profumo 2011; Ackermann et al. 2010; Brunetti et al. 2012).
In the turbulent re-acceleration based models, it is proposed that a low energy relativistic electron population in the ICM is re-accelerated by turbulence injected by mergers (Brunetti et al. 2001; Petrosian 2001; Petrosian & East 2008). The seed electron population can be primary and/or secondary in origin. The expectations of these models, such as the occurrences of radio halos in luminous, massive and merging clusters, have received support from the observations (e.g. Buote 2001; Cassano et al. 2010). According to these models the most powerful radio halos are likely to occur in the energetic mergers involving very massive galaxy clusters. A population of radio halos generated in lower energy cluster mergers (more common), with a characteristic very steep synchrotron spectrum () due to lower energy in turbulence, is also predicted (e.g. Cassano et al. 2006). These low energy radio halos are termed as ultra-steep spectrum radio halos (USSRHs) and a few have been detected so far (e.g. Brunetti et al. 2008; Macario et al. 2010, 2013). Due to their steep spectra, instruments operating at low frequencies such as the GMRT and the LOFAR are favoured for detecting the USSRHs. The existence of the USSRHs is also a challenge for the secondary models that would require uncomparably large energy content in cosmic ray protons (see Brunetti et al. 2008, and references therein). Consequently LOFAR may allow a complementary test on the origin of radio halos.
One of the most promising ways to make progress in the understanding of these sources is to observe a large number of clusters to obtain statistics of the occurrence of radio halos, relics and mini-halos. The success of this approach is evident from the results of the GMRT Radio Halo Survey (hereafter GRHS) (Venturi et al. 2007, 2008, hereafter, V07 and V08 respectively). The GRHS led to the discoveries of 4 radio halos, 1 mini-halo and 3 diffuse radio relic/halo candidates in galaxy clusters. Most importantly GRHS also gave the first upper limits on the detections of radio halos using the method of model radio halo injection. The understanding of empirical correlations between the radio power at 1.4 GHz of the halo (P1.4GHz) and X-ray luminosity (LX) of the parent cluster and the connection between cluster mergers and radio halos have been significantly improved with the inclusion of upper limits. A limit on the lifetime of a radio halo using the bimodal distribution of radio halo and non-radio-halo clusters in the P1.4GHz–LX plane was obtained (Brunetti et al. 2007). The first quantitative estimate of the separation of radio halo and non-radio halo clusters as merging and non-merging clusters has been made using the GRHS and the Chandra data (Cassano et al. 2010). Recently, using the measurements of integrated Compton Y parameter of clusters with the Planck satellite, a scaling between radio halo power and Y has been presented which shows a weaker bimodality as compared to that in the P1.4GHz–LX plane (Basu 2012). However, it is essential to improve the statistical significance of these relations to better understand the connection between the thermal and non-thermal components (relativistic electrons and magnetic fields) of the ICM.
With this motivation we have undertaken the Extended GMRT Radio Halo Survey (EGRHS). In this paper we present the first results from the EGRHS. The EGRHS sample is described in Sec. 2. The radio observations and data reduction are described in Sec. 3. The results based on the radio images are presented in Sec. 4. The estimates of the upper limits are presented in Sec. 5. The results are discussed in Sec. 6 and a summary is presented in Sec. 7. Radio images of each of the cluster fields covering a region up to the virial radius are presented in Appendix 1.
A cosmology with km s-1 Mpc-1, and is adopted.
2 The Extended GMRT Radio Halo Survey
The EGRHS consists of a galaxy cluster sample extracted from the ROSAT-ESO Flux Limited X-ray galaxy cluster catalog (REFLEX, Böhringer et al. 2004) and from the extended ROSAT Brightest Cluster Sample catalog (eBCS, Ebeling et al. 1998, 2000). The selection criteria are :
-
1.
LX (0.1-2.4 keV) erg s-1;
-
2.
;
-
3.
for the REFLEX and eBCS samples.
The declination limit, imposed while selecting clusters from the eBCS catalog for the GRHS sample is extended to obtain the EGRHS sample. The choice of high X-ray luminosity ensures that the radio halos (if present, and with radio powers expected from the P1.4GHz-LX scaling) will be well within the detection limits of the GMRT. The X-ray luminosity and the redshift ranges also ensure higher possibility of the occurrence of radio halos based on model predictions (Cassano et al. 2004; Cassano & Brunetti 2005; Cassano et al. 2006). The lower limit in declination of will ensure good uv-coverage with the GMRT. These selection criteria led to a sample of 67 clusters. Of these 50 clusters were part of the GRHS (V07, V08) and the additional 17 form the EGRHS (Table 1).
3 Radio observations and data reduction
The aim of the EGRHS and GRHS together is to assemble a large sample of galaxy clusters with sensitive radio observations in order to improve the statistical information on radio halos, relics and mini-halos. Therefore along with new observations for EGRHS, we are also carrying out observations of a few GRHS clusters for which radio data were inadequate (Table 1). Here we provide a summary of what is presented in this paper:
-
•
7 clusters from EGRHS at 610 and 235 MHz (GMRT proposal codes 19_039 and 16_117);
-
•
1 cluster from GRHS (A2261) at 610 and 235 MHz (GMRT proposal code 16_117);
-
•
archival 325 MHz GMRT observations for 3 clusters in the GRHS (GMRT Cluster Key Science project, PI V. K. Kulkarni) and
-
•
a re-analysis of 610 MHz data from V08 on the GRHS cluster RXJ1532.9+3021.
The clusters and the corresponding frequencies of observation are listed in Table 2.
Based on the experience of observations at 610 MHz of GRHS clusters, we decided to move to dual frequency (610-235 MHz simultaneous) observations for the EGRHS. This approach provides two major advantages as compared to the single frequency band observations of the GRHS. Firstly, it allows for an immediate cross check of the presence of diffuse emission at another frequency. Secondly, the low frequency (235 MHz) allows for a possibility of the detection of USSRHs. In EGRHS each cluster is observed for an 8 hour duration in the dual frequency mode. This has resulted in better uv-coverage as compared to the GRHS. Thus the EGRHS is an extension of GRHS with an upgraded observing strategy.
The dual frequency observations of the EGRHS were carried out with the GMRT Software Backend (Roy et al. 2010) in the mode that provided 256 channels to acquire the data. Bandwidths of 32 MHz at 610 MHz and 8 MHz at 235 MHz were used.
Data were analysed using the NRAO Astronomical Image Processing System (AIPS). The steps in data reduction that were followed at both 610 and 235 MHz are described briefly. The data from the antennas that were not working were identified by examining the calibrators and removed. The task ‘SPFLG’ was used to identify and remove the channels affected by radio frequency interference. The channels at the edges of the bands were also removed due to lower sensitivity and stability. After excising bad data, calibration using the primary and secondary calibrators was carried out. The calibrated data were re-examined and any remaining bad data were excised. The edited and calibrated data on target source were then averaged in frequency to an extent which kept ‘bandwidth smearing’ effect at negligible levels. The data were then imaged using wide field imaging technique. Several iterations of phase-only self-calibration and a final amplitude and phase self-calibration were carried out to improve the sensitivities of the images. Various tapers and weighting schemes on the uv-data were used to make images with a wide range of synthesized beams. Images with resolutions (FWHM) and at 610 and 235 MHz, respectively, were examined. These were used in combination with high resolution images to test the presence of any suspected extended emission.
For two EGRHS clusters, Z348 and A267, and for the GRHS cluster A2261 dual frequency data were recorded with the hardware backend. It provided single polarization (RR) in two sidebands with 128 channels and a bandwidth of 16 MHz each at 610 MHz. The 235 MHz data were recorded simultaneously in a separate polarization (LL) in a single sideband with a bandwidth of 8 MHz. The data were analysed separately for each sideband and the images were then combined. In addition to these we also reanalysed the 610 MHz data on RXJ1532.9+3021 from V08.
Archival GMRT data at 325 MHz (bandwidth 32 MHz) were analysed for three GRHS clusters, namely, RXCJ0437.1+0043, RXCJ1212.3-1816 and A2485 (GMRT cluster Key Project). The data analyses were carried out using the steps similar to the ones described above.
4 Results
The analysis of these data have led to sensitive radio images of the 12 galaxy clusters. Radio images with rms noise in the range 45 - 80 Jy beam-1 at 610 MHz, 0.25 - 0.4 mJy beam-1 at 325 MHz and 0.45 - 1.8 mJy beam-1 at 235 MHz were obtained (Table 2). These are consistent with the sensitivities obtained in the GRHS and thus ensure the uniformity of the survey.
The main results of the paper are as follows. We present the 610 MHz image of the newly detected mini-halo in the cluster RXJ1532.9+3021. We did not detect radio halo, relic (Mpc scale) or mini-halo emission in 11 clusters. Diffuse emission on smaller scales ( kpc) are suspected in Z348 and RXCJ0437.1+0043. We describe the images of individual clusters in the following sub-sections.
4.1 Radio images
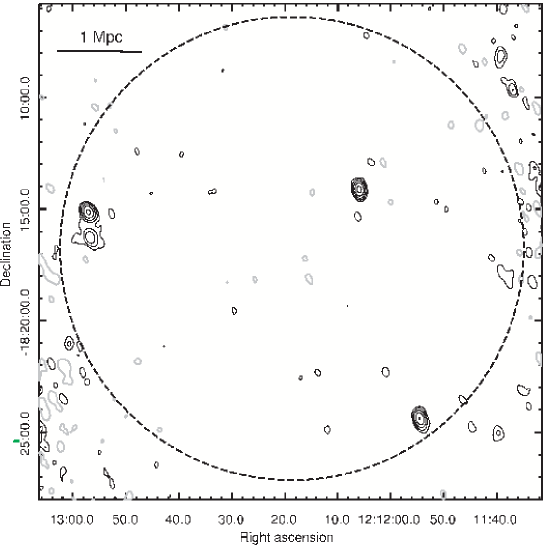
The sensitivities achieved using ‘natural weights’ (robust in AIPS) in each of the cluster fields are reported in Table 2. The residual amplitude errors are at 610 MHz (e.g. Chandra et al. 2004) and at 325 and 235 MHz. The radio images obtained using natural weights for the uv-data (610/325 MHz) of central regions of the clusters are shown in contours overlayed on the Chandra/XMM Newton222Data from Chandra observation IDs 7938, 10415, 9369, 3583, 10440, 3580, 10465, 11729, 10439 and XMM Newton observation number 0652010201 are used. X-ray images shown in colour in Fig. 1. Radio images of all the clusters covering regions up to the virial radius are presented in Appendix 1. A short note on each of the clusters based on our radio images and the information available in the literature is presented below.
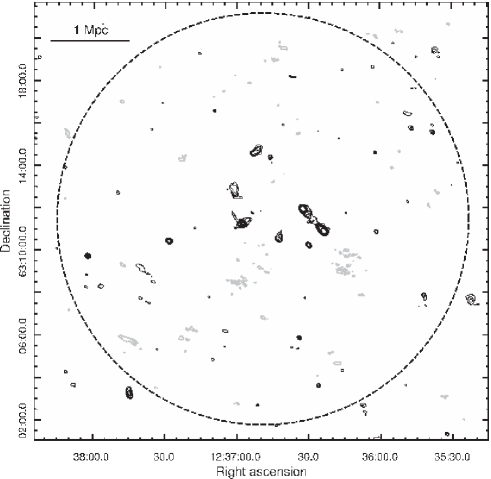
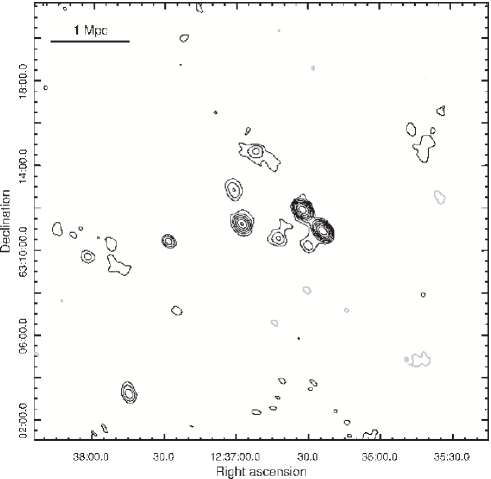
4.1.1 Abell 1576
The cluster A1576 (RXC J1236.9+631) is a rich cluster (richness, ) at a redshift of 0.302 ( kpc). The radio image shows the presence of a central radio galaxy, almost coincident with the peak in the X-ray emission (Fig. 1). In the highest resolution 610 MHz image (not shown), the central source resolves into at least 2 components which are coincident with optically detected galaxies in A1576. The optical counterpart of this radio galaxy has at least three optically detected nuclei and is suspected to be in an advanced stage of merger (Dahle et al. 2002). The central source has a jet-like extension toward the northwest. The slight extension toward northeast may be an artefact. The two other radio sources visible in the A1576 field shown in Fig. 1 have optical counterparts and are possibly radio galaxies in the cluster.
The field of this cluster contains several radio sources (Fig. 8). About west of cluster center is a double lobed radio galaxy. The core of this galaxy is not detected in the 610 and 235 MHz radio images and also in the FIRST survey. Thus the optical counterpart for this radio galaxy is not obvious. The morphology of the lobes indicates that it is of FR-II type. The spectral indices (235 - 610 MHz) of the eastern and the western lobes are 0.65 and 0.72, respectively.
Based on weak lensing analysis, Dahle et al. (2002) infer significant dynamical activity in A1576. The X-ray surface brightness distribution is elongated in the east-west direction and does not show pronounced central peak (Fig. 1). The cluster is relatively hot, with a temperature of 8.65 keV (Cavagnolo et al. 2009).
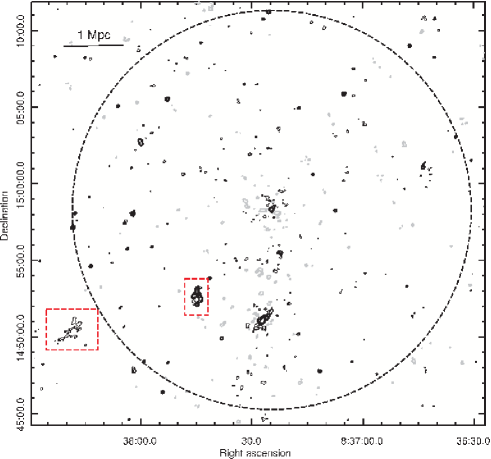
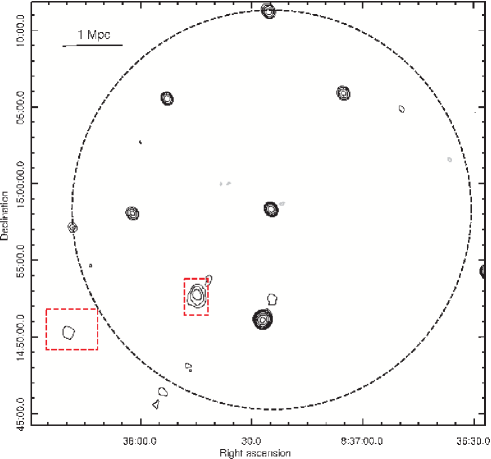
4.1.2 Abell 689
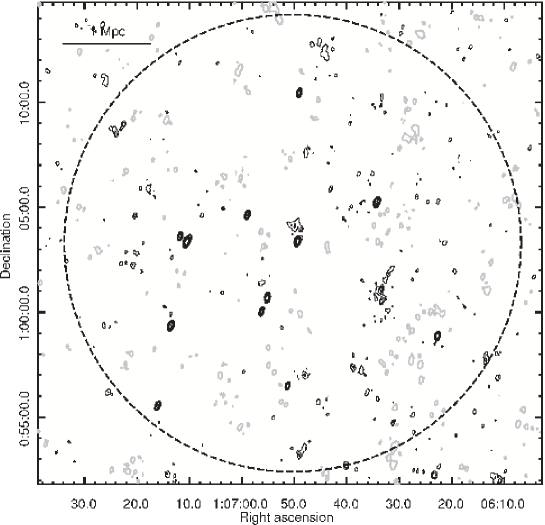
A689 (RX J0837.4+1458) is a cluster at a redshift of 0.279 ( kpc) with richness, . There is a bright X-ray and radio source associated with the central AGN in A689 (Fig. 1). The positive and negative emission at level, surrounding the bright central source are noise structures. The radio image of A689 contains several bright sources (Fig. 9). In particular there is a complex blend of radio galaxies and a low surface brightness feature toward the southeast of the cluster center (Fig. 9, see Sec. 4.2.2).
Prominent sub-structures have been reported in the mass distribution derived from lensing measurements (Okabe et al. 2010).
4.1.3 RXJ0439.0+0520
RXJ0439.0+0520 is a luminous cluster at redshift 0.208 ( kpc). There is a radio source at the center and another source toward its south, possibly a head-tail galaxy (Fig. 1). The central source has some hint of extended emission (on kpc scale), but needs higher resolution observations to confirm it. About east of the center, a possible FR-I type radio galaxy is seen (Fig. 10). A bright radio galaxy with a distinct core and two extended lobes with hot spots is detected about west of the center (Fig. 10). Optical counterparts to both these radio galaxies are detected in DSS POSS-II images. However, their connection to the galaxy cluster is unclear due to unavailability of redshifts for the optical counterparts.
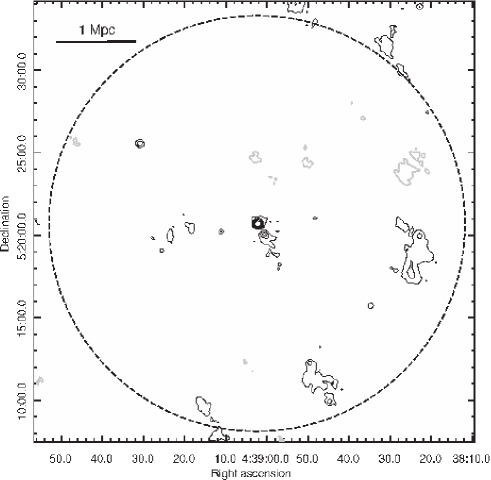
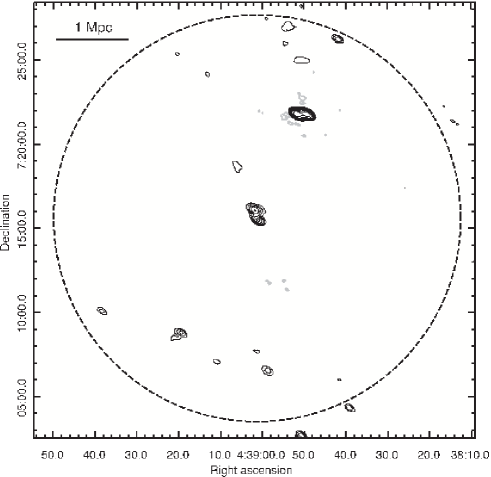
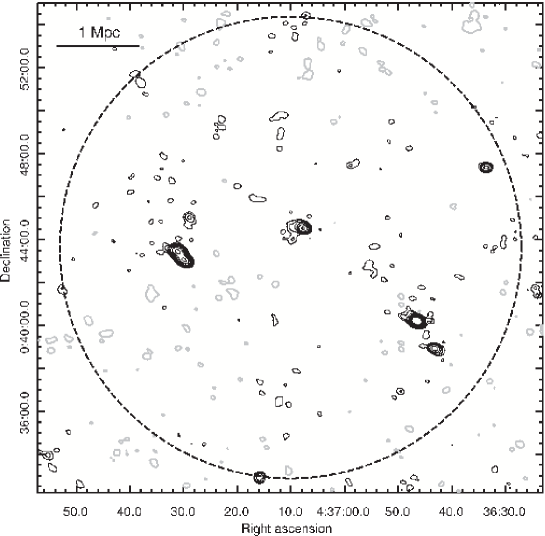
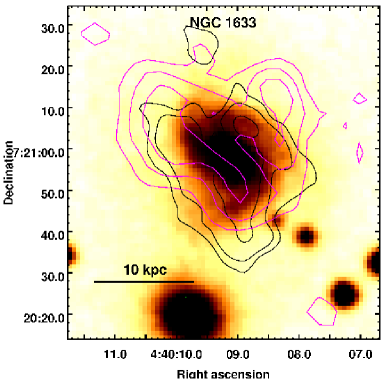
4.1.4 RXJ0439.0+0715
The cluster RXJ0439.0+0715 is located at a redshift of 0.244 ( kpc). A weak radio source is coincident with the peak in the X-rays (Fig. 1). Adjacent to this source is a bright radio source that resolves into a double source, oriented in the north-south direction, in the high resolution image at 610 MHz (not shown). In the cluster field up to the virial radius, a bright radio galaxy north-west of the cluster center is seen (Fig. 11). A pattern due to improper deconvolution of this bright source is visible in Fig. 11. The tail-like extension of the radio source, just south of the cluster center is most likely a part of this pattern.
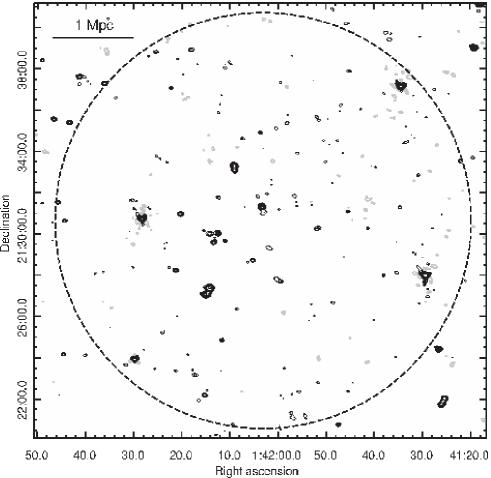
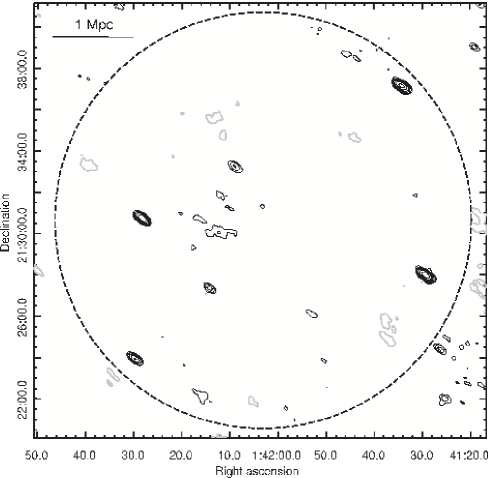
4.1.5 RXJ0142.0+2131
RXJ0142.0+2131 is a cluster at a redshift of 0.280 ( kpc). A radio source is present at the cluster center, coincident with the peak of the X-ray emission (Fig. 1). The cluster field has several bright radio sources (Fig. 12).
An amorphous distribution of X-ray emission is seen in the Chandra image with no strong central peak (Fig. 1). This cluster has a velocity dispersion of km s-1, however, no substructure in the velocity distribution (Barr et al. 2005). Based on the mass-to-light ratios of galaxies and element abundance ratios, a possibility of a past merger in the cluster has been inferred (Barr et al. 2006).
4.1.6 Abell 267
The cluster A267 is at a redshift of 0.230 ( kpc) with richness, . A faint radio source is detected at the center of this cluster (Fig. 1). The cluster field has some compact bright radio sources (Fig. 13).
The cluster has a cD galaxy at the center (Dahle et al. 2002) and the X-ray distribution is elliptical (Jeltema et al. 2005) (Fig. 1). The cluster is moderately hot with a temperature of 8.7 keV (Cavagnolo et al. 2009). It has been classified as a cool core cluster based on the analysis of power ratios (Bauer et al. 2005). However, its temperature profile lacks the typical drop in the centers of cool-cores and it has a relatively high value of central entropy ( keV cm2; Cavagnolo et al. (2009)). This central entropy is much higher than 50 keV cm2, which is the value adopted to separate cool cores and non-cool cores (Cavagnolo et al. 2009; Rossetti et al. 2011). Therefore A267 is like a non-cool core based on its entropy and temperature, but a relaxed cluster based on the power ratios.
4.1.7 Z348
Z348 (RXC J0106.8+0103) is at a redshift 0.254 ( kpc). A compact radio source is detected at the center of this cluster (Fig. 1). Adjacent to the central source, toward north, a diffuse source is detected in the 610 MHz image (Fig. 1). The source is elongated in the east-west direction and has an extent of kpc, if assumed to be at the redshift of Z348. It could be a relic of smaller extent similar to the one in A85 (Slee et al. 2001). The nature of this source remains to be confirmed.
There is an AGN at the cluster center with strong X-ray emission (Böhringer et al. 2000), which is also detected as a compact radio source (Fig. 1). The Chandra X-ray image shows elliptical distribution of emission along the northeast-southwest direction. No information about the dynamical status of Z348 is available in the literature.
4.1.8 Abell 2261
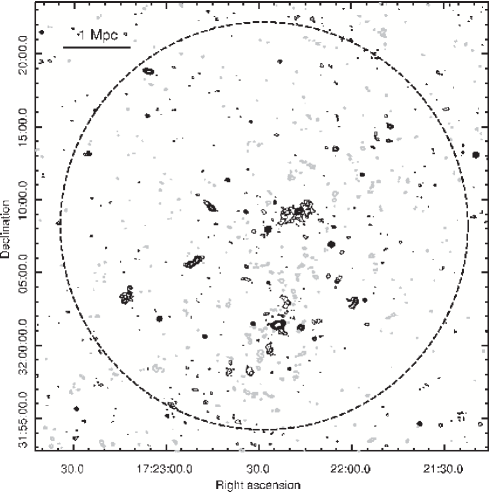
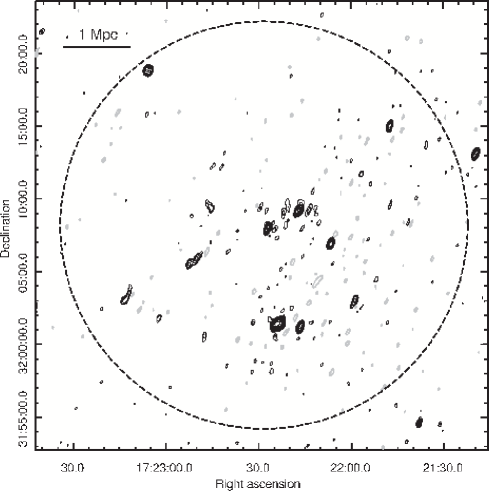
A2261 is a rich cluster () at a redshift of 0.224 ( kpc). There is a central radio source in the cluster (Fig. 1) identified with the optical galaxy 2MASX J17222717+3207571. A remarkable radio galaxy is seen ( kpc) toward the northwest of the cluster center. The radio galaxy shows presence of a compact source at the center and diffuse emission extended on two sides of it (Fig. 2). The diffuse emission is filamentary and of total extent kpc (if at the redshift of the cluster). Based on the morphology it is possibly an ‘FR-I’ type radio galaxy. The total flux density (corediffuse) of the radio galaxy at 610 MHz is mJy and 23.3 mJy at 1.4 GHz (NVSS J172216+320910). The implied spectral index is 1.08. The compact X-ray source, CXOGBA J172217.0+220913 (Gilmour et al. 2009), and an uncatalogued galaxy in the SDSS r-band image is co-incident with the compact radio core (Fig. 2). The field of this cluster shows the presence of several radio galaxies (Fig. 15).
Diffuse radio emission was suspected in this cluster based on the 1.4 GHz VLA D array image (V08). However, we did not find cluster wide extended radio emission at 610 and 235 MHz.
The cluster has circular morphology in X-rays and is most likely a relaxed system. It has a temperature of 7.58 keV (Cavagnolo et al. 2009). There is a diffuse patch of X-ray emission, west of the cluster, however its connection to the cluster is unknown.
4.1.9 RXCJ0437.1+0043
The cluster RXCJ0437.1+0043 is at a redshift of 0.284 ( kpc). There is a weak radio source at the cluster center and an elongated radio source to the north of it (Fig. 1). The extent of the elongated source in the east-west direction is kpc, if assumed to be at the redshift of the cluster. These sources were also detected at 1.4 GHz by Feretti et al. (2005). Their flux densities at 325 MHz are mJy (central source) and mJy (elongated source). The spectral indices for the two sources between 325 MHz and 1.4 GHz are 0.8 and 1.0, respectively. The elongated source is suspected to have an extension detected at 325 MHz toward the east which is not detected at 1.4 GHz. Both of these sources have possible optical counterparts but need to be confirmed.
A surface brightness upper limit of 0.18 mJy beam-1 (beam , p. a. ) at 1.4 GHz based on the level in the image was reported by Feretti et al. (2005). An upper limit using the method of injection of radio halo is presented in this work (Sec. 5).
This cluster field has other bright radio sources (Fig. 16). A double radio galaxy is located east of the cluster center.
4.1.10 RXCJ1212.3-1816
RXCJ1212.3-1816 is at a redshift of 0.269 ( kpc). There is no radio source in the vicinity of the cluster center (Fig. 1). The cluster field shows a few bright radio sources (Fig. 17).
The cluster appears elongated in the northeast-southwest direction in the X-ray image with XMM Newton (Fig. 1). The morphology also hints at a disturbed ICM. There is no information in the literature about the dynamical status of this cluster.
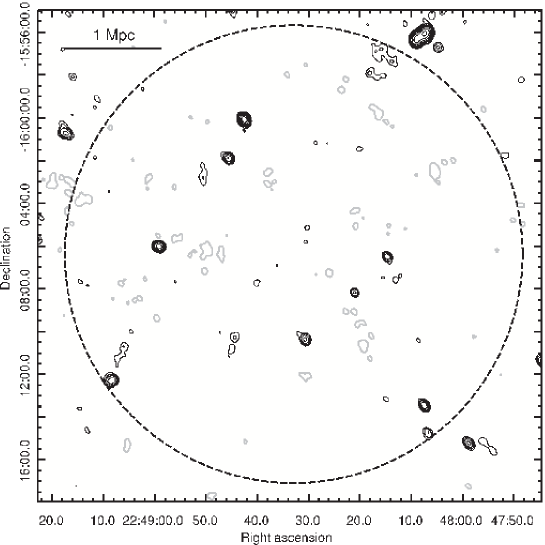
4.1.11 Abell 2485
A2485 is at a redshift of 0.247 ( kpc). The 610 MHz data on this cluster was presented in V08. However, it was not considered for analysis due to high rms noise (V08). Radio image at 325 MHz is presented here. There is no bright radio source close to the cluster center (Fig. 1). The field up to virial radius shows presence of several compact radio sources (Fig. 18).
The X-ray emission may be disturbed as the central peak is not pronounced (Fig. 1). There is no information about the dynamical status of this cluster in the literature.
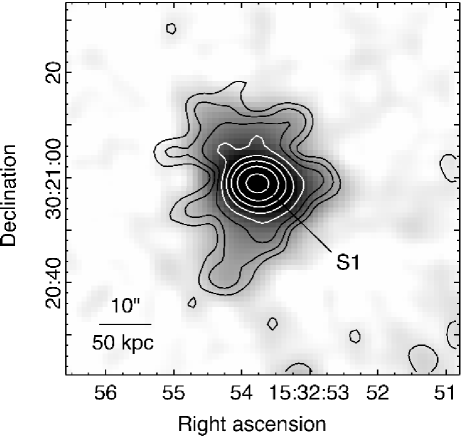
4.2 A mini-halo in RXJ1532.9+3021
The cluster RXJ1532.9+3021 is at a redshift of 0.345 ( kpc). We present the 610 MHz image of a mini-halo discovered in this cluster using VLA 1.4 GHz data (Giacintucci et al. in prep.). The 610 MHz observations of this cluster were presented in V08, however the mini-halo was not noticed. We re-analysed the 610 MHz observations from V08 and obtained radio images, shown in Fig. 3, that clearly reveal the diffuse mini-halo around the central unresolved radio galaxy (marked S1). The flux density of the mini-halo is mJy (after subtraction of the compact source S1, whose flux density is mJy) at 610 MHz. The largest linear size of kpc is detected at 610 MHz. The properties of this mini-halo will be reported in detail elsewhere (Giacintucci et al. in prep.).
4.3 Extended emission associated with galaxies
The EGRHS and the GRHS surveys are designed to be sensitive to low surface brightness, extended features such as the radio halos and relics. The resulting sensitive images thus also have the potential to detect other kind of faint extended emission such as synchrotron emission from galaxies, faint portions of radio lobes or even relic lobes of radio galaxies. We present the detection of such emission associated with galaxies found in the images of the clusters A689 and RXJ0439.0+0715.
4.3.1 A disk galaxy and a radio galaxy with faint lobes
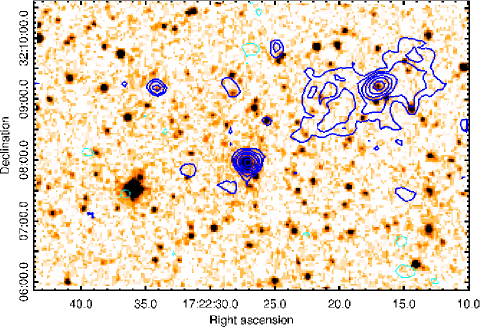
In the field of view of the cluster RXJ0439.0+0715, east of the center, a patch of diffuse emission was detected at 610 and 235 MHz. The NVSS survey also detects this source, however, with a resolution of , it is not resolved. Overlay of the radio image on the Digitized Sky Survey R-band image revealed the presence of the galaxy NGC1633 at location of the diffuse patch (Fig. 4, left). NGC1633 is a spiral galaxy at a redshift of 0.016642 (De Vaucouleurs et al. 1991, RC3.9). Since there is no compact source detected in higher resolution images made at 610 and 235 MHz, this diffuse emission is most likely synchrotron emission from the disk of the galaxy. The largest linear size of the emission detected at 610 MHz is 16 kpc. The flux densities at 610 and 235 MHz estimated using primary beam corrected images are mJy and mJy, respectively. A spectral spectral index of 0.8 is implied.
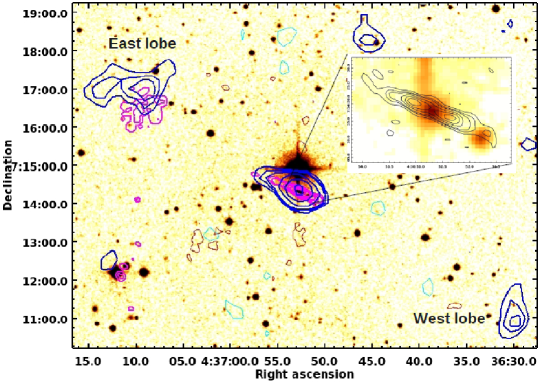
About west of the center of this cluster field another interesting source was noticed. The NVSS source NVSSJ043652+071420, is resolved at 610 and 235 MHz to reveal a radio galaxy with jets oriented in the direction northeast – southwest (Fig. 4, right). The core is coincident with a galaxy detected in the UKIRT Infra Red Survey (Fig. 4, right). The flux densities at 610 and 235 MHz of the core region are mJy and mJy, respectively, indicating a self-absorption. Also along the same northeast – southwest direction, two diffuse sources are detected in the 235 MHz image. We propose that these are ‘lobes’ associated with the radio galaxy. The angular separations of the ‘lobes’ from the core are (eastern lobe) and (western lobe). The eastern lobe is also detected in the 610 MHz image. The western lobe is at the edge of the 610 MHz field of view, in a region with poor sensitivity, and thus cannot be detected. No jets connecting these lobes to the core are detected. These lobes are not detected in the NVSS due to their low brightness. The high resolution (uniform weighted) images at 610 and 235 MHz resolve out the lobes, confirming their diffuse nature. There are no obvious optical or infra-red counterparts to these. The diffuse lobes, due to their locations relative to the central double, are likely to be lobes of the radio galaxy, also possibly from a previous activity. We did not find any identification or redshift information of the host galaxy.
4.3.2 A complex blend of radio sources and a galaxy filament?
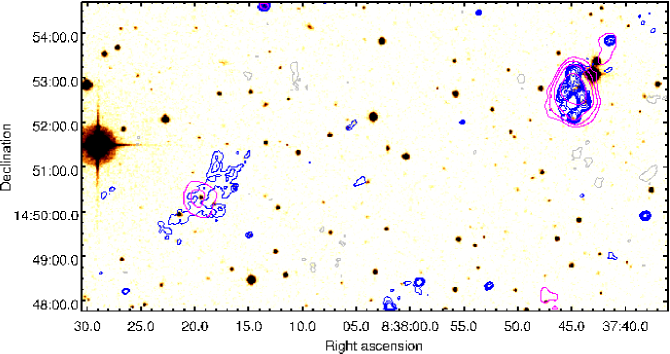
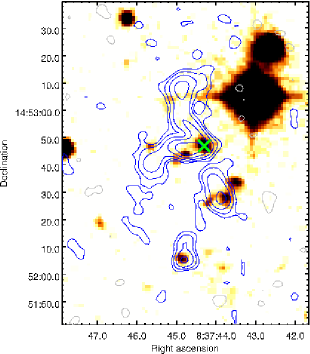
Toward the southeast of the center of the field A689, two radio sources with complex morphologies were detected. A complex blend of radio sources and a filament of diffuse emission are detected and southeast of the cluster center, respectively (Figs. 9).
The complex blend of radio sources consists of three distinct radio galaxies (Fig. 5). A galaxy cluster WHLJ083744.3+145247 with a photometric redshift 0.2875 is co-spatial with these galaxies (Wen et al. 2009, 2010). No X-ray source is known at this location. The hosts of the radio galaxies are likely members of this cluster. The northernmost source is a narrow angle tailed (NAT) radio galaxy. There are two other radio sources with unresolved (cores) and resolved components (tails) to the south of the NAT (Fig. 5, right). A bridge of radio emission connecting the southern source and the eastern tail of the NAT is also seen at both 610 and 235 MHz. The bends in the jets of these radio galaxies in the north or northeast direction may be indicators of the ram pressure exerted by the surrounding medium.
The diffuse emission further southeast of the radio galaxy complex is detected in both 610 and 235 MHz images (Figs. 5, 9). The source NVSS J083816+14505 is co-spatial with the northwest portion of the diffuse emission. A few galaxies are detected in the Sloan Digitized Sky Survey (SDSS) at the location of the diffuse emission. It is possible that the diffuse emission is a blend of the emission from these individual galaxies. No redshift information is available for the SDSS galaxies. Deeper radio observations of this region are required to map the morphology of this emission. Determination of the redshifts of the galaxies in this region will enable to estimate the linear extent of the diffuse emission.
5 Upper limits
Firm upper limits on the detections of radio halos in these clusters are an important part of this survey. With the non-detections of radio halos in the 11 clusters, we proceeded to the step of determining the upper limits. We followed a procedure for placing firm upper limits on the flux density of extended emission that was used in the GRHS (Brunetti et al. 2007, V08). The procedure consists of introducing simulated (fake) radio halos of a given size and brightness in the uv-data and then re-imaging the data. Use of radio images over a wide range of resolutions is made in establishing the upper limit. The typical rms noise in low resolution images is reported in Table 3.
5.1 Radio halos
A fake radio halo of 1 Mpc diameter, which is the typical size of giant radio halos, was chosen for injection. It was modeled using optically thin concentric spheres to match the average profile of well studied radio halos (Brunetti et al. 2007, V08). The task ‘UVMOD’ was used to add the model to the uv-data. The new uv-data were used to make image and the detection of the fake radio halo was examined in it. Fake radio halos with flux densities at 610 MHz over a range of 3 - 20 mJy were injected in the data sets. For those with data at 325 MHz the flux densities of the injected halos were scaled with a spectral index of . The upper limits obtained on the detection of a 1 Mpc diameter radio halo are listed in Table 3. Following the earlier works (V08), a spectral index of was assumed to estimate the radio upper limit at 1.4 GHz.
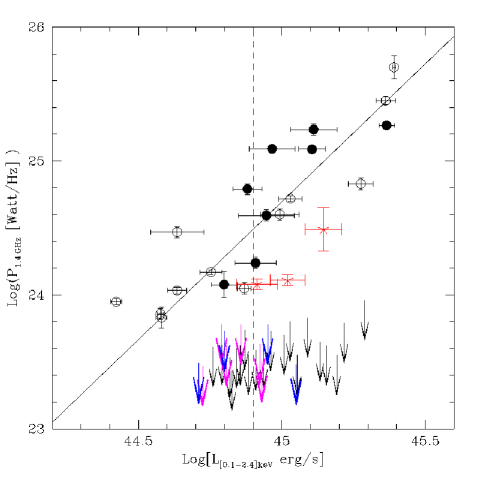
The upper limits obtained here are plotted in the P1.4GHz – plane (blue and magenta arrows, Fig. 6). The old upper limits (black arrows), the giant radio halos (filled and open black points) and the correlation line obtained from these giant radio halos shown in the plot are reproduced from Brunetti et al. (2009). The red asterisks are the known ultra-steep spectrum giant radio halos in the GRHS sample, namely, A697 (V08 Macario et al. 2010), A521 (Brunetti et al. 2008; Dallacasa et al. 2009) and A1300 (Venturi et al. 2013). The filled points, the red points and the upper limits together provide a view of the GRHS+EGRHS sub-sample in this plane.
From the known radio halos, there are indications that the more powerful radio halos tend to also be the most extended in linear size (Cassano et al. 2007; Murgia et al. 2009; Giovannini et al. 2009). Of course the morphologies of radio halos are complex in most cases and the measure of the extent of radio halo is not robust. We obtained radio halo size as expected from the relation between the halo radius and the expected radio power in order to carry out injections. These expected sizes differed from the size of 1 Mpc by with only 3 clusters showing differences . In the three extreme cases, namely, RXJ0439.0+0520, A2261 and A2485, we injected radio halos with the expected sizes of 0.84, 1.22 and 0.82 Mpc respectively. The upper limits in A2261 and A2485 are 8 mJy and 5 mJy respectively. The upper limit in RXJ0439.0+0520 did not change. We report the upper limits obtained using 1 Mpc injections in Fig. 6 and Table 3.
5.2 Mini-halos
Radio mini-halos are diffuse radio sources found in a fraction of cool-core clusters, surrounding the central galaxy. We extracted cool core clusters from the GRHS and EGRHS samples. The cool core clusters were identified using conditions based on central entropy ( keV cm2), cooling time ( Gyr) and luminosity ratio (333Ratio of core X-ray luminosity to the luminosity within (Cassano et al. in prep.). ). The central entropy and cooling time limits adopted here are standard criteria to identify cool cores (e.g. Bauer et al. 2005; Cavagnolo et al. 2009; Rossetti et al. 2011). The luminosity ratio is an additional property which is often used to identify cool core clusters (e.g. Santos et al. 2008; Cassano et al. 2010). Five clusters from the GRHS, namely, RXJ1532.9+3201, A2667, RXCJ1115.8+0129, Z2089 and Z2701, and two clusters from the EGRHS, namely, RXJ0439.0+0520 and Z348, were identified as cool core clusters using the three criteria. A mini-halo is detected in RXJ1532.9+3201 (Sec. 4.2). The cluster A689 from the EGRHS sample is also a cool core cluster. However, as a reliable upper limit on radio halo detection could not be obtained due to a bright central source, it was excluded, also from the analysis of mini-halo upper limits.
The injection model profile that we used, is the same as that for radio halos but scaled to a maximum size of 500 kpc. The observed profiles of some mini-halos are similar to those of radio halos while some are more centrally peaked (Murgia et al. 2009). Therefore the model profile adopted here is not the most accurate choice. However, it is useful to put conservative upper limits since the scaled structure of radio halos is more difficult to detect than possible mini-halos. The model profile was injected in the 610 MHz uv-data of each of the five clusters and upper limits were obtained (Table 3). The cluster A2667 was excluded due to the presence of a radio galaxy near its center. The newly obtained upper limits and the known mini-halos, namely, RXCJ1504.1-0248 (Giacintucci et al. 2011), A1835 (Govoni et al. 2009) , Z7160 (V08), RXJ1532.9+3021 and A2390 (Bacchi et al. 2003) from the GRHS sample and Ophiucus, A2029 (Govoni et al. 2009), Perseus (Sijbring 1993), RXCJ1347.5-1145 (Gitti et al. 2007) and RBS797 (Gitti et al. 2006) from the literature are plotted in the - plane (Fig. 7, left). The mini-halos in A2626 (Gitti et al. 2004), A2142 (Giovannini & Feretti 2000) and MRC0116+111 (Bagchi et al. 2009) listed in literature (e.g. Feretti et al. 2012) are not included 444A2626: nature of diffuse emission is uncertain (S. Giacintucci private communication); A2142: there is evidence for Mpc-scale radio halo (Rossetti et al. 2013, Farnsworth et al. submitted); MRC0116+111: an upper limit on the X-ray luminosity is available. in the plot.
6 Discussion
This paper presents the EGRHS sample and the results from the analysis of radio data on 12 clusters. Sensitive radio images of the cluster fields at 610/235/325 MHz were obtained (Fig. 1 and Appendix 1). Cluster scale diffuse emission such as radio halo, relic or mini-halo are not detected in 11 of these clusters. We used the method of radio halo model profile injection to estimate upper limits on the detections of radio halos in these clusters. This method was also applied to estimate upper limits on the detections of mini-halos in a sub-sample of cool-core clusters extracted from the GRHS and the EGRHS samples.
The mini-halo in the cluster RXJ1532.9+3021 is detected at 610 MHz. A small scale relic is suspected in Z348, but requires further confirmation. We also reported instances of detections of diffuse emission associated with individual galaxies in two of the cluster fields. Synchrotron emission from a disk galaxy and a radio galaxy with faint lobes were detected in the image of RXJ0439.0+0715. In the field of A689, a blend of radio galaxies and a patch of diffuse emission were detected.
We discuss the implications of these results to the understanding of the radio halos, relics and mini-halos in galaxy clusters.
6.1 Fractions of radio halos and mini-halos
The major goal of the GRHS+EGRHS surveys is to estimate the occurrence of diffuse radio emission in galaxy clusters. We revise the statistics presented in V08 based on the information on 35 galaxy clusters available then. Out of the full sample of 67 clusters (GRHS+EGRHS), we now have information (presence of radio halo or upper limit) on 48 clusters based on the analysis of our GMRT data, archival (VLA or GMRT) data and the literature information. Among these 48 clusters, 11 are host to giant radio halos555A2744 (Govoni et al. 2001), A209 (V07), A521 (Brunetti et al. 2008), A1300 (Reid et al. 1999), A2163 (Herbig & Birkinshaw 1994; Feretti et al. 2001), RXCJ (V07), A520 (Govoni et al. 2001), A697 (V08), A773 (Govoni et al. 2001), A1758a (Giovannini et al. 2006), A2219 (Bacchi et al. 2003) are the 11 giant radio halos. The nature of the radio halo in RXCJ (Feretti et al. 2005, V07) is uncertain.. The fraction of radio halos is thus, 666Error is estimated assuming Poisson statistics.. Following V08 and Brunetti et al. (2009), we divided the sample in two X-ray luminosity bins, namely, low luminosity bin, erg s erg s-1 and high luminosity bin, erg s-1 (see Fig. 6, vertical dashed line). 29 clusters out of the total 48 belong to the high luminosity bin. Of the 11 radio halos, 9 are hosted in the high luminosity clusters. Thus, the fraction of radio halos in high luminosity clusters is . This fraction is consistent with , obtained from the sub-sample of 35 clusters in V08. The fraction of radio halos in the lower luminosity bin is, . These fractions refer to the GRHS+EGRHS samples that are selected based on X-ray luminosity. However, the X-ray lumonisity depends on factors such as the dynamical properties of the cluster and the cluster mass. We point out that the derived occurrence of radio halos may change when the occurrence with respect to the cluster temperature and/or mass is considered (e.g. Cassano et al. in prep.).
We attempt to estimate the mini-halo fraction in the extracted sub-sample of cool-core clusters. A total of 5 mini-halos are detected so far in the GRHS+EGRHS samples and 5 upper limits are obtained. The fraction of mini-halos is in cool-core clusters, indicating their common occurrence in cool-cores.
6.2 Non-detections and cluster dynamics
The lack of the detections of radio halo/relics in the 11 clusters underlines the rarity of these sources. The clusters with known radio halos and relics provide strong evidence that dynamical disturbances in the clusters play an important role in the generation of radio halos and relics. Based on the GRHS sample it has been found that radio halos occur in clusters that show higher levels of disturbance than the clusters without radio halos (Cassano et al. 2010). We searched the literature and carried out a visual examination of the X-ray images of these clusters to find out about their dynamical states. The visual examination of the X-ray images shows that most of these clusters have no major signatures of disturbances (Fig. 1). Circularly symmetric or elliptical morphologies with strong or weak central peak are seen in the X-ray images of A689, RXJ0439.0+0520, RXJ0439.0+0715, A267, Z348, A2261 and RXCJ0437.1+0043. The clusters A1576, RXJ0142.0+2131, RXCJ1212.3-1816 and A2485 show relatively disturbed morphologies in X-rays, however have low X-ray luminosities ( erg s-1). These properties are similar to those of other merging systems with low X-ray luminosities that have been found to be radio-quiet (without radio halos/relics) (Cassano et al. 2010; Russell et al. 2012). The only two clusters in this sub-sample with erg s-1, namely A689 and A2261, qualify to be cool cores based on their properties. Quantitative studies of the dynamics in these clusters will be pursued to understand the non-detections of diffuse radio emission in these clusters.
The ICM can also be disturbed by the AGN in the cluster centers via feedback mechanism (see McNamara & Nulsen 2007, for a review). The central AGN during its cycles of activity produces jets and lobes that can excavate ‘cavities’ in the ICM (e.g. Clarke et al. 1997; McNamara et al. 2001). From the radio images, it is seen that 7 clusters (out of the 11), namely, A1576, RXJ0439.0+0520, RXJ0439.0+0715, RXJ0142.0+2131, A689, A2261 and Z348, have a strong central radio source (Fig. 1). The central source in A1576 shows indications of a core and jets. In other clusters higher resolution observations are required to find whether the central sources have structure. On a simple visual examination of the X-ray images, we do not find the presence of obvious cavities in these clusters. This is in line with the fact that the central sources are compact or confined to the galactic scales. Three of these clusters with central radio sources, namely, RXJ0439.0+0520, Z348 and A689, are confirmed cool core clusters. On the other hand, the clusters A267, RXCJ0437.1+0043, RXCJ1212.3-1816 and A2485, that have very weak/ no central radio sources are not cool core clusters. These observations support the idea that cool cores are more likely to have a central AGN active in radio (e.g. Sun 2009). A detailed examination of the X-ray images and the radio sources in these clusters are required to obtain further information about the state of their ICM.
6.3 The - correlation
A scaling between the radio power of radio halos and the X-ray luminosities of the clusters is known (Liang et al. 2000; Cassano et al. 2006, 2007). The upper limits obtained in this paper for the 10 clusters are factors of 3 to 20 below the expected radio power based on the correlation (Fig. 6). The bimodality in the distribution of the clusters in this plane suggests that radio halos are transient sources connected with merging clusters (e.g. Brunetti et al. 2009; Cassano et al. 2010).
The bimodality in the - plane is an important constraint for the theoretical models. In the turbulent re-acceleration model, the MHD turbulence generated in the ICM due to mergers is responsible for the acceleration of particles (e.g. Brunetti et al. 2009). The lifetime of a radio halo depends strongly on the level of turbulence in the cluster (e.g. Cassano & Brunetti 2005; Brunetti et al. 2009). Therefore when the strength of turbulence falls, the radio halo fades rapidly. The bimodality in the plane can be explained as an outcome of this phenomenon. The key predictions and observables have been recently reproduced in a high resolution MHD simulation of the re-acceleration of cosmic ray electrons by turbulence in cluster mergers (Donnert et al. 2013). In the case of secondary electron models the presence of cosmic ray protons is expected in all clusters and no abrupt change in the level of injection of relativistic electrons can be expected (e.g. Miniati et al. 2001; Dolag & Enßlin 2000). Bimodality has been qualitatively accounted for in secondary electron models by assuming amplification of magnetic fields in merging clusters as opposed to relaxed clusters (Kushnir et al. 2009; Keshet & Loeb 2010). However, this is disfavoured by rotation measure studies of galaxy clusters (Bonafede et al. 2011, and references therein). There are also recent attempts to reconcile bimodality and secondary models based on the assumptions that cosmic ray protons stream at super-Alfvenic speeds in relaxed systems (Enßlin et al. 2011).
The occurrence of USSRHs is one of the expectations of the turbulent re-acceleration model (e.g. Cassano et al. 2006). The three USSRHs are found to occupy the region between the upper limits and the correlation in the - plane (Fig. 6). We note here that the upper limits at 1.4 GHz have been scaled from those at 610 MHz, assuming a spectral index of 1.3. If a steeper spectral index such as 1.5 or more is used then the upper limits will be factors of 1.5 or more deeper. Therefore the relative position of the USSRHs and the upper limits needs to be interpreted with caution. The dual frequency data opens up a possibility of the detection of USSRHs. With the sensitivities that are achieved at 235 and 610 MHz, we can infer that radio halos of spectral indices 1.8 or steeper would be detectable with our 235 MHz observations. Systematic radio surveys such as the EGRHS are necessary in order to populate the plane and provide constraints to the theoretical models. In addition to the surveys, characterisation of the spectra of the radio halos needs to be carried out using sensitive multi-wavelength observations (e.g. Venturi et al. 2013).
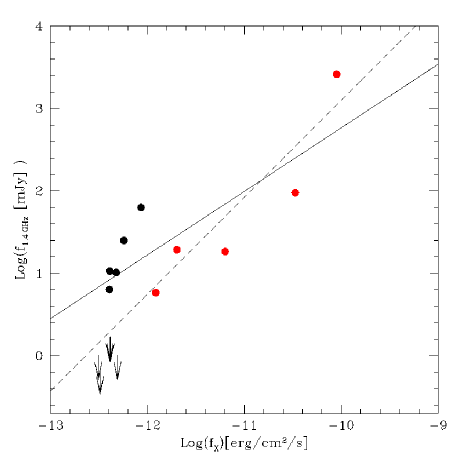
Radio mini halos and their occurrence in galaxy clusters are less explored. Based on the cool-core sub-sample of clusters from the GRHS and EGRHS, we find that of cool core clusters have a mini-halo. A possible scaling between the radio power of mini-halo and the X-ray luminosity was reported by Cassano et al. (2008) based on 6 mini-halos known then. The combination of GRHS and the EGRHS offers a larger sample to study the statistics of mini-halos. We used literature data on mini-halos and the upper limits estimated in this work to examine the scaling between the radio power of mini-halos and the X-ray luminosity of the cluster (Fig. 7, left).
The best fit line using only mini-halo detections has a slope of (solid line). With the inclusion of upper limits, the best fit has a slope of (dashed line)777This was estimated through the parametric EM algorithm as implemented in the ASURV package (Isobe et al. 1986).. Since the correlation is consistent with a slope , we test the reliability of this result by evaluating the presence of a correlation in the flux-flux space (Fig. 7, right). We find a clearer correlation in the flux-flux plane with a best fit slope of (solid line), where only mini-halo detections are considered. The presence of an even clear scaling in the flux-flux plane strengthens the hypothesis that there is an intrinsic scaling between the radio power of mini-halo and the X-ray luminosity. However, there is a large scatter in the correlation. It may be explained as a result of the differences in the properties within the population of mini-halos. Unlike the radio halos, mini-halos show a large scatter in their average radio emissivities (power per unit volume) (Murgia et al. 2009) indicating a heterogenous population. However due to small statistics (only 10 mini-halos), the properties need to be confirmed by future data.

7 Summary and conclusions
The EGRHS is an extensive radio survey of massive galaxy clusters with keV erg s-1 in the redshift range 0.2-0.4. It is an extension of the GRHS survey (V07, V08). In this paper we presented the EGRHS sample and first results based on the radio data analysis. The EGRHS sample consists of 17 galaxy clusters, which combined with the GRHS (V08) makes a sample of 67 galaxy clusters. These clusters are being systematically surveyed in radio band in order to study the statistical properties of the diffuse radio emission in galaxy clusters.
The main results of this paper are summarized below:
-
1.
Radio images with rms noise in the range 45 - 80 Jy beam-1 at 610 MHz, 0.25 - 0.40 mJy beam-1 at 325 MHz and 0.55 – 1.8 mJy beam-1 at 235 MHz were obtained. Single or dual frequency images of 12 clusters are presented in this paper.
-
2.
The 610 MHz image of the newly detected mini-halo in the GRHS cluster RXCJ1532.9+3021 is presented (Giacintucci et al., in prep.). No cluster-scale diffuse emission associated with the remaining 11 clusters were detected. A small scale ( kpc) relic is suspected in the cluster Z348. The X-ray images of these clusters and the information in the literature about the dynamical states were examined. None of these 11 clusters show extreme merger signatures combined with high X-ray luminosities.
-
3.
The method of injection of model radio halos was used to obtain firm upper limits on 10 clusters (A1576, RXJ0439.0+0520, RXJ0439.0+0715, RXJ0142.0+2131, A267, Z348, A2261, RXCJ0437.1+0043, RXCJ1212.3-1816 and A2485); reliable upper limit for the cluster A689 could not be obtained due to the presence of a strong source at its center.
-
4.
The new upper limits are plotted in the – plane and are found to be factors 3 - 20 times below the expected radio power based on the correlation. The fraction of radio halos in the EGRHS+GRHS sample analysed so far is . This fraction is in the clusters with high X-ray luminosities ( erg s-1) and in the clusters with lower X-ray luminosities ( erg s-1).
-
5.
From the GRHS sample and the EGRHS clusters presented here, a sub-sample of 7 cool core clusters was identified using the criteria based on central entropy, central cooling time and luminosity ratio. The method of obtaining upper limits based on model injection is extended to mini-halos. Upper limits on the detection of mini-halos were obtained for 5 cool core clusters (RXCJ1115.8+0129, Z2089, Z2701, RXJ0439.0+0520 and Z348). The plot of – for mini-halos, including the data from literature, is presented. There is an indication of a correlation which needs to be confirmed by future data. In the GRHS+EGRHS cool-core sub-sample, the fraction of mini-halos is found to be .
-
6.
Detections of low brightness, extended radio emission, not related to the clusters themselves but detected in the sensitive radio images presented here are also reported. We have detected emission from a disk galaxy (NGC 1633) and possible diffuse lobes of a radio galaxy in the field of the cluster RXJ0439.00715. A complex blend of radio galaxies and a diffuse filament are detected in the field of A689.
The results on the remaining clusters in the EGRHS sample and the statistics of radio halos and mini-halos based on the full sample will be presented in a future work.
Acknowledgements.
We thank the staff of the GMRT who have made these observations possible. GMRT is run by the National Centre for Radio Astrophysics of the Tata Institute of Fundamental Research. This research has made use of the NASA/IPAC Extragalactic Database (NED) which is operated by the Jet Propulsion Laboratory, California Institute of Technology, under contract with the National Aeronautics and Space Administration. We have made use of the ROSAT Data Archive of the Max-Planck-Institut fur extraterrestrische Physik (MPE) at Garching, Germany. This research has made use of data obtained from the High Energy Astrophysics Science Archive Research Center (HEASARC), provided by NASA’s Goddard Space Flight Center. SG acknowledges the support of NASA through Einstein Postdoctoral Fellowship PF0-110071 awarded by the Chandra X-ray Center (CXC), which is operated by SAO. This work is partially supported by PRIN-INAF2008 and by FP-7-PEOPLE-2009-IRSES CAFEGroups project grant agreement 247653. GM acknowledges financial support by the “Agence Nationale de la Recherche” through grant ANR-09-JCJC-0001-01.References
- Ackermann et al. (2010) Ackermann, M., Ajello, M., Allafort, A., et al. 2010, ApJ, 717, L71
- Akamatsu & Kawahara (2011) Akamatsu, H. & Kawahara, H. 2011, ArXiv e-prints
- Akamatsu et al. (2011) Akamatsu, H., Takizawa, M., Nakazawa, K., et al. 2011, ArXiv e-prints
- Bacchi et al. (2003) Bacchi, M., Feretti, L., Giovannini, G., & Govoni, F. 2003, A&A, 400, 465
- Bagchi et al. (2009) Bagchi, J., Jacob, J., Gopal-Krishna, et al. 2009, MNRAS, 399, 601
- Barr et al. (2005) Barr, J., Davies, R., Jørgensen, I., Bergmann, M., & Crampton, D. 2005, AJ, 130, 445
- Barr et al. (2006) Barr, J., Jørgensen, I., Chiboucas, K., Davies, R., & Bergmann, M. 2006, ApJ, 649, L1
- Basu (2012) Basu, K. 2012, MNRAS, 421, L112
- Bauer et al. (2005) Bauer, F. E., Fabian, A. C., Sanders, J. S., Allen, S. W., & Johnstone, R. M. 2005, MNRAS, 359, 1481
- Blasi & Colafrancesco (1999) Blasi, P. & Colafrancesco, S. 1999, Astroparticle Physics, 12, 169
- Böhringer et al. (2004) Böhringer, H., Schuecker, P., Guzzo, L., et al. 2004, A&A, 425, 367
- Böhringer et al. (2000) Böhringer, H., Voges, W., Huchra, J. P., et al. 2000, ApJS, 129, 435
- Bonafede et al. (2011) Bonafede, A., Govoni, F., Feretti, L., et al. 2011, A&A, 530, A24
- Bourdin et al. (2013) Bourdin, H., Mazzotta, P., Markevitch, M., Giacintucci, S., & Brunetti, G. 2013, ApJ, 764, 82
- Brunetti et al. (2012) Brunetti, G., Blasi, P., Reimer, O., et al. 2012, MNRAS, 426, 956
- Brunetti et al. (2009) Brunetti, G., Cassano, R., Dolag, K., & Setti, G. 2009, A&A, 507, 661
- Brunetti et al. (2008) Brunetti, G., Giacintucci, S., Cassano, R., et al. 2008, Nature, 455, 944
- Brunetti et al. (2001) Brunetti, G., Setti, G., Feretti, L., & Giovannini, G. 2001, MNRAS, 320, 365
- Brunetti et al. (2007) Brunetti, G., Venturi, T., Dallacasa, D., et al. 2007, ApJ, 670, L5
- Buote (2001) Buote, D. A. 2001, ApJ, 553, L15
- Cassano & Brunetti (2005) Cassano, R. & Brunetti, G. 2005, MNRAS, 357, 1313
- Cassano et al. (2004) Cassano, R., Brunetti, G., & Setti, G. 2004, Journal of Korean Astronomical Society, 37, 589
- Cassano et al. (2006) Cassano, R., Brunetti, G., & Setti, G. 2006, MNRAS, 369, 1577
- Cassano et al. (2007) Cassano, R., Brunetti, G., Setti, G., Govoni, F., & Dolag, K. 2007, MNRAS, 378, 1565
- Cassano et al. (2010) Cassano, R., Ettori, S., Giacintucci, S., et al. 2010, ApJ, 721, L82
- Cassano et al. (2008) Cassano, R., Gitti, M., & Brunetti, G. 2008, A&A, 486, L31
- Cavagnolo et al. (2009) Cavagnolo, K. W., Donahue, M., Voit, G. M., & Sun, M. 2009, ApJS, 182, 12
- Chandra et al. (2004) Chandra, P., Ray, A., & Bhatnagar, S. 2004, ApJ, 604, L97
- Clarke et al. (1997) Clarke, D. A., Harris, D. E., & Carilli, C. L. 1997, MNRAS, 284, 981
- Dahle et al. (2002) Dahle, H., Kaiser, N., Irgens, R. J., Lilje, P. B., & Maddox, S. J. 2002, ApJS, 139, 313
- Dallacasa et al. (2009) Dallacasa, D., Brunetti, G., Giacintucci, S., et al. 2009, ApJ, 699, 1288
- Dennison (1980) Dennison, B. 1980, ApJ, 239, L93
- Dolag & Enßlin (2000) Dolag, K. & Enßlin, T. A. 2000, A&A, 362, 151
- Donnert et al. (2013) Donnert, J., Dolag, K., Brunetti, G., & Cassano, R. 2013, MNRAS, 429, 3564
- Ebeling et al. (2000) Ebeling, H., Edge, A. C., Allen, S. W., et al. 2000, MNRAS, 318, 333
- Ebeling et al. (1998) Ebeling, H., Edge, A. C., Bohringer, H., et al. 1998, MNRAS, 301, 881
- Enßlin et al. (2011) Enßlin, T., Pfrommer, C., Miniati, F., & Subramanian, K. 2011, A&A, 527, A99
- Enßlin et al. (1998) Enßlin, T. A., Biermann, P. L., Klein, U., & Kohle, S. 1998, A&A, 332, 395
- Feretti et al. (2001) Feretti, L., Fusco-Femiano, R., Giovannini, G., & Govoni, F. 2001, A&A, 373, 106
- Feretti et al. (2012) Feretti, L., Giovannini, G., Govoni, F., & Murgia, M. 2012, A&A Rev., 20, 54
- Feretti et al. (2005) Feretti, L., Schuecker, P., Böhringer, H., Govoni, F., & Giovannini, G. 2005, A&A, 444, 157
- Giacintucci et al. (2011) Giacintucci, S., Markevitch, M., Brunetti, G., Cassano, R., & Venturi, T. 2011, A&A, 525, L10
- Giacintucci et al. (2008) Giacintucci, S., Venturi, T., Macario, G., et al. 2008, A&A, 486, 347
- Gilmour et al. (2009) Gilmour, R., Best, P., & Almaini, O. 2009, MNRAS, 392, 1509
- Giovannini et al. (2009) Giovannini, G., Bonafede, A., Feretti, L., et al. 2009, A&A, 507, 1257
- Giovannini & Feretti (2000) Giovannini, G. & Feretti, L. 2000, New A, 5, 335
- Giovannini et al. (2006) Giovannini, G., Feretti, L., Govoni, F., Murgia, M., & Pizzo, R. 2006, Astronomische Nachrichten, 327, 563
- Gitti et al. (2004) Gitti, M., Brunetti, G., Feretti, L., & Setti, G. 2004, A&A, 417, 1
- Gitti et al. (2002) Gitti, M., Brunetti, G., & Setti, G. 2002, A&A, 386, 456
- Gitti et al. (2006) Gitti, M., Feretti, L., & Schindler, S. 2006, A&A, 448, 853
- Gitti et al. (2007) Gitti, M., Ferrari, C., Domainko, W., Feretti, L., & Schindler, S. 2007, A&A, 470, L25
- Govoni et al. (2001) Govoni, F., Feretti, L., Giovannini, G., et al. 2001, A&A, 376, 803
- Govoni et al. (2009) Govoni, F., Murgia, M., Markevitch, M., et al. 2009, A&A, 499, 371
- Herbig & Birkinshaw (1994) Herbig, T. & Birkinshaw, M. 1994, in Bulletin of the American Astronomical Society, Vol. 26, American Astronomical Society Meeting Abstracts, 1403
- Hlavacek-Larrondo & Fabian (2011) Hlavacek-Larrondo, J. & Fabian, A. C. 2011, MNRAS, 413, 313
- Isobe et al. (1986) Isobe, T., Feigelson, E. D., & Nelson, P. I. 1986, ApJ, 306, 490
- Jaffe (1977) Jaffe, W. J. 1977, ApJ, 212, 1
- Jeltema et al. (2005) Jeltema, T. E., Canizares, C. R., Bautz, M. W., & Buote, D. A. 2005, ApJ, 624, 606
- Jeltema & Profumo (2011) Jeltema, T. E. & Profumo, S. 2011, ApJ, 728, 53
- Jones (2012) Jones, T. W. 2012, JApA, 33
- Kale et al. (2012) Kale, R., Dwarakanath, K. S., Bagchi, J., & Paul, S. 2012, MNRAS, 426, 1204
- Kang et al. (2012) Kang, H., Ryu, D., & Jones, T. W. 2012, ApJ, 756, 97
- Keshet & Loeb (2010) Keshet, U. & Loeb, A. 2010, ApJ, 722, 737
- Kushnir et al. (2009) Kushnir, D., Katz, B., & Waxman, E. 2009, J. Cosmology Astropart. Phys., 9, 24
- Liang et al. (2000) Liang, H., Hunstead, R. W., Birkinshaw, M., & Andreani, P. 2000, ApJ, 544, 686
- Macario et al. (2010) Macario, G., Venturi, T., Brunetti, G., et al. 2010, A&A, 517, A43
- Macario et al. (2013) Macario, G., Venturi, T., Intema, H. T., et al. 2013, ArXiv e-prints
- Markevitch (2010) Markevitch, M. 2010, ArXiv e-prints
- Mazzotta & Giacintucci (2008) Mazzotta, P. & Giacintucci, S. 2008, ApJ, 675, L9
- McNamara & Nulsen (2007) McNamara, B. R. & Nulsen, P. E. J. 2007, ARA&A, 45, 117
- McNamara et al. (2001) McNamara, B. R., Wise, M. W., Nulsen, P. E. J., et al. 2001, ApJ, 562, L149
- Miniati et al. (2001) Miniati, F., Ryu, D., Kang, H., & Jones, T. W. 2001, ApJ, 559, 59
- Murgia et al. (2009) Murgia, M., Govoni, F., Markevitch, M., et al. 2009, A&A, 499, 679
- Ogrean & Brüggen (2012) Ogrean, G. A. & Brüggen, M. 2012, ArXiv e-prints
- Okabe et al. (2010) Okabe, N., Takada, M., Umetsu, K., Futamase, T., & Smith, G. P. 2010, PASJ, 62, 811
- Petrosian (2001) Petrosian, V. 2001, ApJ, 557, 560
- Petrosian & East (2008) Petrosian, V. & East, W. E. 2008, ApJ, 682, 175
- Pfrommer & Enßlin (2004) Pfrommer, C. & Enßlin, T. A. 2004, A&A, 413, 17
- Pinzke et al. (2013) Pinzke, A., Oh, S. P., & Pfrommer, C. 2013, ArXiv e-prints
- Reid et al. (1999) Reid, A. D., Hunstead, R. W., Lemonon, L., & Pierre, M. M. 1999, MNRAS, 302, 571
- Rossetti et al. (2011) Rossetti, M., Eckert, D., Cavalleri, B. M., et al. 2011, A&A, 532, A123
- Rossetti et al. (2013) Rossetti, M., Eckert, D., De Grandi, S., et al. 2013, ArXiv e-prints
- Roy et al. (2010) Roy, J., Gupta, Y., Pen, U.-L., et al. 2010, Experimental Astronomy, 28, 25
- Russell et al. (2012) Russell, H. R., McNamara, B. R., Sanders, J. S., et al. 2012, MNRAS, 423, 236
- Russell et al. (2011) Russell, H. R., van Weeren, R. J., Edge, A. C., et al. 2011, MNRAS, 417, L1
- Santos et al. (2008) Santos, J. S., Rosati, P., Tozzi, P., et al. 2008, A&A, 483, 35
- Sarazin et al. (2012) Sarazin, C. L., Finoguenov, A., & Wik, D. R. 2012, ArXiv e-prints
- Sijbring (1993) Sijbring, D. 1993, Ph.D. Thesis, Groningen
- Slee et al. (2001) Slee, O. B., Roy, A. L., Murgia, M., Andernach, H., & Ehle, M. 2001, AJ, 122, 1172
- Sun (2009) Sun, M. 2009, ApJ, 704, 1586
- van Weeren et al. (2010) van Weeren, R. J., Röttgering, H. J. A., Brüggen, M., & Hoeft, M. 2010, Science, 330, 347
- Venturi et al. (2007) Venturi, T., Giacintucci, S., Brunetti, G., et al. 2007, A&A, 463, 937
- Venturi et al. (2008) Venturi, T., Giacintucci, S., Dallacasa, D., et al. 2008, A&A, 484, 327
- Venturi et al. (2013) Venturi, T., Giacintucci, S., Dallacasa, D., et al. 2013, A&A, 551, A24
- Wen et al. (2009) Wen, Z. L., Han, J. L., & Liu, F. S. 2009, ApJS, 183, 197
- Wen et al. (2010) Wen, Z. L., Han, J. L., & Liu, F. S. 2010, ApJS, 187, 272
- ZuHone et al. (2013) ZuHone, J. A., Markevitch, M., Brunetti, G., & Giacintucci, S. 2013, ApJ, 762, 78
| Name | RAJ2000 | DECJ2000 | z | LX (0.1–2 keV) | Notes |
| erg s-1 | |||||
| A68 | 00 36 59.4 | +09 08 30 | 0.254 | 9.47 | |
| Z348 | 01 06 50.3 | +01 03 17 | 0.254 | 6.23 | |
| RXJ0142.02131 | 01 42 03.1 | +21 30 39 | 0.280 | 6.41 | |
| A267 | 01 52 52.2 | +01 02 46 | 0.230 | 8.57 | |
| RXJ0439.00715 | 04 39 01.2 | +07 15 36 | 0.244 | 8.37 | |
| RXJ0439.00520 | 04 39 02.2 | +05 20 43 | 0.208 | 5.30 | |
| A520 | 04 54 19.0 | +02 56 49 | 0.203 | 8.84 | Radio halo2 |
| A689 | 08 37 29.7 | +14 59 29 | 0.279 | 19.68 | |
| Z1953 | 08 50 10.1 | +36 05 09 | 0.373 | 23.46 | |
| Z3146 | 10 23 39.6 | +04 11 10 | 0.290 | 17.26 | |
| Z5247 | 12 34 17.3 | +09 46 12 | 0.229 | 6.32 | |
| A1576 | 12 36 49.1 | +63 11 30 | 0.302 | 7.20 | |
| A1722 | 13 19 43.0 | +70 06 17 | 0.327 | 10.78 | |
| A1835 | 14 01 02.0 | +02 51 32 | 0.252 | 24.48 | Mini-halo3 |
| A2146 | 15 56 04.7 | +66 20 24 | 0.234 | 5.62 | No halo4 |
| RXJ2129.60005 | 21 29 37.9 | +00 05 39 | 0.235 | 11.66 | |
| A2552 | 23 11 33.1 | +03 38 07 | 0.301 | 10.07 | |
| RXCJ0437.1+0043 | 04 37 10.1 | +00 43 38 | 0.284 | 8.99 | |
| RXCJ1212.31816 | 12 12 18.9 | -18 16 43 | 0.269 | 6.20 | |
| A2261 | 17 22 28.3 | +32 09 13 | 0.224 | 11.31 | |
| A2485 | 22 48 32.9 | -16 06 23 | 0.247 | 5.10 | |
| RXJ1532.9+3021 | 15 32 54.2 | 30 21 11 | 0.345 | 16.48 | , Mini-halo5 |
| Cluster | Freq. | Beam | rms |
|---|---|---|---|
| (MHz) | , PA (∘) | mJy beam-1 | |
| Abell 1576 | 610 | , | 0.08 |
| 235 | , | 0.55 | |
| Abell 689 | 610 | , | 0.08 |
| 235 | , | 0.85 | |
| RXJ0439.0+0520 | 610 | , | 0.05 |
| 235 | , | 1.8 | |
| RXJ0439.0+0715 | 610 | , | 0.06 |
| 235 | , 60.4 | 0.75 | |
| RXJ0142.0+2131 | 610 | , 88.2 | 0.05 |
| 235 | , 54.2 | 1.3 | |
| Abell 267 | 610 | , 70.6 | 0.07 |
| Z348 | 610 | , -13.7 | 0.065 |
| Abell 2261 | 610 | , 76.0 | 0.08 |
| 235 | , | 0.45 | |
| RXCJ0437.1+0043 | 325 | , 82.0 | 0.25 |
| RXCJ1212.3-1816 | 325 | , 10.4 | 0.40 |
| Abell 2485 | 325 | , 36.2 | 0.25 |
| RXJ1532.9+3021 | 610 | , | 0.04 |
| Cluster | z | rmsa | S610MHz | Log ( |
| Name | mJy b-1 | mJy | W Hz-1 ) | |
| Abell 1576 | 0.302 | 0.09 | 6 | 23.78 |
| RXJ0439.0+0520 | 0.208 | 0.06 | 7 | 23.47 |
| RXJ0439.0+0715 | 0.244 | 0.07 | 7 | 23.63 |
| RXJ0142.0+2131 | 0.280 | 0.07 | 5 | 23.62 |
| Abell 689b | 0.279 | 0.10 | - | - |
| Abell 267 | 0.230 | 0.15 | 6 | 23.50 |
| Z348 | 0.254 | 0.13 | 9 | 23.78 |
| Abell 2261 | 0.224 | 0.06 | 6 | 23.48 |
| RXCJ0437.1+0043c | 0.284 | 0.25 | 7 | 23.78 |
| RXCJ1212.3-1816c | 0.269 | 0.40 | 7 | 23.73 |
| Abell 2485c | 0.247 | 0.25 | 7 | 23.64 |
| RXCJ1115.8+0129 | 0.350 | 0.045 | 2 | 23.45 |
| Z2089 | 0.234 | 0.045 | 5 | 23.44 |
| Z2701 | 0.214 | 0.075 | 3 | 23.13 |
| Z348 | 0.254 | 0.13 | 3 | 23.30 |
| RXJ0439.0+0520 | 0.208 | 0.06 | 5 | 23.33 |
| Abell 2667d | 0.226 | 0.10 | - | - |
Appendix A Radio images of the cluster fields
The radio images of the clusters up to the virial radius are presented here. Natural weights were used to make these images.