Photometric evolution, orbital modulation and progenitor of Nova Mon 2012
Abstract
We present and discuss accurate and densely mapped lightcurves of the neon Nova Mon 2012, supplemented by the evolution in Stromgren and bands and in the integrated flux of relevant emission lines. Our monitoring started with the optical discovery of the nova (50 days past the first detection in gamma-rays by Fermi-LAT) and extend to day +270, well past the end of the super-soft phase in X-rays. The nova was discovered during the nebular decline, well past and the transition to optically thin ejecta. It displayed very smoothly evolving lightcurves. A bifurcation between and light-curves took place at the start of the SSS phase, and a knee developed toward the end of the SSS phase. The apparent magnitude of the nova at the unobserved optical maximum is constrained to +2.84.2. The appearance, grow in amplitude and then demise of a 0.29585 (0.00002) days orbital modulation of the optical brightness was followed along the nova evolution. The observed modulation, identical in phase and period with the analog seen in the X-ray and satellite ultraviolet, has a near-sinusoidal shape and a weak secondary minimum at phase 0.5. We favor an interpretation in terms of super-imposed ellipsoidal distortion of the Roche lobe filling companion and irradiation of its side facing the WD. Similar lightcurves are typical of symbiotic stars where a Roche lobe filling giant is irradiated by a very hot WD. Given the high orbital inclination, mutual occultation between the donor star and the accretion disk could contribute to the observed modulation. The optical+infrared spectral energy distribution of Nova Mon 2012 during the quiescence preceeding the outburst is nicely fitted by a early K-type main-sequence star (K3V) at 1.5 kpc distance, reddened by =0.38, with a WD companion and an accretion disk contributing to the observed blue excess and moderate H emission. A typical early K-type main-sequence star with a mass of 0.75 M⊙ and a radius of 0.8 R⊙, would fill its Roche lobe for a P=0.29585 day orbital period and a more massive WD companion (as implied by the large Ne overabundance of the ejecta).
keywords:
Stars: novae1 Introduction
Nova Mon 2012 was discovered by S. Fujikawa on 2012 Aug 9.81 UT when it was just emerging from conjunction with the Sun, only briefly observable low on the eastern horizon at dawn. First spectroscopic quick looks reported in CBET 3202 suggested the nova had aleardy significantly evolved past maximum brightness. Cheung et al. (2012a) noted the position of the nova was consistent with that of Fermi J0639+0548, being within the preliminary 68% confidence LAT error circle radius of 0.12 deg (statistical uncertainty only). Fermi J0639+0548 was a new gamma-ray transient in the Galactic plane, detected by Fermi Large Area Telescope from 2012 June 22 to 24, when its proximity with the Sun prevented observations on that area of the sky from the ground or with X-ray satellites. The positional proximity and the temporal compatibility, prompted Cheung et al. (2012) to suggest that Nova Mon 2012 was observed as Fermi J0639+0548 at the time of initial outburst. A similar association between a classical nova and a gamma-ray source was proposed on firmer basis for Nova Sco 2012 (Cheung et al. 2012b), and firmly established for the 2010 outburst of V407 Cyg (Abdo et al. 2010). There are no other known classical or recurrent novae associated to transient gamma-ray sources.
The tentive link of Nova Mon 2012 with Fermi J0639+0548 boosted the interest in this object. The first detailed optical observations were presented by Munari et al. (2012a) that observed the nova between Aug 16.14 and Aug 20.13 and presented accurate photometry and absolutely fluxed high resolution Echelle spectroscopy, indicating the nova suffers from modest interstellar +0.30 reddening, evolving through its early nebular phase, with double peaked emission line profiles characterized by FWHM ranging from 2010 to 3035 km/s. The radial velocity of interstellar absorption lines constrained between 1 and 2 kpc the distance to the nova. At later times, Munari (2013) found Nova Mon 2013 to be a Neon nova from the marked over-abundance of Ne in the spectra, dominated by [NeIII], [NeIV] and [NeV] emission lines, which indicates that the white dwarf is massive and of the ONe type. Nelson et al. (2012a) observed the nova with Swift on Aug 19 and found its spectrum to be hard and highly absorbed, with the majority of the counts having energies above 2 keV. Other X-ray observations taken on Sept 12 were reported by Ness et al. (2012) that indicated a thinning of the self-absorption by the ejecta and a variability in the flux level. Chomiuk et al. (2012) reported about VLA radio detection of the nova on June 30, well before optical rediscovery, and its subsequent rise in radio brightness. Combined with the eruption date of the Fermi source taken as the time of ejection, the radio data constrain to 1.4 kpc the distance to the nova. Further radio data were presented by Fuhrmann et al. (2012). Greimel et al. (2012) noted how the progenitor of Nova Mon 2012 was detected by IPHAS in 2004, well before the outburst, as a star of =17.9, =+0.69 with mild H line emission and short term variability. The combined optical IPHAS and infrared UKIDSS colors appear consistent with those of an early K-type star and +0.30, requiring instead a much larger reddening if the fit was attempted with an optically thick accretion disk dominating at all wavelengths.
O’Brien et al. (2012), obtained on Sept 18 interferometric images with the European VLBI Network that resolved Nova Mon 2012 into two distinct sources separated by 35 mas. If these components were associated with material ejected in the explosion supposed to have occoured at the time of the eruption of the Fermi source, the separation indicates an angular expansion of 0.4 mas/day. Super-soft X-ray emission was eventually detected by Nelson et al. (2012b) for the first time on Swift observations for November 11, in addition to the still present hard component, and found to be highly variable on a short time scale by Li and Kong (2012). Page et al. (2013a) reported about a rapid and deep decline of the SSS component during February 2013, and Page et al. (2013b) about the complete disappearance of the SSS component by early March 2013.
Infrared photometric and spectroscopic observations were reported by Banerjee et al. (2012), Varricatt et al. (2012), and Banerjee et al. (2013). They traced high ionization emission lines from November 2012 to January 2013 and confirmed the FWHM of emission lines found earlier in the optical. The rate of brightness decline in bands was similar to that of optical bands. Banerjee et al. (2013), by comparing the 2MASS and UKIDSS data for the progenitor of Nova Mon 2012, found variability in quiescence (0.5 mag amplitude), and suggested that excess in WISE longer wavelength colors indicates the presence of an extended dusty envelope around the progenitor. To account for the initial production of gamma-rays, Banerjee et al. proposed that the donor star in Nova Mon 2012 is a cool giant.
In this paper we discuss the photometric evolution of Nova Mon 2012 in broad bands, narrow Stromgren and bands, and in the integrated flux of optical emission lines from the discovery to after the end of the SSS phase. The orbital modulation and its variation with wavelength and time are discussed, together with the irradiation of the donor star during the SSS phase and subsequent evolutionary stages. The nature of the progenitor and the distance to the system are derived by combining pre-outburst optical and infrared photometry with the orbital period and evidence of Roche lobe filling conditions.
2 Observations
photometry of Nova Mon 2012 was obtained with three of the telescopes operated by ANS Collaboration (N. 30, 36 and 61). Technical details of this network of telescopes running since 2005, their operational procedures and sample results are presented by Munari et al. (2012b). Detailed analysis of the photometric performances and measurements of the actual transmission profiles for all the photometric filter sets in use is presented by Munari and Moretti (2012). All measurements on Nova Mon 2012 were carried out with aperture photometry, the long focal length of the telescopes and the absence of nearby contaminating stars not requiring the use of PSF-fitting. All photometric measurements were carefully tied to a local photometric sequence extracted from the APASS survey (Henden et al. 2013) and ported to the Cousin and Stromgren systems following transformation equations of Munari (2012). The photometric sequence was selected to densely cover a color range larger than displayed by the nova during its evolution. The sequence was intensively tested during the whole observing campaing for linearity of color equations and for absence of intrinsic variability of any of its constituent stars. The use of the same, high quality photometric comparison sequence for all the involved telescopes and for all observations of the nova ensued the highest internal homogeneity of the collected data. The median value of the total error budget (defined as the quadratic sum of the Poissonian error on the nova and the formal error of the transformation from the local to the standard system as defined by the local photometric sequence) is 0.007 mag for , 0.006 in , 0.007 in , 0.008 in , and 0.008 mag for , 0.008 in , and 0.009 in . Colors and magnitudes are obtained separately during the reduction process, and are not derived one from the other.
![[Uncaptioned image]](/html/1306.1501/assets/x2.png)
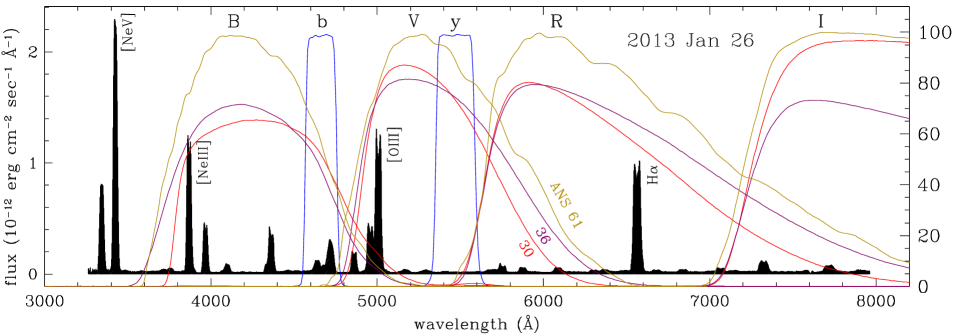
Spectroscopic observations of Nova Mon 2012 have been obtained with three different telescopes. High resolution Echelle spectra were provided by Asiago 1.82m telescope operated by the National Institute of Astrophysics (INAF), and by ANS Collaboration 0.6m telescope operated by Schiaparelli Observatory in Varese. Low resolution spectra were obtained with the B&C spectrograph mounted on the Asiago 1.22m telescope of the University of Padova. All spectra were obtained in long slit mode, with the slit rotated to the parallactic angle, and about 2 arcsec in width. All spectra were calibrated into absolute fluxes, by observing immediately before and after the nearby standard stars HR 1578 and HR 2315. The high accuracy of the fluxes were checked against the nearly simultaneous, daily optical photometry. Over the 3900-6800 Å range, the error of the relative fluxes in the finally reduced spectra does not exceed a few percent, and the error of the global zero point never exceeds 7%. A log of the spectroscopic observations is presented in Table 1. In this paper the spectra will be used for two main purposes: (a) extract convolved -band Stromgren photometry that trace the flux of the emission in the continuum between the emission lines, (b) measure the integrated flux of selected emission lines. The information about the profiles of emission lines, their evolution with time and how they constrain the geometry of the ejecta has been used by Ribeiro et al. (2013) in their 3D modeling of Nova Mon 2012 ejecta, and other information extracted from these spectra will be used by Chomiuk et al. (2013) to support the interpretation and modeling of the radio evolution. One of the low resolution spectra we obtained is used as a reference background to Figure 1.
3 Merging individual lightcurves
Local realizations of a standard photometric system include different atmospheric and filter transmission, detector sensitivity, efficiency of the optics, etc. On normal stars (like those making the photometric comparison sequence) all these effects are collectively corrected for by the usual transformation equations, provided that the local realization is sufficiently close to the standard system, which is ensured by the photometric filters having transmission profiles and the detector a wavelength dependent sensityvity close to those used in defining the standard system. The spectra of novae, expecially during advanced decline, when they are strongly dominated by broad and intense emission lines, are completely different from the black-body like spectra of normal field stars, and the transformation equations can only partially compensate for the differences between the local and the standard systems. The situation is illustrated in Figure 1, where the measured transmission profiles for the actual filter sets used with the adopted ANS telescopes are over-plotted to a spectrum of Nova Mon 2012 obtained during the advanced decline (for details on how the transmission of filters of all ANS telescope are measured and monitored over time see Munari and Moretti 2012). These filters come from different manufacturers and are both of the multi-layer dielectric type (Astrodon brand for ANS telescope N.61) and the classical sandwich of colored glasses (Custom for telescope N.36, and Schuler for N.30), built according to the standard recipe of Bessell (1990). It’s obvious from Figure 1 how different filter sets transmit different relative amounts of continuum and emission line flux.
The light-curves of the same nova obtained with different telescopes will therefore show offsets among them, and these offsets will be time-dependent following the spectral evolution of the nova, characterized by smooth and monotonic trends in (1) the contrast between emission lines and underlying continuum, and (2) the relative intensity of the emission lines. The closest representation of the true light-curve appears to be a proper combination of different individual light-curves, effectively averaging over different local realizations of the same standard system. To combine them into a merged light-curve, we adopt the LMM method introduced by Munari et al. (2013) when dealing with the light-curves of the recent supernovae SN 2011fe in M101, SN 2012aw in M95, and SN 2012cg in NGC 4424. In short, we assume that all individual light-curves from different telescopes are exactly the same one, affected only by an offset in the ordinate zero-point and a linear stretch of the ordinates around a pivot point:
where mag is the -th magnitude value in the photometric band from the -th telescope, mag is the corresponding value in the merged light-curve, is the amount of zero-point shift and is coefficient of the linear stretching around the pivot point. The stretch is therefore a linear function of time difference with the reference epoch.
The optimal values for , and are derived by a minimization of the difference between the observed points and those defining the merged light-curve:
| (2) |
where sums over the different telescopes, over the individual measurements of each telescope, and is the total error budget of each measurement. Notice that the LMM method to construct a merged light-curve from observations obtained with different telescopes does not stretch the resulting light-curve in flux, nor time, and does not individually alter any single observational point.
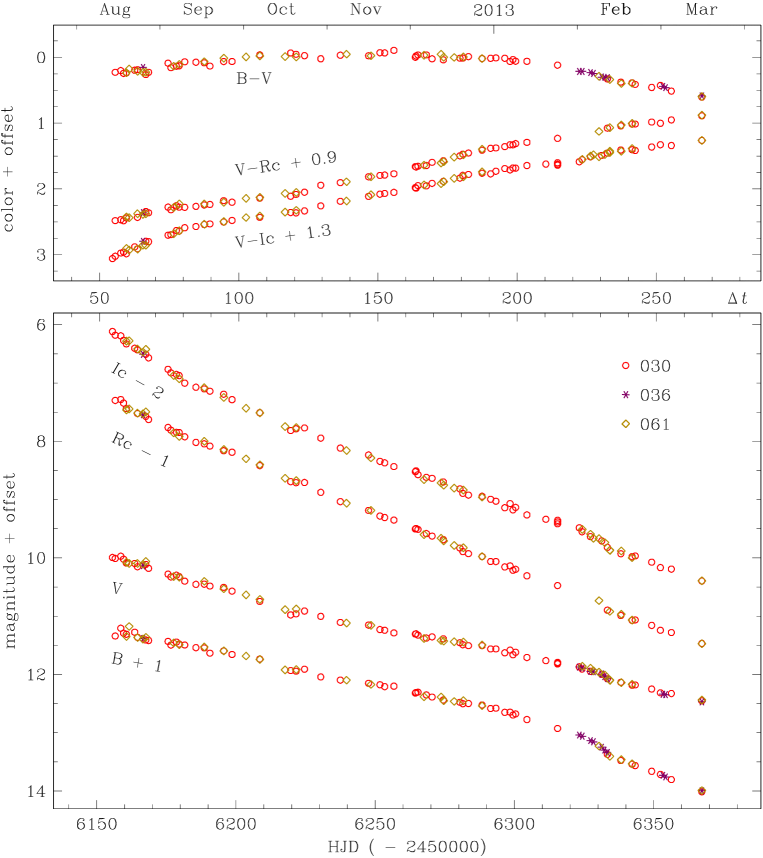
Our merged photometry of Nova Mon 2013 from the three ANS telescopes is listed in Table 2 and presented in the Figure 2.
![[Uncaptioned image]](/html/1306.1501/assets/x3.png)
4 Photometric evolution
4.1 Broad bands
The photometric evolution of Nova Mon 2012 shown in Figure 2 is one of the smoothest ever recorded, at least until the development of the knee at the beginning of February 2013. The very low amplitude noise, which is visible at an amplitude appreciably larger than the 0.007 mag total error budget of the measurements, is due to the superimposed 7.1 hr period modulation that will be discussed in the next section and which appear to be orbital in origin. The earliest points in the light-curve of Figure 2 are noisier because the nova was at that time observed very low on the horizon, in pre-dawn twilights soon after emergence from the conjunction with the Sun.
At the time of the discovery at optical wavelengths, on day +48 from initial appearance in gamma-rays, the nova was already well into its nebular stage, with [OIII] of an intensity similar to H (Munari et al. 2012a). Fitting with synthetic or observed light-curves does not constrain the magnitude of the unobserved maximum. As shown in Figure 2, the nebular portion of the light-curve is close to a straight line and any fit would slip along it. We can however work out some lower limit to brightness at maximum. The transition from optically thick to optically thin conditions occurs about mag=3.5 mag below maximum brightness. Thus the characteristic time (the time required to decline by 3 mag below maximum brightness) must have been significantly shorter than 48 days. Adopting =0.30, a distance of 1.5 kpc as constrained by the progenitor (see sect.6 below), and averaging over Schmidt (1957), Pfau (1976) and de Vaucouleurs (1978) relations for absolute magnitude at maximum as function of (cf. also della Valle 1991), the apparent magnitude of Nova Mon 2012 at maximum brightness would have been = +2.8, +3.6, +4.0 or +4.3 mag for =10, 20, 30 or 40 days, respectively, well within the nake-eye range.
The most striking feature of the broad-bands light-curves in Figure 2 is the knee that started to develop around day +230. It is simultaneously visible in , and , but not in . The flux in the latter band is largely dominated by the emission in H, which accounted for 76% of the whole flux in band at that time. The absence of a visible knee in the light-curves suggested that the emission in H continued to evolve smoothly, ignoring the occurrence of the knee. Such a sharp discontinuity in the light-curve of novae was already observed at the time of switch off of the X-ray super-soft source (attributed to the end of the nuclear burning at the surface of the WD) in the recent outbursts of V407 Cyg (Munari et al. 2011a) and U Sco (Munari et al. 2010), marking the sudden end of continued energy input by the central source to the expanding ejecta. At the same time of the appearance of the knee, the SSS component in Nova Mon 2012 was rapidly declining (Page et al. 2013a,b), even if this appeared to be a gradual though fast event and not a switch off as observed in V407 Cyg and U Sco. In addition, the amplitude in magnitude of the knee in Nova Mon 2012 is much smaller than observed in U Sco and V407 Cyg. Still, the temporal coincidence is striking, and suggests that also in Nova Mon 2012 the knee is related to a major drop of energy input to the ejecta by the declining central source. The amplitude of the knee is about 0.2 mag in and a few hundreds in and . To be detected, it requires very accurate observations, tightly monitoring the advanced decline stages with the same telescopes throughout the whole evolution, something that is rarely available for novae. We plan to contribute on future novae data of similar quality as here presented, and with time we hope to build up a statistically relevant sample to investigate the gross properties of such knees and their correlation with global properties of novae, particularly at X-rays and radio. After the knee episode was over, Nova Mon 2012 settled on a decline rate similar to that before the event.
4.2 Narrow bands
Broad band optical photometry obtained with classical Johnson-Cousins or SLOAN systems records simultaneously flux from the underlying continuum and the many superimposed emission lines. A detailed understanding of the physical processes at work would require the flux of the continuum and the emission lines to be measured separately.
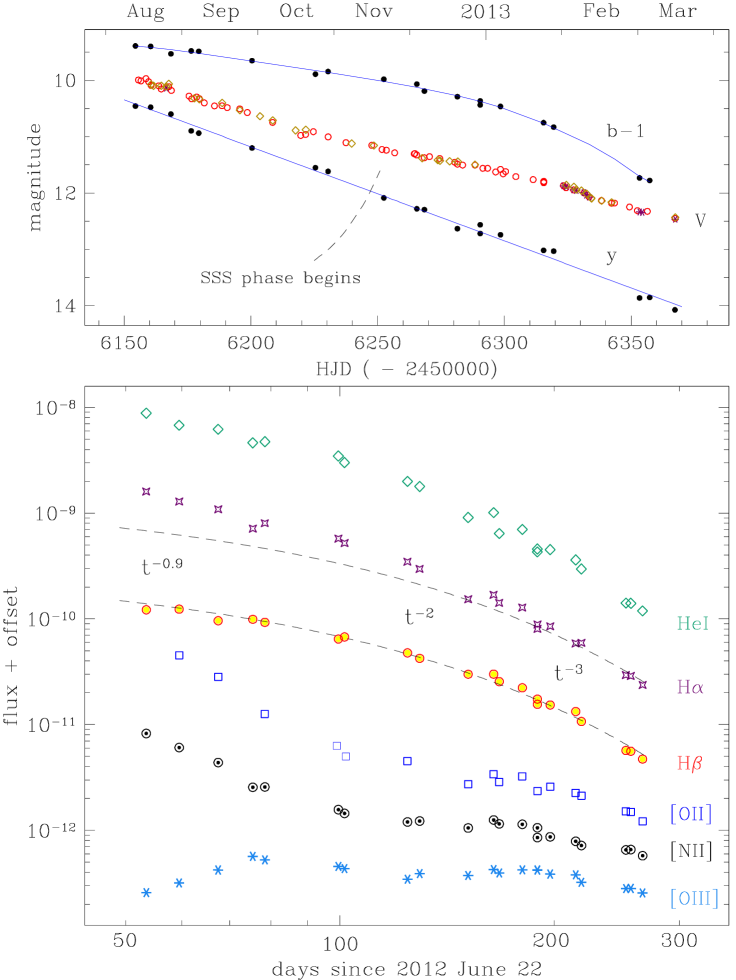
A good filter to measure the intensity of the continuum with minimal interference from emission lines is the band of the Stromgren system. Originally defined by a classical interference filter delivering a nearly Gaussian passband, modern equivalent filters shape their transmission band through application of multi-layered coatings, which offer a much higher transmission and deliver near-rectangular passband profiles. Figure 2 shows the transmission profiles we have measured for the Stromgren and filters manufactured by Astrodon that we are just putting into operation with ANS Collaboration telescopes to monitor future novae. To anticipate and evaluate their results, we have integrated their transmission profiles on our absolutely fluxed spectra of Nova Mon 2012 (cf Table 1) and by application of Bessell (2011) flux zero points (Vega scale) transformed them into magnitudes. The Stromgren and light-curves of Nova Mon 2012 are presented in the top panel of Figure 3 where they are compared to band replicated here from Figure 2.
As Figure 2 well illustrates, filter is placed in a wavelength region deprived of significant emission lines during the nebular phase of a nova, while [OIII] 4959, 5007 Å and to a lesser extent H emission lines contribute heavily to the flux recorded through band. This accounts for the initially nearly constant offset between and bands, and their bifurcation at later times. The bifurcation between and light-curves begun in mid November 2012, in coincidence with the first detection of a super-soft component in Swift X-ray observations of Nova Mon 2012 (Nelson et al. 2012b). If filter accurately trace the continuum emission, Stromgren filter is centered on the 4640 Å blend of NIII lines (produced by Bowen fluorescence through cascade recombination requiring He II Ly seed photons) and HeII 4686 + [NeIV] 4716 Å blend, and the light-curve that it traces is more sensitive to the evolution of these lines than to the underlying continuum.
4.3 Continuum and emission lines
The lower panel of Figure 3 shows on a log-log plot the time evolution of integrated flux of some representative emission lines of Nova Mon 2012. For reference purposes, the flux evolution of the underlying continuum (as traced by the linear fit to the light-curve in the upper panel of Figure 3) is over-plotted to the evolution of H and H. The local values of the relation for the continuum are marked.
By definition, during the optically thin nebular phase the emission in the continuum comes mainly from e- recombining with ions, essentially hydrogen and helium. In a simplified geometry for the ejecta – a spherically symmetric shell with a high covering factor, finite thickness and ballistic expansion velocity –, the evolution of the index can be understood as the shifting balance between: (1) recombination of ions and free electrons, proportional to the electron density, therefore evolving like , and (2) reionization by the radiation field of the hot central star. The latter become less effective with passing time because of () decline in the luminosity of the central star (and eventually switching off of the nuclear burning at the surface), and () dilution of the radiation field caused by the continuing expansion of the ejecta. At early stages of the nebular phase observed in Nova Mon 2012, reionization was more effective in keeping up with recombination and the decline in flux was gentle (). At later times the energy input from the central star was becoming negligible in the overall energy budget of the ejecta, and the decline in flux settled onto the dilution time scale (). Actual 3D structures of the ejecta can add significant complication to this simplified scenario. Bipolar lobes, equatorial wrists, polar caps, polar jets, prolate extended volumes etc. are structures that are normally encountered in high resolution spatial imaging of nova ejecta or 3D modeling of their high resolution emission line profiles (eg. Woudt et al. 2009, Ribeiro et al. 2009, Munari et al. 2011b, Chesneau et al. 2012). Such spatial structures have different densities and expansion velocities, are illuminated differently by the central star, turn optically thin at different times, and contribute to the overall brightness by different proportions. It is worth noticing that a highly bipolar structure of the ejecta of Nova Mon 2012 is implied by high resolution radio imaging (O’Brien et al. 2012, Chomiuk et al. 2013) and by modeling of the high resolution profiles of its emission lines (Ribeiro et al. 2013).
The H emission line is produced by hydrogen recombination, which is proportional to the electron density in the same way it is the emission in the continuum. It is therefore not surprising that the temporal evolution of the continuum and H fluxes coincide in Figure 3. On the other hand, H settled onto the continuum/H temporal evolution only at later times, initially showing an extra flux component that gradually disappeared. This extra flux is probably related to ejecta’s high optical depth in hydrogen Ly. During the continuing absorption and re-emission of Ly photons, a fraction of them is splinted into H and Ly photons, and these extra H photons are in addition to those produced by hydrogen recombination. The required high optical depth in hydrogen Ly is confirmed by the strength of OI 8446 Å, which is pumped by fuorecence from hydrogen Ly. The intensity of OI 8446 Å declined in parallel with the demise of the extra flux in H.

Interestingly, HeI 5876 shows in Figure 3 a flux evolution similar to that seen in H, with a decline faster than that of H and the nebular continuum. The reason is the shifting ionization balance between HeII and HeIII, as traced by the flux ratio HeII 5412 / HeI 5876 which kept increasing with time (we cannot use HeII 4686 to trace HeIII because this line is blended with stronger [NeIV] 4716). HeII 5412 Å is produced during recombination of HeIII, and HeI 5876 during recombination of HeII, with the faster decline seen in HeI 5876 tracing the extra depletion of HeII ions caused by the increasing ionization spreading through the ejecta.
The evolution of nebular lines are exemplified in Figure 3 by [NII] 5755, [OII] 7325 and [OIII] 4959+5007 Å transitions, which are characterized by different critical electron densities for collisional de-excitation of their meta-stable upper levels, =7.5, 6.8 and 5.8 cm-3, respectively. In addition to the recombination, ionization from the central source and ionization balance, the flux of nebular lines is also governed by the time evolution of the local density. Thanks to their higher critical densities and lower ionization, [NII] 5755 and [OII] 7325 appear early in the evolution of a nova, while [OIII] has to wait for more diluted conditions and higher ionization of the ejecta to become prominent. At the time of Nova Mon 2012 discovery and first observations in Figure 3, [NII] and [OII] were already rapidly declining in intensity, while [OIII] was increasing and at an appreciably slower rate. This is due to the combined effects of (1) increasing ionization of the ejecta, with NII turning into NIII and OII to OIII, (2) nebular lines forming in the outer, lower density regions of the ejecta, where dilution of the reionizing radiation from the central star is greater and the electron density () decline faster, and (3) the fact that parts of the ejecta had an electron density already lower than the critical value for [NII] and [OII] (thus able to produce the 5755 and 7325 Å emission lines) but still higher than the critical value for [OIII] (thus suppressing the formation of 4959+5007 Å doublet).
A long lasting plateau is characteristic in Figure 3 of the late temporal evolution of nebular lines, in particular for [OIII]. The plateau is the result of two opposing effects that nearly counter-balance each other. On one side, the continuing expansion, by reducing the electron density, diminishes the number of recombinations per unit time and therefore the number of emitted photons. On the other side, the continuing expansion shifts inward in mass the boundary of critical density for collisional de-excitation of their meta-stable upper levels, thus allowing to an increasing fraction of the ejecta to emit the nebular lines. This has a kinematical consequence on the formation of the nebular line profiles. Diminishing the contribution from outer and faster moving layers of the ejecta, at the same time as emission from the inner and slower moving layers is progressively added, causes a reduction in the width of the nebular lines and a suppression of their extended wings. This is precisely what is observed, as illustrated in Figure 4 where the width at half maximum of [OIII] 5007 Å and the width at zero intensity of the [OIII] 4959+5007 Å doublet are plotted as function of time.
5 Orbital modulation
First suggestion of an orbitally modulated X-ray variability of Nova Mon 2012 was put forward by Orio et al. (2012) based on their 7-hour long integration to obtain a high-resolution X-ray grating spectrum with Chandra during the SSS phase. Osborne et al. (2012) confirmed the large and rapid variability in X-rays of Nova Mon 2012, and found in the ultraviolet Swift data a marked 0.2957 (0.0007) days periodicity with an amplitude of 0.05 mag. A similar periodicity (0.29570.0015 days) modulated the X-ray emission. Folding the X-ray and ultraviolet data shows a roughly sine-like modulation, which had a common phasing in the two wavebands. Osborne et al. (2012) attributed the modulation to a partial eclipse of extended emission by an accretion disk rim which is raised at the point of impact of the stream from the secondary star, implying that accretion disk exists at the time of super-soft emission. Wagner et al. (2013) confirmed the presence of a 0.2956 (0.0010) day periodicity in photometry obtained during 2013 January, sinusoidal in shape and with 0.13 mag full amplitude, and argued for it to be the orbital period of the system. A slightly longer period, 0.2965 0.0072 days, was derived by Hambsch et al. (2013) from optical observations obtained in early February 2013, with full amplitudes of 0.06 mag in , 0.08 in , 0.10 in and 0.13 in .
With the same three ANS telescopes used for to construct the long term photometric evolution of Figure 2 and Table 2, we carried out long nightly observing runs of Nova Mon 2012 to characterize such 7.1 hr periodicity. We splinted the campaign in three parts.
5.1 Before the SSS phase
Nelson et al. (2012b) reported that Swift observations show Nova Mon 2012 to enter the super-soft X-ray source (SSS) phase on Nov 18, 2012, i.e. on day +150 from the initial Fermi-LAT detection. This marks the time when the ejecta and the material/wind closer to the WD begin to get transparent to soft X-rays copiously emitted by the WD envelope where stable H-burning is undergoing (Krautter 2008).
The data listed in Table 2 and obtained as part of the normal nova monitoring before the start of the SSS phase on day +150, were searched for presence of the 7.1 hr after removing from them the nova decline.
Even if the data show a variability with an amplitude similar to that seen at later times, no periodicity was found, in particular around 7.1 hr. It seems that the same optically thick material close to the WD that was blocking the soft X-rays prior to day +150 was also effective in preventing optical detection of the 7.1 hr modulation, as if the central binary was orbiting interior to the optical pseudo-photosphere. This is consistent with the still modest ionization of the ejecta observed before day +150. High ionization [OIII], [NeIV], [FeVII], etc. emission lines either appeared or started to grow significantly in intensity only with the beginning of the SSS phase.
5.2 During the SSS phase
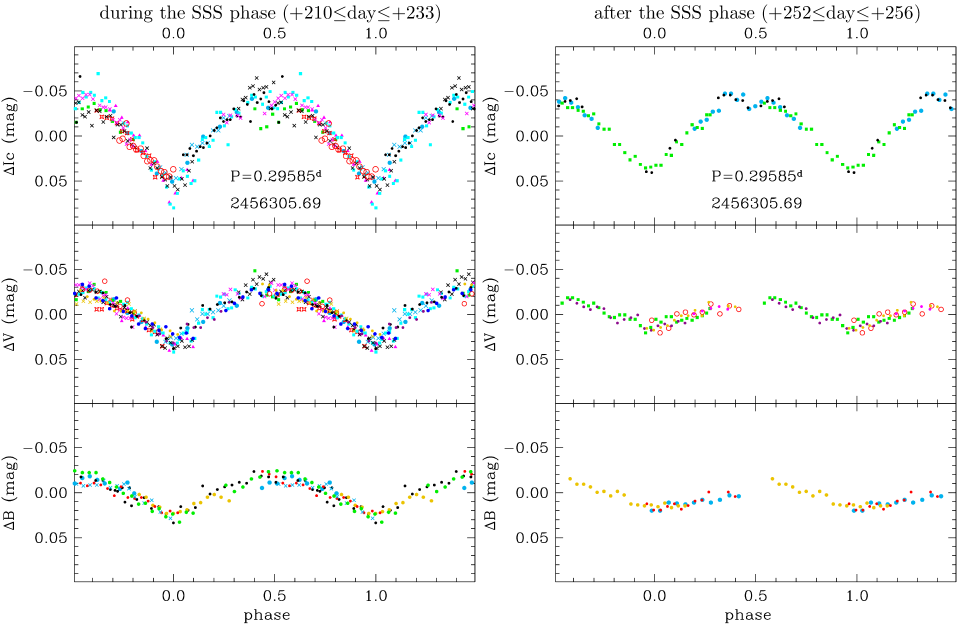
During the SSS phase, long photometric runs lasting many consecutive hours were carried out on 2013 January 18, 30, 31 and February 1, 3, 4, 7, 8, 9, 10, i.e. covering the period from day +210 to +233. After subtracting the mean value of the magnitude for the given night, we have Fourier searched the residuals and found a strong periodicity following the ephemeris:
| (3) |
The zero epoch is the same as defined by Osborne et al. (2012) and Wagner et al. (2013), and our period has an accuracy higher by two orders of magnitude. The phased data are presented in the left panel of Figure 5. The near-sinusoidal variability has a total amplitude of 0.044(0.002) mag in , 0.059(0.003) in and 0.094(0.004) in band. The exact value of the amplitude and its change with time is a critical ingredient in understanding its origin, and therefore it is important to accurately establish it. Our amplitude is smaller than reported by Wagner et al. (2013) and Hambsch et al. (2013). The reason is that they did not transform their photometry from the instantaneous local photometric system to the standard one through rigorous application of the instantaneous color equations calibrated for each frame on the photometric sequence composed by many different stars well distributed in color and magnitude. They instead limited to measure the magnitude of Nova Mon 2012 differentially with respect to one or two randomly chosen field stars. During long monitoring runs, the height above the horizon of Nova Mon 2012 changed by large margins, and the difference in the energy distribution of the nova with respect to the pair of field stars selected for the differential photometry caused large and uncontrolled drifts in the zero points. To test this scenario, we re-reduced our band data and measured Nova Mon 2012 differentially against a pair of blindly selected field stars. As expected, this introduced a spurious additional mag=0.085 variability, that combined with the real one leads to a total mag=0.13, the same amplitude reported by both Wagner et al. (2013) and Hambsch et al. (2013) for their band observations.
5.3 After the SSS phase
Following the peak brightness reached on day +193, the SSS source started a slow and monotonic decline, and by day +247 its brightness was reduced by 5 magnitudes, effectively disappearing around day +252 (2013 March 1; Page et al. 2013b). To asses the origin and location of the sources responsible for the 7.1 hr periodicity, in coincidence with the end of the SSS phase, we started a new series of long observing runs on Nova Mon 2012, with the same telescopes, observing procedures and photometric comparison sequence to ensure the highest commonality with the previous observations. The new set of observations extended from day +252 to +256, and the resulting light-curves are shown on the right panel of Figure 5.
The new data adhere strictly to the same ephemeris (Eq.3) of the older ones. The total amplitude of the variability reduced to 0.026(0.003) mag in and 0.034(0.003) in , whereas the amplitude of 0.090(0.003) in band remained essentially unchanged. A clear secondary minimum is visible at phase 0.5. It could be present also during the SSS phase (left panel of Figure 5), but available data are inconclusive.
The lightcurves of both panels of Figure 5 are particoularly smooth. Any flickering possibly associated with the mass transfert, if accretion was present at that time, contributed a negligible fraction to the total flux compared to the expanding ejecta and the irradiated donor star. The larger dispersion of points around phase 0.5 in the lightcurve of the left panel of Figure 5 could be an artifact. In fact, by chance, it happened that the last or the first observation of almost every observing run was obtained in the band and near orbital phase 0.5.
5.4 Central binary
The great stability in phasing of the 7.1 hr modulation irrespective of the SSS phase proves beyond doubt its orbital origin. The presence of the secondary minimum cleans the board from the possibility that the actual orbital period is twice longer.
The donor, an early K-type dwarf star (cf. next section), fills its Roche lobe, and the consequent ellipsoidal distortion would modulate the lightcurve with two maxima and two minima per orbital cycle. The orbiting hot WD irradiates the facing side of the K star, that reprocesses at optical wavelengths the excess radiation. The resulting lightcurve is essentially sinusoidal, with a maximum when the WD transits at inferior conjunction and the irradiated side of the K star is in full view, and a minimum when the WD is at superior conjunction and the irradiated side of the K star is hidden from view. The observed lightcurve is the combination of the two effects superimposed, the irradiation being more important at shorter wavelengths and the ellipsoidal distortion emerging at longer ones because there peaks the energy distribution of the donor star. The emergence at longer wavelengths of a secondary minimum around phase 0.5, as seen for Nova Mon 2012 in Figure 5, is regularly observed in symbiotic binaries, where a cool giant that fills its Roche lobe is irradiated by a very hot WD companion. The shape of , , and lightcurves presented by Mikolajewska et al. (2003) for the high inclination symbiotic binaries YY Her and CI Cyg are very similar to those presented in Figure 5 for Nova Mon 2012, which also is a high inclination system seen close to edge-on conditions according to Ribeiro et al. (2013).
When the SSS phase ended and the WD stopped burning hydrogen at the surface (right panel of Figure 5), its luminosity, temperature and radiation output begun to decline. This had the consequence that a lower amount of WD radiation impinged on facing side of the K star companion, which consequently declined in brightness, and this in turn meant a lower visibility of the orbitally induced modulation against the overwhelming glare of the circumstellar ejecta. The large reduction in and amplitude observed between the two observing epochs in Figure 5 is thus due to the reduced irradiation of the K star.
It may also be possible that an accretion disk, if present around the WD as suggested by Osborne et al (2012), could be (partially) occulted at primary minimum, somewhat contributing to the observed overall decline in brightness. Its transit over the irradiated side of the donor star around phase 0.5 could equally contribute to the observed secondary minimum.
Observations similar to those presented in Figure 5, and carried out after Nova Mon 2012 will re-emerge from conjunction with the Sun in September 2013, will be able to quantify the relative contribution and importance of irradiation, ellipsoidal distortion and disk occultation in shaping the orbitally modulated lightcurve. By then, in fact, the glare of the nova ejecta and the irradiation of the donor star will be greatly reduced, allowing to search for signature of disk occultation.
6 The progenitor
Banerjee et al. (2013) suggested that a common mechanism to produce gamma-rays must be at work in all the novae detected by Fermi-LAT and in RS Oph too, namely diffusive acceleration of particles across the shock front formed as a consequence of the high velocity ejecta from the nova colliding with a slow moving, extended and massive envelope, presumably created by heavy mass loss from the companion. Banerjee et al. (2013) noticed that: (1) infrared data for the progenitor suggest large pre-outburst variability: on 2000 Feb 29, 2MASS measured the progenitor at J=15.759, H=15.231 and K=15.036, whereas on October 2008 UKIDSS measured J=16.263, H=15.709 and K=15.420, and (2) WISE observations in March 2010 detected the progenitor in all four bands W1, W2, W3 and W4 (at 3.4, 4.6, 12 and 22 microns respectively) with magnitudes of 14.732, 14.740, 10.831 and 8.720 respectively. The large W2-W3 and W3-W4 colors are indicative of a large mid-IR excess that is likely to be associated with a dusty extended envelope. According to Banerjee et al. (2013), all this would imply that a cool giant is present in Nova Mon 2012, and that it is loosing mass at a high rate, leading to dust condensation in the circumstaller environment.


There are observational evidences that argue against this model for the progenitor of Nova Mon 2012.
The first one is 7.1 hr orbital period. The Roche lobe associated with such an orbital period is far too small to allocate room for a giant, a sub-giant or even a turn-off star. There is always the possibility - not forbidden by Nature - that the progenitor is a triple system, where an interacting P=7.1 hr close binary is orbited at a greater distance by a mass loosing cool giant companion. However, such ad hoc hierarchical structure should be exceeding rare to be statistically worth considering.
![[Uncaptioned image]](/html/1306.1501/assets/x10.png)
The second one is the faint magnitude in quiescence and the proximity of the progenitor. Nova Mon 2012 suffers from low reddening, as suggested by the blue color that the nova displayed (cf. Figure 2) and the intensity of the interstellar lines. From an Echelle spectrum obtained immediately after the announcement of the nova, Munari et al. (2012a) preliminary estimated a reddening =0.30 from the equivalent width of very sharp, single component NaI 5890, 5896 Å interstellar lines. As listed in Table 1, we have now at our disposal many more Echelle spectra to accurately measure the interstellar lines. An example is presented in Figure 6. The mean value (and error of the mean) for the equivalent with of NaI 5890 Å line is 0.5360.006 Å. Adopting the Munari and Zwitter (1997) calibration, this turns into a reddening =0.380.01, equivalent to an extinction of 1.2 for a standard =3.1 reddening law (Fitzgerald 1999). According to Feast et al. (1990) and the literature that they reviewed, traveling a mean distance of 1.2 kpc on the galactic plane in the Solar neighborhood accumulates an extinction of 1.2, thus Nova Mon 2012 should not be much farer out. The heliocentric radial velocity we measured for the NaI interstellar lines is 25.20.7 km/s which indicate a kinematical distance of about 1 kpc when compared with the kinematical maps of Brand & Blitz (1993). Along the line of sight to Nova Mon 2012, the radial velocity of the interstellar material present a large discontinuity between 2 and 3 kpc from the Sun, where it crosses Perseus spiral arm. No interstellar line is observed in the high resolution spectra of Nova Mon 2012 at heliocentric velocities between 10 and 30 km/sec corresponding to the crossing of the Perseus spiral arm by the line of sight. From the amount of reddening and the radial velocity of the interstellar material, the distance to Nova Mon 2012 is constrained to be 12 kpc. It is interesting to note that preliminary analysis by Chomiuk et al. (2012) of early radio data on the nova indicate a distance of about 1.4 kpc. At such short distance and low extinction, the presence in Nova Mon 2012 of any giant or sub-giant star would have boosted the quiescence magnitude at much brighter values than observed for the faint progenitor.
In Figure 7 we have plotted the spectral energy distribution (SED, corrected for =0.38) of the progenitor of Nova Mon 2012. The , , and , are mean values from multi-epoch values from USNO-B1 and IPHAS catalogs, respectively. Similarly, the , and data are the average of the values reported by 2MASS and UKIDSS. The epochs of all these measurements are all different, and in view of the variability displayed by the progenitor in quiescence (about 0.3 mag in a week according to IPHAS), combining them all into a unique SED seems the only sensible thing to do. The energy distribution is well fitted by that of a early K-type main sequence star (K2V) at a distance of 1.5 kpc (,, data from Koornneef 1983, ,, from Bessell 1990, absolute magnitudes from Sowell et al. 2007). The blue excess at and suggests the presence of an accretion disk in quiescence, in agreement with evidence from a moderate H emission seen in IPHAS pre-outburst data by Greimel et al. (2012). Trying to fit with the energy distribution of a red clump giant (K2III), the most abundant type of giant in the Galactic disk, would push the distance to beyond the outer limit of the Galactic disk and the reddening would be risen to such high values to be completely incompatible with observations. Even worst would be the results of attempting the fit with M giants and supergiants of the types hosted in V407 Cyg, RS Oph and T CrB.
We are then left with the inescapable conclusion that the donor star in Nova Mon 2012 is a main sequence, early type K star. Therefore the presence of a cool, heavy mass losing giant proposed by Banerjee et al. (2013) to explain the gamma-rays observed from Nova Mon 2012 does not fit observational evidences. Nevertheless, the infrared excess they noted in the WISE data is intriguing and should deserve further study. The level of variability they noted in the infrared is similar to the difference in magnitude comparing magnitude estimates of the progenitor on the Palomar I and II survey images. The presence of an accretion disk, the high orbital inclination and possible associated eclipses or partial occultations, the ellipsoidal distortion of the Roche lobe filling companion, and the irradiation of the secondary, could easily combine along the 7.1 hr orbital motion to account for the variability noted in quiescence.
An early K-type main sequence donor star has a mass of 0.75 M⊙ and a radius of 0.8 R⊙ (Straizys & Kuriliene 1981; Drilling & Landolt 2000). Adopting the Eggleton (1983) expression for the radius of the Roche lobe:
| (4) |
where is the mass ratio Mdonor/MWD, we found the results listed in Table 3. The condition of Roche lobe filling is well matched by the donor star, and this in turn mutually reinforce the confidence on P=0.29585 days to be the actual orbital period.
7 Acknowledgements
We would like to thank Stefano Moretti and Alessandro Maitan for their assistance in the measurement of the photometric filter transmission profiles.
References
- Banerjee, Ashok, & Venkataraman (2012) Banerjee D. P. K., Ashok N. M., Venkataraman V., 2012, ATel, 4542, 1
- Bessell (1990) Bessell M. S., 1990, PASP, 102, 1181
- Bessell (2011) Bessell M. S., 2011, PASP, 123, 1442
- Brand & Blitz (1993) Brand J., Blitz L., 1993, A&A, 275, 67
- Chesneau et al. (2012) Chesneau O., et al., 2012, A&A, 545, A63
- Cheung et al. (2012) Cheung C. C., Shore S. N., De Gennaro Aquino I., Charbonnel S., Edlin J., Hays E., Corbet R. H. D., Wood D. L., 2012, ATel, 4310, 1
- Chomiuk et al. (2012) Chomiuk L., et al., 2012, ATel, 4352, 1
- Chomiuk et al. (2013) Chomiuk L., et al., 2013, ApJ, submitted
- della Valle (1991) della Valle M., 1991, A&A, 252, L9
- de Vaucouleurs (1978) de Vaucouleurs G., 1978, ApJ, 223, 351
- Drilling & Landolt (2000) Drilling J. S., Landolt A. U., 2000, Allen’s Astrophysical Quantities, 4th ed., A.N. Cox ed., AIP Press Springer, 381
- Eggleton (1983) Eggleton P. P., 1983, ApJ, 268, 368
- Feast, Whitelock, & Carter (1990) Feast M. W., Whitelock P. A., Carter B. S., 1990, MNRAS, 247, 227
- Fitzpatrick (1999) Fitzpatrick E. L., 1999, PASP, 111, 63
- Fuhrmann et al. (2012) Fuhrmann L., et al., 2012, ATel, 4376, 1
- Fujikawa, Yamaoka, & Nakano (2012) Fujikawa S., Yamaoka H., Nakano S., 2012, CBET, 3202, 1
- Greimel et al. (2012) Greimel R., Drew J., Steeghs D., Barlow M., 2012, ATel, 4365, 1
- Koornneef (1983) Koornneef J., 1983, A&A, 128, 84
- Krautter (2008) Krautter J., 2008, in Classical Novae 2nd ed., M.F. Bode and A. Evans eds., Cambridge Astrophysics Series 43, pag. 232
- Li & Kong (2012) Li K. L., Kong A. K. H., 2012, ATel, 4614, 1
- Munari (2012) Munari U., 2012, JAVSO, 40, 582
- Munari (2013) Munari U., 2013, ATel, 4709, 1
- Munari, Dallaporta, & Castellani (2010) Munari U., Dallaporta S., Castellani F., 2010, IBVS, 5930, 1
- Munari, Dallaporta, & Valisa (2012a) Munari U., Dallaporta S., Valisa P., 2012a, ATel, 4320, 1
- Munari et al. (2011a) Munari U., et al., 2011, MNRAS, 410, L52
- Munari et al. (2011b) Munari U., Ribeiro V. A. R. M., Bode M. F., Saguner T., 2011, MNRAS, 410, 525
- Munari et al. (2012b) Munari U., et al., 2012b, BaltA, 21, 13
- Munari et al. (2013) Munari U., Henden A., Belligoli R., Castellani F., Cherini G., Righetti G. L., Vagnozzi A., 2013, NewA, 20, 30
- Munari & Moretti (2012) Munari U., Moretti S., 2012, BaltA, 21, 22
- Nelson et al. (2012a) Nelson T., Mukai K., Chomiuk L., Sokoloski J., Weston J., Rupen M., Mioduszewski A., Roy N., 2012a, ATel, 4321, 1
- Nelson et al. (2012b) Nelson T., Mukai K., Sokoloski J., Chomiuk L., Rupen M., Mioduszewski A., Page K., Osborne J., 2012b, ATel, 4590, 1
- Ness et al. (2012) Ness J.-U., Shore S. N., Drake J. J., Osborne J. P., Page K. L., Beardmore A., Schwarz G., Starrfield S., 2012, ATel, 4569, 1
- O’Brien et al. (2012) O’Brien T. J., et al., 2012, ATel, 4408, 1
- Orio & Pa (2012) Orio M., Pa B. T., 2012, ATel, 4633, 1
- Osborne, Beardmore, & Page (2013) Osborne J. P., Beardmore A., Page K., 2013, ATel, 4727, 1
- Page et al. (2013a) Page K. L., et al., 2013, ATel, 4845, 1
- Page et al. (2013b) Page K. L., et al., 2013, ApJ 768, L26
- Pfau (1976) Pfau W., 1976, A&A, 50, 113
- Ribeiro et al. (2009) Ribeiro V. A. R. M., et al., 2009, ApJ, 703, 1955
- Ribeiro et al. (2013) Ribeiro V. A. R. M., Munari U., Valisa P., 2013, ApJ, 768, 49
- Schmidt (1957) Schmidt T., 1957, ZA, 41, 182
- Shahbaz et al. (2003) Shahbaz T., Zurita C., Casares J., Dubus G., Charles P. A., Wagner R. M., Ryan E., 2003, ApJ, 585, 443
- Sowell et al. (2007) Sowell J. R., Trippe M., Caballero-Nieves S. M., Houk N., 2007, AJ, 134, 1089
- Straizys & Kuriliene (1981) Straizys V., Kuriliene G., 1981, Ap&SS, 80, 353
- Tatischeff & Hernanz (2007) Tatischeff V., Hernanz M., 2007, ApJ, 663, L101
- van den Bergh & Younger (1987) van den Bergh S., Younger P. F., 1987, A&AS, 70, 125
- Varricatt et al. (2012) Varricatt W. P., Ehle J., Wold T., Banerjee D. P. K., Ashok N. M., 2012, ATel, 4572, 1
- Waagen, Hambsch, & Buil (2012) Waagen E., Hambsch J., Buil C., 2012, CBET, 3202, 2
- Wagner, Woodward, & Starrfield (2013) Wagner R. M., Woodward C. E., Starrfield S., 2013, ATel, 4737, 1
- Warner (1995) Warner B., 1995, Cataclysmic Variable Stars, Cambridge Astrophys. Ser. 28
- Woudt et al. (2009) Woudt P. A., et al., 2009, ApJ, 706, 738