Coherent ultrafast measurement of time-bin encoded photons
Abstract - Time-bin encoding is a robust form of optical quantum information, especially for transmission in optical fibers. To read out the information, the separation of the time bins must be larger than the detector time resolution, typically on the order of nanoseconds for photon counters. In the present work, we demonstrate a technique using a nonlinear interaction between chirped entangled time-bin photons and shaped laser pulses to perform projective measurements on arbitrary time-bin states with picosecond-scale separations. We demonstrate a tomographically-complete set of time-bin qubit projective measurements and show the fidelity of operations is sufficiently high to violate the CHSH-Bell inequality by more than 6 standard deviations.
I Introduction
Qubits encoded in the time-bin degree of freedom are particularly well suited for long-distance quantum communication and fundamental experiments tittel98 ; brendel99timebin ; tittel00qcrypt ; marcikic02timebin ; marcikic2004fiftykm ; martin12 . Time-bin states can be prepared using an unbalanced interferometer franson89 ; franson91 , where photons may take a short path and arrive early () or a long one and arrive late () with a time difference greater than the photon coherence time. Measurements of time-bin states are typically performed with an identical interferometer (see Fig. 1a). However, high-fidelity measurements require that be greater than the detector time resolution, which is typically much longer than the coherence time. Experimentally, delays on the order of nanoseconds have been used tittel00qcrypt ; martin12 ; recent advances in photon counting technology could conceivably reduce this delay to 30 ps hadfield2009single . Even faster detectors would improve time-bin encodings, allowing a higher information density while reducing the demands on interferometric stabilization.
Ultrafast laser pulses and nonlinear optics provide a framework for single-photon measurement on timescales much faster than electronics shah1988ultrafast ; dayan2004tpa . A promising coherent nonlinear effect for single-photon ultrafast measurements is sum-frequency generation (SFG), a process in which two pulses interact in a nonlinear material to produce a third with frequency equal to the sum of the inputs Huang1992FreqConv ; kwiat_upconversion ; tanzilli2005photonic ; SFGent_Ramelow_2012 . SFG in conjunction with pulse-shaping techniques is a powerful tool for manipulating single-photon temporal waveforms kielpinski ; eckstein2011quantum ; lavoie12comp .
In the present work, we show how sum-frequency generation and pulse shaping enable coherent measurements of time-bin states with a temporal separation on the picosecond timescale. To explicitly demonstrate the coherent aspects of our technique, we perform a tomographically complete set of measurements on an entangled time-bin state for state reconstruction deBurghTomo ; takesue2009tomo ; Wang12tomo . Furthermore, we show that our measurement proceeds with sufficiently high fidelity to convincingly violate the CHSH-Bell inequality bell64 ; CHSH .
II Theory
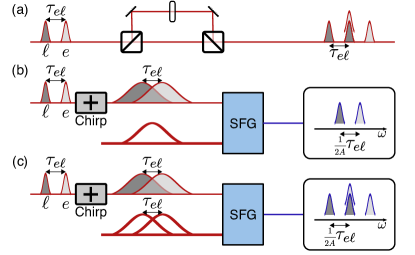
The principle of our measurement scheme is based on SFG with oppositely-chirped pulses. A chirped pulse is stretched such that its instantaneous frequency varies linearly in time. By combining two oppositely chirped pulses through SFG, the bandwidth of the resulting pulse is drastically narrowed. Additionally, by delaying one of the pulses, the central frequency of the generated light changes by an amount proportional to the delay. This has been shown for laser pulses BC_oppositechirp_1 ; BC_oppositechirp_2 and a single photon with a strong laser pulse lavoie12comp . If a pulse (or photon) is in a superposition of two time bins, it will exit the process in a superposition of two frequencies (see Fig. 1b). The process is thus a coherent interface between time and frequency. If both inputs are in superpositions of time bins with the same separation, the spectrum of the SFG output is analogous to the temporal profile of interferometric time-bin measurement, with three distinct frequencies. The middle peak results from the interference of two contributions, with an intensity proportional to the probability expected for a controllable projective measurement (see Fig. 1c).
We model our scheme by expressing the electric field of a chirped laser pulse as
| (1) |
, where is a time delay, characterizes the chirp strength, and is the spectral amplitude. We define a single photon in the early time bin as and one in the late time bin as . A time-bin qubit can be written as
| (2) |
. We can similarly define a superposition of two strong laser pulses separated in time by as
| (3) |
where and determine the relative amplitude and phase, respectively.
A strong laser pulse and a single photon with equal and opposite large chirps () produce narrowband SFG with a central frequency that depends on their relative time delay lavoie12comp . The SFG bandwidth is , where is the smaller of the two input bandwidths. Now consider SFG between a positively chirped time-bin qubit and a negatively chirped version of the classical pulse from Eq. (3). For the two contributions to the SFG from the single photon and strong laser pulse being both early or both late, the upconverted photon will be spectrally narrow with a central frequency equal to the sum of the input central frequencies. Another contribution arises from the single photon arriving early and the strong laser pulse late, which is blue-shifted to . Similarly, if the arrival order is reversed, the contribution is red-shifted to . To spectrally separate the three components, we require . Additionally, if or equivalently , the SFG at exhibits interference with an intensity of
| (4) |
This is proportional to , which is the success probability of a projective measurement onto the state , where is controlled by shape of the laser pulse from Eq. (3). This technique extends naturally to arbitrary dimensionality. See the supplementary material for more details.
III Experiment
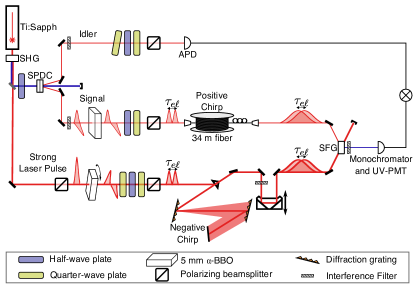
Our setup is shown in Fig. 2. A pulsed Ti:Sapphire laser (repetition rate 80 MHz, average power 2.4 W) centered at 790.2 nm with bandwidth 11.8 nm (FWHM) produces 0.8 W centered at 393.8 nm with a bandwidth of 1.2 nm through frequency doubling in bismuth borate (BiBO). The UV beam is rotated to diagonal polarization before passing through two orthogonally-oriented -barium borate (BBO) crystals to produce photon pairs via type-I down-conversion (SPDC) in the polarization state kwiat99spdc , where and are horizontal and vertical polarizations respectively. To compensate walkoff, we inserted 1 mm of -BBO into the UV beam path and 1 mm of BiBO with a cut angle of into the signal arm lavoie2009experimental . The signal is filtered to 810.4 nm with bandwidth nm FWHM, and the idler to 767.1 nm with bandwidth nm. We directly detect the signal and idler photons using avalanche photodiodes (APD, Perkin-Elmer SPCM-AQ4C). Summing the coincidence rates over all combinations yields a total of 135 kHz.
We convert the signal photon from polarization to time-bin encoding by inserting 5 mm of -BBO cut at into the signal arm such that is aligned with the extraordinary (fast) axis and project onto diagonal polarization with a polarizing beamsplitter to erase polarization information, leaving the state . The -BBO introduces a relative group delay of ps between the polarization components, measured through chirped-pulse interferometry mazurek2013dispersion . This delay is greater than the photon coherence time, ps, fulfilling the requirements for distinct time bins.
A strong laser pulse with field is prepared by sending the remaining fundamental through another 5-mm -BBO crystal, where rotation about the beam axis controls , the relative weighting of early and late components. We can control the phase between the components through the rotation of a half-wave plate between two quarter-wave plates set to . Polarization information is then removed using another polarizing beam-splitter. The phase is four times the half-wave plate angle, with an offset due to the birefringence in the system. This sequence simplifies projections onto the standard states: , , and with . To extend to arbitrary projections, the rotatable -BBO may be replaced by a rotatable half-wave plate and an -BBO set at 45 degrees.
The positive chirp of is applied to the single photons by passing through 34 m of single-mode fiber. The opposite chirp on the strong laser pulse is applied using gratings treacy1969 . The strong laser beam is then filtered to 785.7 nm with a bandwidth of nm and passed through a delay line, with average power 146 mW output. The two pulses are focused on a 1-mm BiBO crystal phase-matched for type-I SFG, producing a UV signal detected by photon counter (UV-PMT, Hamamatsu H10682-210).
IV Results
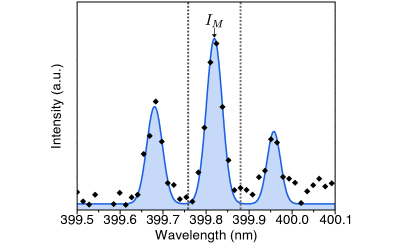
The resulting signal is sent to a fiber-coupled spectrometer (Princeton Instruments Acton Advanced SP2750A), which we use as either a monochromator for photon counting or a full spectrometer. With set to , the upconverted signal spectrum, averaged over five 90 minute runs, is seen in Fig. 3 and exhibits three distinct peaks. The middle peak, centered at nm, has a bandwidth of nm. This in reasonable agreement with the prediction of nm from the expected bandwidth corrected for our -nm spectrometer resolution lavoie12comp . The side peaks are centered at nm and nm. The average separation from the main peak nm agrees with the prediction nm calculated from the measured chirp and -BBO birefringence. The separation is sufficiently large compared to the linewidth, enabling effective filtering of the side peaks with a monochromator window of 0.11 nm.
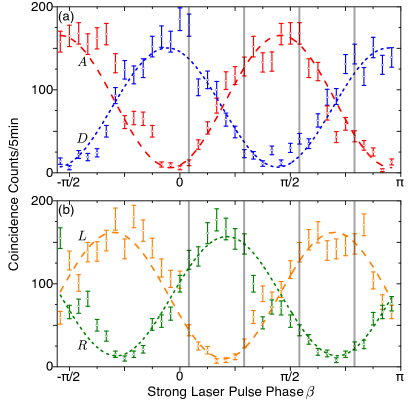
After entangled state preparation, we vary the phase of the laser pulse and record coincidences between the UV-PMT and idler APD when the idler polarization is measured as . We repeat this process for idler measurements of , , and (Fig. 4). Rates of single-photon detection events were also recorded (see supplementary materials). The coincidences oscillate sinusoidally with an average visibility among the four curves of . A subset of this data, for phases indicated by vertical lines in Fig. 4, are sufficient to test the CHSH-Bell inequality bell64 ; CHSH , written as
| (5) |
where is the correlation and are measurement settings. This inequality holds for local hidden-variable models but can be violated by entangled quantum states. We measure polarization states of the form and time-bin states of the form , where the “” and “” outcomes are assigned values +1 and -1, respectively. Choosing , , , and , the CHSH-Bell parameter was found to be , corresponding to a violation of the inequality by 6.8 standard deviations.
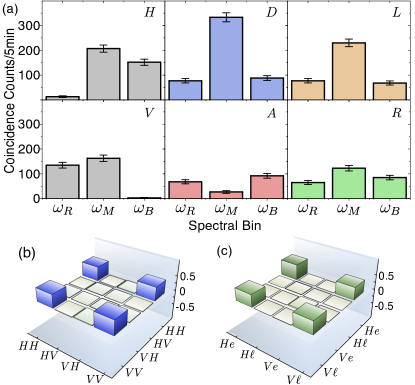
We fixed the phase of the laser pulse to and use the monochromator to select frequencies corresponding to the peaks in Fig. 3. We measured the coincidence counts between the idler for polarization measurements and the UV-PMT when the monochromator was centered on each peak. The coincidence counts for each setting and bin are shown in Fig. 5a, showing high contrast in the middle bin. Continuing this approach for different settings of and , we performed two-qubit tomography on our time-bin/polarization state using an overcomplete set of 36 measurements deBurghTomo and iterative maximum-likelihood reconstruction Jezek2003tomo . Tomography on the initial polarization state, shown in Fig. 5b, yielded a fidelity of with the Bell state . The polarization/time-bin state was detected at a rate of 1 Hz after upconversion and spectral filtering, necessitating an integration time of fifteen minutes per setting. The fidelity of the output state with the state was found to be , and the fidelity with the reconstructed density matrix of the initial polarization state was found to be (Fig. 5c). Thus, our chirped-pulse upconversion technique was able to retrieve the correlations through quantum state tomography with minimal loss of fidelity.
V Conclusion
We have demonstrated ultrafast time-bin measurements using chirped-pulse upconversion as a coherent time-to-frequency interface. We showed the control necessary to perform quantum state tomography on time-bin entangled states and sufficiently high fidelity to convincingly violate the CHSH Bell inequality. This technique operates at the fundamental limit for time-bin states where the coherence time of the light, not the time resolution of the detector, constrains the bin separation. Future work will focus on improving the efficiency of our scheme sensarn2009 and extensions to time-bin qudits, which will increase the information density of time-bin encodings.
Acknowledgements.
The authors would like to thank M.D. Mazurek, D.R. Hamel, and K. Fisher for fruitful discussions. We are grateful for financial support from NSERC, CFI, OCE, Industry Canada, and MRI ERA.References
- (1) Tittel, W., Brendel, J., Zbinden, H. & Gisin, N. Violation of bell inequalities by photons more than 10 km apart. Phys. Rev. Lett. 81, 3563–3566 (1998).
- (2) Brendel, J., Gisin, N., Tittel, W. & Zbinden, H. Pulsed energy-time entangled twin-photon source for quantum communication. Phys. Rev. Lett. 82, 2594–2597 (1999).
- (3) Tittel, W., Brendel, J., Zbinden, H. & Gisin, N. Quantum cryptography using entangled photons in energy-time bell states. Phys. Rev. Lett. 84, 4737–4740 (2000).
- (4) Marcikic, I. et al. Time-bin entangled qubits for quantum communication created by femtosecond pulses. Phys. Rev. A 66, 062308 (2002).
- (5) Marcikic, I. et al. Distribution of time-bin entangled qubits over 50 km of optical fiber. Phys. Rev. Lett. 93, 180502 (2004).
- (6) Martin, A. et al. Cross time-bin photonic entanglement for quantum key distribution. Phys. Rev. A 87, 020301 (2013).
- (7) Franson, J. D. Bell inequality for position and time. Phys. Rev. Lett. 62, 2205–2208 (1989).
- (8) Franson, J. D. Two-photon interferometry over large distances. Phys. Rev. A 44, 4552–4555 (1991).
- (9) Hadfield, R. Single-photon detectors for optical quantum information applications. Nature Photonics 3, 696–705 (2009).
- (10) Shah, J. Ultrafast luminescence spectroscopy using sum frequency generation. Quantum Electronics, IEEE Journal of 24, 276–288 (1988).
- (11) Dayan, B., Pe’er, A., Friesem, A. A. & Silberberg, Y. Two photon absorption and coherent control with broadband down-converted light. Phys. Rev. Lett. 93, 023005 (2004).
- (12) Huang, J. & Kumar, P. Observation of quantum frequency conversion. Phys. Rev. Lett. 68, 2153–2156 (1992).
- (13) VanDevender, A. P. & Kwiat, P. G. High efficiency single photon detection via frequency up-conversion. Journal of Modern Optics 51, 1433–1445 (2004).
- (14) Tanzilli, S. et al. A photonic quantum information interface. Nature 437, 116–120 (2005).
- (15) Ramelow, S. et al. Polarization-entanglement-conserving frequency conversion of photons. Phys. Rev. A 85, 013845 (2012).
- (16) Kielpinski, D., Corney, J. F. & Wiseman, H. M. Quantum optical waveform conversion. Phys. Rev. Lett. 106, 130501 (2011).
- (17) Eckstein, A., Brecht, B. & Silberhorn, C. A quantum pulse gate based on spectrally engineered sum frequency generation. Optics Express 19, 13770–13778 (2011).
- (18) Lavoie, J. et al. Spectral compression of single photons. Nature Photonics 7, 363–366 (2013).
- (19) de Burgh, M. D., Langford, N. K., Doherty, A. C. & Gilchrist, A. Choice of measurement sets in qubit tomography. Phys. Rev. A 78, 052122 (2008).
- (20) Takesue, H. & Noguchi, Y. Implementation of quantum state tomography for time-bin entangled photon pairs. Optics Express 17, 10976–10989 (2009).
- (21) Wang, S. X. et al. High-speed tomography of time-bin-entangled photons using a single-measurement setting. Phys. Rev. A 86, 042122 (2012).
- (22) Bell, J. On the Einstein-Podolsky-Rosen paradox. Physics 1, 195–200 (1964).
- (23) Clauser, J. F., Horne, M. A., Shimony, A. & Holt, R. A. Proposed experiment to test local hidden-variable theories. Phys. Rev. Lett. 23, 880–884 (1969).
- (24) Raoult, F. et al. Efficient generation of narrow-bandwidth picosecond pulses by frequency doubling of femtosecond chirped pulses. Optics Letters 23, 1117–1119 (1998).
- (25) Osvay, K. & Ross, I. N. Efficient tuneable bandwidth frequency mixing using chirped pulses. Opt. Comm. 166, 113–119 (1999).
- (26) Kwiat, P. G. et al. Ultrabright source of polarization-entangled photons. Phys. Rev. A 60, R773–R776 (1999).
- (27) Lavoie, J., Kaltenbaek, R. & Resch, K. Experimental violation of svetlichny’s inequality. New Journal of Physics 11, 073051 (2009).
- (28) Mazurek, M. D. et al. Dispersion-cancelled biological imaging with quantum-inspired interferometry. Scientific Reports 3, 1582 (2013).
- (29) Treacy, E. Optical pulse compression with diffraction gratings. Quantum Electronics, IEEE Journal of 5, 454–458 (1969).
- (30) Ježek, M., Fiurášek, J. & Hradil, Z. Quantum inference of states and processes. Phys. Rev. A 68, 012305 (2003).
- (31) Sensarn, S., Yin, G. Y. & Harris, S. E. Generation and compression of chirped biphotons. Phys. Rev. Lett. 104, 253602 (2010).
Appendix A Supplementary: Derivation of time-bin interference
We follow the approach of lavoie12comp by modeling the creation of upconverted single photons through the interaction Hamiltonian of a second-order nonlinear process as
| (1) |
We make the approximations that the input pulses are relatively narrowband, phasematching is perfect, only one photon exists in the system at a time, the second-mode input is strong (replace with complex constant ), and no frequency correlations exist between the signal and idler (for a treatment of the frequency-correlated case, see the supplementary material of lavoie12comp ).
An arbitrary single-photon time-bin state is defined in the main text as , where and respectively define a single photon in the early and late time bin. Thus we write a chirped time-bin state with bin separation as , where
| (2) |
The field of the correspondingly anti-chirped strong laser pulse is similarly defined as
| (3) |
where and are constant.
The state of the upconverted photon to first-order perturbation theory is
| (4) |
If the chirp is large (), the spectral amplitude of the upconverted single photon is
| (5) |
which can be simplified by grouping terms to,
| (6) |
From this expression, it can be seen that four contributions are made to the final spectral profile, each corresponding to one of four spectral peaks. The spectral intensity is proportional to the square of the amplitude, and can be written for each peak as
| (7) |
From this, we find the RMS width of each peak to be given by
| (8) |
By setting , we can bound the upconverted frequency as . Two of these peaks, and , have the same central frequency and differ only by a linear phase factor , while is blue-shifted to and is red-shifted to . The central frequency of each is given by
| (9) |
where , , and .
While angular frequency and bandwidths expressed in terms of RMS widths are preferable for derivations, values are generally reported in wavelengths and full-widths at half-maximum (FWHM). The central wavelength of the upconverted signal can be found as
| (10) |
with a bandwidth FWHM of
| (11) |
A projective measurement on a state of has a success probably of
| (12) |
We define the side peaks as arising from the fields and , and the middle peak as from the sum of and , with central frequencies , , and respectively. The spectral intensity of the middle peak is
| (13) | |||||
| (14) |
which can then be integrated over to find a central peak intensity of
| (15) |
The ideal visibility of the interference (for ) can be found as
| (16) |
Thus, in order to exhibit highly visible interference, the time between the bins should be much smaller than the temporal bandwidth of the output pulse, i.e. . If is sufficiently small, the intensity of the central peak can be approximated,
| (17) |
By absorbing the constant phase factor into the preparation of the strong laser pulse phase , the intensity of the central peak is found to be directly proportional to a projective measurement onto the state as long as the side peaks can be clearly distinguished.
In order to clearly distinguish the side peaks from the middle peak, it is important that they do not overlap in frequency (i.e. and more than separated from ). The following condition must be met to ensure that the peaks are clearly separable in frequency:
| (18) |
which is equivalent to stating that the delay between the two bins must be greater than the longer coherence time of the input pulses.
In summary, for ideal interference and filtering capability, the time delay between bins must satisfy
| (19) |
In our experiment, the lower bound is approximately ps and the upper bound is approximately ps. Thus, our bin separation of ps is well within the appropriate parameters.
Appendix B Supplementary: Extension to time-bin qudits
Time-bin encodings naturally extend to higher dimensions by simply adding more bins. To extend our measurement technique to higher dimensions, we similarly require more pulses in the classical beam. In doing so, photons in a certain time bin will upconvert to the central frequency only if they are upconverted by the strong laser pulse component with the same time delay.
For a time-bin qudit of dimension , we define basis states with a time delay of between them as
| (20) |
We represent an arbitrary superposition state with complex constants as
| (21) |
and set (after chirping) to be a Gaussian envelope,
| (22) |
We similarly define a strong laser pulse as before to be a superposition of classical fields with complex constants as
| (23) |
Note that we have neglected the constant time difference for simplicity.
By following the same procedure as for the two-dimensional case, we find that the upconverted pulse once again consists of numerous frequency peaks. We concentrate on the middle peak, with a field centered on , which arises when the term of the qudit field is upconverted by the strong laser pulse. This middle field can be found as
| (24) |
The integrated spectral intensity of the middle peak can then be calculated as
| (25) |
The success probability of a general projective measurement of onto can be expressed as
| (26) |
Thus, in an analogous fashion to the qubit case, if the peaks are clearly separable and , the intensity of the middle peak is proportional to the success probability of a projective measurement onto
| (27) |
Thus, the scheme generalizes to higher-dimensional time-bin states in a straightforward manner.
Appendix C Supplementary: Quantum-state reconstruction details
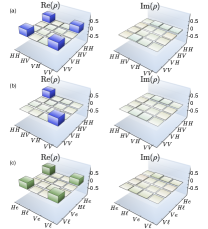
Quantum-state reconstruction was performed using iterative maximum-likelihood tomography Jezek2003tomo with an overcomplete set of 36 measurement settings deBurghTomo . The initial polarization state was measured with an integration time of 5 s per setting and reconstructed to the density matrix of Fig. S6a. The reconstructed density matrix has a fidelity, defined as for a pure state , of with . The purity of this density matrix, defined as , was found to be . We determined errors on our fidelities and purities using Monte Carlo techniques with 400 iterations and assuming Poissonian error.
Fig. S6b shows the reconstructed density matrix of the polarization state after the -BBO was inserted. This density matrix has a fidelity of with the classically-correlated state and a purity of . The entanglement in the system is no longer noticeable through polarization measurements as the time delay has separated horizontal and vertical components to outside of their coherence length.
Using our time-bin measurement technique on the signal photon instead of polarization measurements (Fig. S6c) retrieves the correlations of the initial state. The lower measurement efficiency necessitated three loops for tomography, each with an integration time of 300 s per measurement setting. The reconstructed density matrix has a fidelity of with and a purity of . It is more relevant, however, that the fidelity with the first reconstructed density matrix is , indicating the high fidelity of operation of our measurement technique.
Appendix D Supplementary: Coincidence rate vs. details
For an entangled state of the form , we take separable measurements on bases mutually unbiased from the H/V and / bases, written in the form
| (28) |
In doing so, we expect to see a coincidence rate proportional to
| (29) |
which can vary between 0 and as the phases and are altered. If we instead look at only half of the two-qubit system, we find the single-event rate for each side to be proportional to
| (30) |
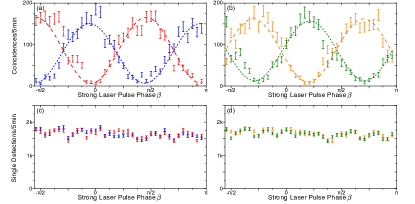
Thus, when the phases are varied, we expect oscillations in the coincidence rate but a stable rate of single-event detections franson89 .
Fig. S7 shows the coincidence rate (Fig. S7(a-b)) and single-event rate (Fig. S7(c-d)) of the time-bin state detections as the phase is varied for four different idler projections , with an integration time of 5 min per data point. In Fig. S7a and Fig. S7c, is set to 0 (diagonal polarization ) for the blue curve and (anti-diagonal polarization ) for the red curve. In Fig. S7b and Fig. S7d, is set to (left-circular polarization ) for the orange curve and (right-circular polarization ) for the green curve. The four coincidence curves have visibilities , , , and for , , , and respectively, for an average visibility of . The single-detection events are nearly constant. This shows a non-local form of interference only visible when the entire system is measured, demonstrating the fidelity of phase measurement. No active phase stabilization was implemented over the experimental run time (12 hours).