Measurement of the reaction with the Crystal Ball/TAPS detectors at the Mainz Microtron
Abstract
The reaction has been measured from threshold to GeV ( GeV) using the Crystal Ball and TAPS multiphoton spectrometers together with the photon tagging facility at the Mainz Microtron MAMI. In the present experiment, this reaction was searched for in the final state, by assuming and . The experimental results include total and differential cross sections as well as the polarization of the recoil hyperon. The new data significantly improve empirical knowledge about the reaction in the measured energy range. The results are compared to previous measurements and model predictions. It is demonstrated that adding the present results to existing data allowed a better description of this reaction with various models.
pacs:
13.60.-r, 13.60.Hb, 13.88.+eI Introduction
The unique extraction of partial-wave scattering amplitudes and universal baryon-resonance parameters from experimental data as well as their precise interpretation in QCD ranks among the most challenging tasks in modern hadron physics. During the last decades, an enormous effort to study baryon resonances in photoinduced meson production at various laboratories has started. Many single- and double-spin observables for different final states have been measured for the first time.
Photoinduced kaon-hyperon () production has attracted much attention for two reasons. First, open strangeness production necessarily involves the generation of a strange pair, and new aspects of nucleon spectroscopy might be discovered, which are not manifest in reactions containing pion-nucleon initial or final states. Second, the weak hyperon decays reveal the polarization state of the final-state baryon. This information is essential in order to achieve a model-independent amplitude reconstruction in a so-called complete experiment barker ; sandorfi .
The basic reactions include , , and , as well as the corresponding reactions off the neutron. The production of an isoscalar hyperon involves only resonances, while and may receive contributions from both and states. Therefore, an experimentally based isospin decomposition of the transition amplitudes requires data on both reactions with similar quality.
Differential cross sections and hyperon polarization for reactions with a charged kaon, and , were measured at Jefferson Lab using the CLAS detector Kpl_CLAS_2004 ; Kpl_CLAS_2006 ; Kpl_CLAS_2010 , at ELSA using the SAPHIR detector Kpl_SAPHIR_1998 ; Kpl_SAPHIR , at GRAAL Kpl_GRAAL_2007 , and with LEPS Kpl_LEPS_2006 ; Kpl_LEPS2_2006 . Recent measurements of the beam-recoil observables with CLAS br-clas and GRAAL br-graal are important steps toward a model-independent amplitude reconstruction.
The reaction can be identified via the decays or and or . Differential cross sections have been measured by CBELSA/TAPS, using the final state K0Spl_CBELSA_2008 ; K0Spl_CBELSA_2010 , and by SAPHIR K0Spl_SAPHIR_1999 ; K0Spl_SAPHIR and CLAS K0Spl_CLAS , using the and final states. Compared to the and channels, the statistical accuracy of the existing data are rather limited, especially at energies below GeV.
In parallel with these experimental efforts, a lot of theoretical studies for modeling and understanding the dynamics of kaon photoproduction were started. Calculations have been performed in the framework of single- or multichannel isobar models K0Spl_KMAID ; RPR_2007 ; BGPWA , coupled-channel approaches giessen ; scholten ; juelich as well as chiral-unitary approaches Chiral . It turned out that, in contrast to single or photoproduction, both resonant and nonresonant contributions play an almost equally important part in the reaction dynamics. Therefore, extracted resonance parameters strongly depend on the treatment of the nonresonant contributions and a conclusive picture about the dynamics and the baryon-resonance contributions has not yet been achieved.
In the phenomenological KAON-MAID model K0Spl_KMAID , the nonresonant part of the amplitudes contains , , and channel terms along with a contact interaction, which is required to restore gauge invariance after hadronic form factors are introduced. The model was fitted to the first SAPHIR , Kpl_SAPHIR_1998 , and data K0Spl_SAPHIR_1999 . In the Regge-Plus-Resonance (RPR) approach of Refs. RPR_2007 ; RPR_A , modeling nonresonant contributions via exchange of Regge trajectories involves only a few parameters, which can be constrained by the high-energy data above the resonance region. The latest Bonn-Gatchina (BnGa) partial-wave analysis (PWA) BGPWA incorporates the majority of existing data from pion- and photoinduced reactions into simultaneous multichannel fits. In Ref. Chiral , a unitary, gauge-invariant coupled-channel approach based on a chiral effective Lagrangian was used to describe the threshold regions of kaon photoproduction without including any resonances at all.
This work reports on new experimental results for the reaction that include total and differential cross sections and recoil polarization of . The data were obtained with the Crystal Ball/TAPS multiphoton spectrometers, using the energy-tagged beam of bremsstrahlung photons from the Mainz Microtron. Compared to the previous experiments, the present statistics and the quality of the data allow us to measure the reaction at MeV with a higher accuracy and smaller energy binning.
II Experimental setup
The reaction was measured using the Crystal Ball (CB) CB as the central spectrometer and TAPS TAPS ; TAPS2 as a forward spectrometer. These detectors were installed in the energy-tagged bremsstrahlung photon beam of the Mainz Microtron (MAMI) MAMI ; MAMIC . The photon energies are determined by the Glasgow tagging spectrometer TAGGER2 ; TAGGER ; TAGGER1 .
The CB detector is a sphere consisting of 672 optically isolated NaI(Tl) crystals, shaped as truncated triangular pyramids, which point toward the center of the sphere. The crystals are arranged in two hemispheres that cover 93% of sr, sitting outside a central spherical cavity with a radius of 25 cm, which is designed to hold the target and inner detectors. In this experiment, TAPS was arranged in a plane consisting of 384 BaF2 counters of hexagonal cross section. It was installed 1.5 m downstream of the CB center and covered the full azimuthal range for polar angles from to . More details on the energy and angular resolution of the CB and TAPS are given in Refs. slopemamic ; etamamic .
The present measurement used 1508- and 1557-MeV electron beams from the upgraded Mainz Microtron, MAMI-C MAMIC . The data with the 1508-MeV beam were taken in 2007 and those with the 1557-MeV beam in 2009. Bremsstrahlung photons, produced by the 1508-MeV electrons in a 10-m Cu radiator and collimated by a 4-mm-diameter Pb collimator, were incident on a 5-cm-long liquid hydrogen (LH2) target located in the center of the CB. The energies of the incident photons were analyzed up to 1402 MeV by detecting the post-bremsstrahlung electrons in the Glasgow tagger TAGGER2 . With the 1557-MeV electron beam, the incident photons were analyzed up to 1448 MeV, and a 10-cm-long LH2 target was used. The energy resolution of the tagged photons is mostly defined by the width of tagger focal-plane detectors and by the electron-beam energy. For the present beam energies, a typical width of a tagger channel was about 4 MeV. Due to the beam collimation, only part of the bremsstrahlung photon flux reached the LH2 target. In order to extract the reaction cross sections, the probability of bremsstrahlung photons reaching the target (the so-called tagging efficiency) was measured for each tagger channel. The average tagging efficiency in the experiment with the 1508-MeV electron beam was found to vary from 69% at the threshold to 64% at GeV. With the 1557-MeV electron beam, the average tagging efficiency was similar to the 1508-MeV-beam magnitudes up to GeV, dropping then to 57% at GeV.
The experimental trigger in the measurement with the 1508-MeV electron beam required two conditions: 1. the total-energy deposited in the CB had to exceed 320 MeV and 2. the number of so-called hardware clusters in the CB (multiplicity trigger) had to be larger than two. With the 1557-MeV electron beam, the trigger on the total energy in the CB was increased to 340 MeV. TAPS was not in the multiplicity trigger for these experiments.
More details on the experimental conditions of the data taking with the 1508-MeV electron beam in 2007 are given in Refs. slopemamic ; etamamic .
III Data handling
The reaction was searched for in the final state, by assuming and . The candidates were extracted from the analysis of events having six and seven clusters reconstructed in the CB and TAPS together. As reported in Ref. etamamic , a large part of the final state comes from the process . However, this process can be easily separated from based on the invariant mass of the system, which is heavier than the mass for events. Another part of is the so-called direct production that comes from processes involving only a chain of and decays.
Besides the physical background, there are two more background sources. The first one comes from interactions of incident photons in the windows of the target cell. The subtraction of this background from the experimental spectra was based on the analysis of the data samples that were taken with an empty (no liquid hydrogen) target. Another background is due to random coincidences of the tagger hits with the experimental trigger; its subtraction was done by using only those tagger hits for which all coincidences were random (see Refs. slopemamic ; etamamic for more details).
The selection of event candidates was based on the kinematic-fit technique. The details of the kinematic-fit parametrization of the detector information and resolution are given in Ref. slopemamic . The hypothesis was tested to identify all events that have the final state. The events that satisfied this hypothesis at the 2% confidence level (CL) (i.e., with a probability of misinterpretation less than 2%) were accepted as the reaction candidates. The kinematic-fit output for which the pairing combination of the six photons to the three s had the largest CL was used to reconstruct the reaction kinematics. The hypothesis was tested to identify those events that were produced via the decay. The test of the hypothesis was not done as it would accept all direct events that have a combination of the invariant masses of the and systems simultaneously close to the mass of and .
The determination of the experimental acceptance was based on a Monte Carlo (MC) simulation of the reaction with an isotropic production angular distribution. Two background reactions were simulated as and , also with isotropic production angular distributions. For the data at each electron-beam energy, the corresponding MC events were propagated through a GEANT (version 3.21) simulation of the experimental setup. To reproduce resolutions of the experimental data, the GEANT output (energy and timing) was subject to additional smearing, thus allowing both the simulated and experimental data to be analyzed in the same way. The simulated events were also tested for whether they passed the trigger requirements.
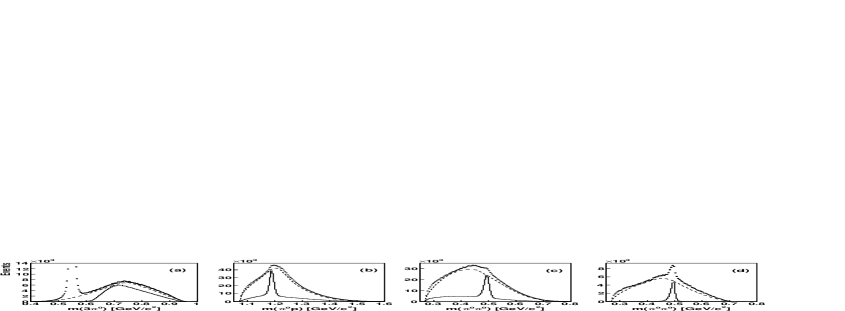
In Fig. 1, various invariant-mass distributions obtained from the experimental events are compared to those obtained from the MC simulation of the processes and . All events are plotted only for beam energies above the threshold (1048 MeV). The invariant-mass distributions are depicted in Fig. 1(a). As seen, the experimental distribution includes a strong peak from events and a structure that is similar to the MC simulation of . Also, one can see that events from and barely overlap. The invariant-mass distributions are shown in Fig. 1(b) for events with GeV/. The corresponding invariant mass for the system is shown in Fig. 1(c). These distributions for and have three entries per one event because of the number of final-state s. As seen in Fig. 1(b), the experimental spectrum reveals a clear signal from the decay, the shape of which is close to the MC simulation of . As a weak signal from sits on a big bump from , this makes it difficult to use the distribution for fitting the signal above background. As seen in Fig. 1(c), the background under the signal is much smoother. The shape of this background is also close to the MC simulation of . To enlarge the signal-to-background ratio in the distribution, only events from the region of the peak should be accepted into the distribution. The width of this peak can be determined from the MC simulation of , which is shown in Fig. 1(b) by a solid line. Such an approach was used in the previous analyses of the CBELSA data K0Spl_CBELSA_2008 ; K0Spl_CBELSA_2010 . The present analysis revealed that an even better solution is to test the hypothesis with the kinematic fit. Besides selecting events from the region of the peak, the use of this hypothesis also improves the angular resolution and the resolution for the actual events. Fitting the hypothesis resulted in for the resolution in the polar angle in the center-of-mass (c.m.) frame and MeV/ for the invariant-mass resolution of the two from the decay, whereas the corresponding values based on the fit of the hypothesis were and MeV/. The results of fitting the hypothesis are shown in Fig. 1(d). The distribution from the MC simulation of includes now an almost clean, narrower peak from . The signal in the experimental distribution is much more prominent than the one in Fig. 1(c).
All previous measurements of were made with wide energy bins; the smallest bins were 100-MeV wide. This prevented an adequate characterization of the region from threshold to the excitation-function maximum, causing difficulties with the theoretical interpretation of the data. The present data were divided into eight energy bins from MeV to MeV, allowing 50-MeV energy binning for measuring both the cross sections and recoil polarization of . The data within one energy bin were divided into six bins for MeV and into eight bins for MeV, where is the angle between the direction of the outgoing and the incident photon in the c.m. frame.
Although the 50-MeV binning covers entirely the energy range available in this experiment, unfortunately, the energy points themselves do not match any existing data. For a better comparison of the present and previous data, an additional set of results was obtained also with the use of 50-MeV bins, but with the energy points matching all previous measurements. Namely, the additional set includes five energy points: 1100, 1200, 1250, 1300, and 1400 MeV. This additional set was used only for illustration (Figs. 4 and 7) and cannot be used in any further analysis, as its results are strongly correlated with the results of the main set.
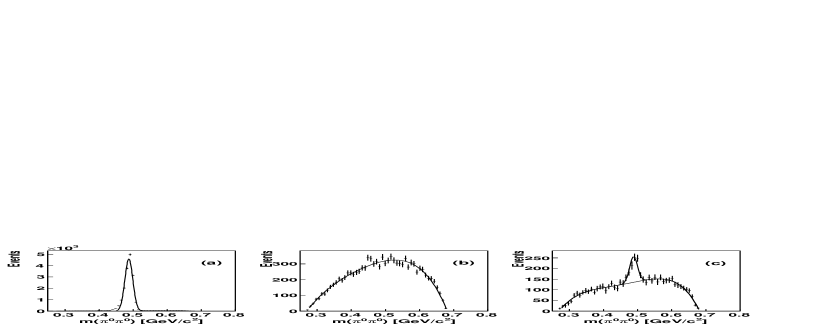
The signal was fitted individually in every bin. The fitting procedure is illustrated in Fig. 2 for one particular energy and bin. The distribution from the MC simulation of fitted with a Gaussian is shown in Fig. 2(a). The distribution from the MC simulation of fitted with a polynomial of order five is shown in Fig. 2(b). The experimental distribution fitted with the sum of a Gaussian and a polynomial of order five is shown in Fig. 2(c). For the latter fit, the initial parameters for the polynomial were taken from the previous fit to the MC simulation of , and two parameters of the Gaussian (namely, the mean value and ) were fixed to the values from the previous fit to the MC simulation of . Since the calculation of the experimental number of events was based on the area under the Gaussian, the corresponding detection efficiency was calculated in the same way (based on the area under the Gaussian fit to the MC simulation of ).
| [MeV] | |||
|---|---|---|---|
| [b/sr] | [b/sr] | [b/sr] | |
| -1.0 to -0.667 | |||
| -0.667 to -0.333 | |||
| -0.333 to 0.0 | |||
| 0.0 to 0.333 | |||
| 0.333 to 0.667 | |||
| 0.667 to 1.0 |
| [MeV] | ||||
|---|---|---|---|---|
| [b/sr] | [b/sr] | [b/sr] | [b/sr] | |
| -1.0 to -0.75 | ||||
| -0.75 to -0.5 | ||||
| -0.5 to -0.25 | ||||
| -0.25 to 0.0 | ||||
| 0.0 to 0.25 | ||||
| 0.25 to 0.5 | ||||
| 0.5 to 0.75 | ||||
| 0.75 to 1.0 |
The recoil polarization of the hyperon was measured via its parity-violating weak decay . The angular distribution of the decay nucleon is given by Ref. Gatto as
| (1) |
where is the asymmetry parameter for the decay. The angle is defined by
| (2) |
where and are, respectively, vectors in the direction of the incident photon and the outgoing , is a unit vector in the direction of the decay proton in the rest frame, and is the normal to the production plane. Based on the decay asymmetry of with respect to the production plane, the polarization was measured by averaging the proton angular distribution above () and below () this plane:
| (3) |
where and represent, respectively, the number of events with the decay proton emitted above and below the production plane.
IV Discussion of the results
The differential cross sections for and recoil polarization of were obtained as a function of , where is the angle between the direction of and the incident photon in the c.m. frame. As discussed in Sec. III, the main results were obtained for eight 50-MeV intervals, covering the full energy range available in the experiment. Additional results were obtained just for a better comparison with existing data, also using 50-MeV intervals, but with the energy points matching the previous measurements.
Since the mean value and of the Gaussian were fixed while fitting to the experimental spectra, the statistical uncertainties in the results for the differential cross sections and recoil polarization are based on the fit errors for the Gaussian height parameter. These uncertainties are shown in the figures and listed in the tables.
The systematic uncertainties in the results are more essential for the differential cross sections, and most of them are canceled in the calculation of recoil polarization. The largest contribution to the systematic uncertainties comes from the parametrization of the background in the fits. According to our study, this uncertainty is about 0.003 b/sr for each individual value in the differential cross sections, independent of its magnitude. This uncertainty was estimated by changing the degree of a polynomial used in the fit and the range fitted. Although for the largest values in the differential cross sections, this uncertainty is only about 5%, for the smallest values, it reaches 25%. The systematic uncertainty because of the combinatorial background under the peak from the decays (see Fig. 2(a)) is at the level of 1%–2%, depending on the value. The overall systematic uncertainty that comes from the determination of the experimental acceptance with the MC simulation and from the calculation of the photon-beam flux is about 4%. This uncertainty for the final state was studied by measuring the process , which has a much larger yield and little background, for the same data sets (see Ref. etamamic for more details).
The results below MeV are obtained as a weighted average of the results from the data with the 1508-MeV beam and with the 1557-MeV beam. The results obtained for the first energy bin, , are not very reliable because of a very weak signal above large background, so they are omitted in this work.
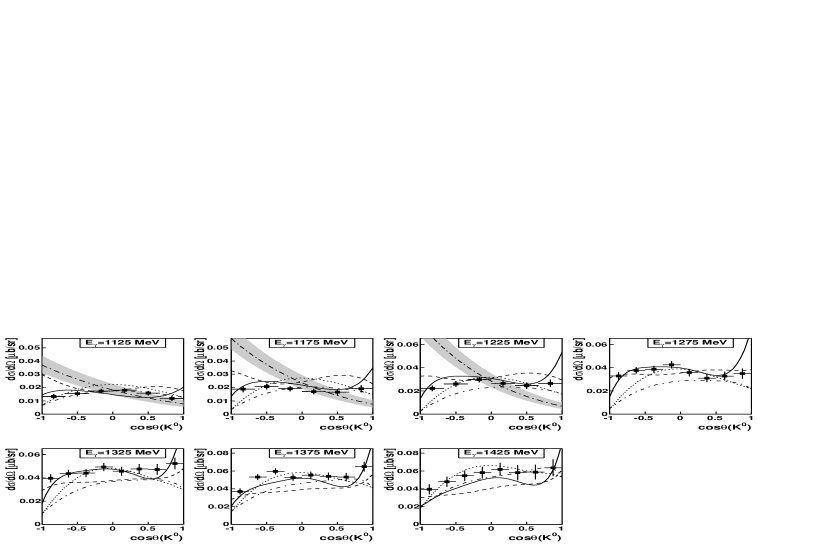
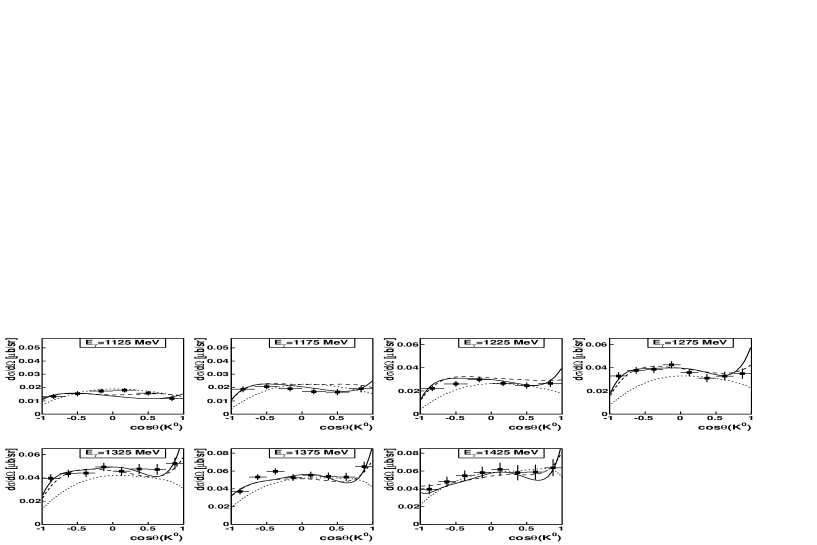
In Fig. 3, these differential cross sections are compared to predictions of various models. The latest BnGa multichannel PWA BGPWA permits two classes of solutions, called BG2011-1 (shown in the figures by a dashed line) and BG2011-2 (shown by a solid line). The RPR approach is presented by a solution with background model 3 (RPR-3) from Ref. RPR_2007 (shown by a dotted line) and a revised solution with background model 3 (RPR-A) from Ref. RPR_A (shown by a dash-dotted line). The gauge-invariant chiral-unitary approach is shown by a long-dash-dotted line with a gray error band. None of these predictions is in good agreement with the measured differential cross sections for the full energy range. The KAON-MAID predictions from Ref. K0Spl_KMAID are not shown here as the model was fitted to the first SAPHIR data Kpl_SAPHIR_1998 (not shown here), in which the background was significantly underestimated. The chiral-unitary calculation of Ref. Chiral does not describe the angular distributions. However, the order of magnitude of the cross section comes out correctly. This is already a success as no baryon resonance contributions are explicitly added in these calculations. As seen from the comparison, adding the present results to the existing data will require a revision of the analysis of photoinduced production by all models.
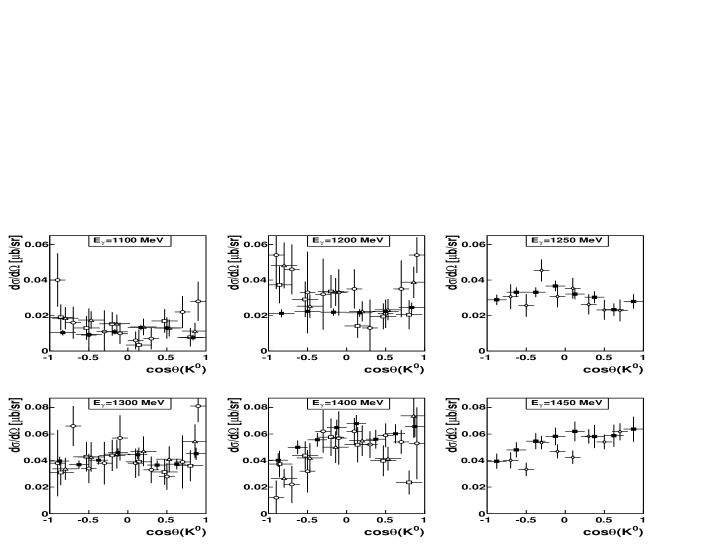
In Fig. 4, the measured differential cross sections from the additional set of this work are compared to all recent data in this energy range. As seen, all previous measurements are made for wider energy bins and have larger error bars. Although the error bars of the other data at MeV and MeV are much larger than the ones of this work, the present results appear to be smaller than the previous measurements, especially at the extreme angles. This hints that the background in those measurements was underestimated at these angles. The results of the CLAS Collaboration K0Spl_CLAS at MeV and MeV are in good agreement within the error bars with the results of this work. The results obtained at MeV and MeV are in agreement within the error bars with the majority of the previous measurements.
| [MeV] | |||
|---|---|---|---|
| -1.0 to -0.667 | |||
| -0.667 to -0.333 | |||
| -0.333 to 0.0 | |||
| 0.0 to 0.333 | |||
| 0.333 to 0.667 | |||
| 0.667 to 1.0 |
| [MeV] | ||||
|---|---|---|---|---|
| -1.0 to -0.75 | ||||
| -0.75 to -0.5 | ||||
| -0.5 to -0.25 | ||||
| -0.25 to 0.0 | ||||
| 0.0 to 0.25 | ||||
| 0.25 to 0.5 | ||||
| 0.5 to 0.75 | ||||
| 0.75 to 1.0 |
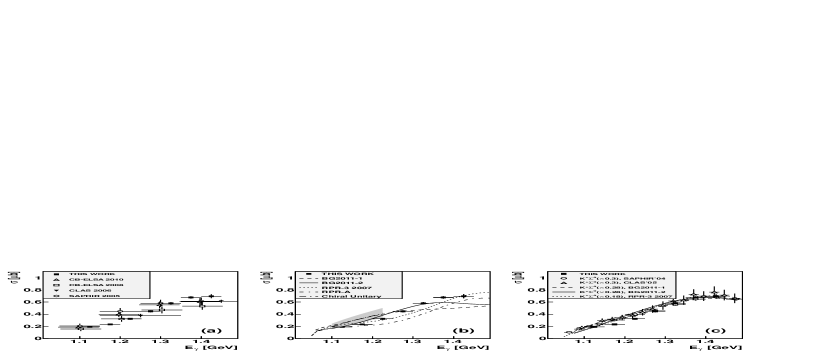
The total cross sections for were obtained by the integration of the present differential cross sections. In Fig. 5(a), these total cross sections are compared to the previous measurements. Since the differential cross sections of CLAS were obtained for a limited angular range only, their partial total cross sections were normalized by us to the ratio of the full and covered ranges of . As seen, although the previous results have larger error bars, which overlap with the present data points, the energy dependence of the measured cross sections shows a more steady rise from threshold to the maximum. In Fig. 5(b), the present total cross sections are compared to predictions from the models BG2011-1, BG2011-2, RPR-3, and RPR-A and from the chiral-unitary approach. As seen, the prediction from BG2011-2 is closer to the present data than BG2011-1, and the prediction from RPR-3 is closer than RPR-A. However, none of the predictions is sufficiently close to the present data. Compared to the previous measurements, the energy dependence of the present total cross sections is much closer to the corresponding energy dependence of the isospin-related reaction . If both the reactions in this energy range were dominated by production via states, the yield should be about four times as large, compared to . To illustrate this similarity, in Fig. 5(c) the present cross sections are compared to the rescaled ones of , which are represented by the CLAS Kpl_CLAS_2006 and SAPHIR Kpl_SAPHIR data and predictions from the models BG2011-1, BG2011-2, and RPR-3. As seen, the measured energy dependence for is very similar to that for .
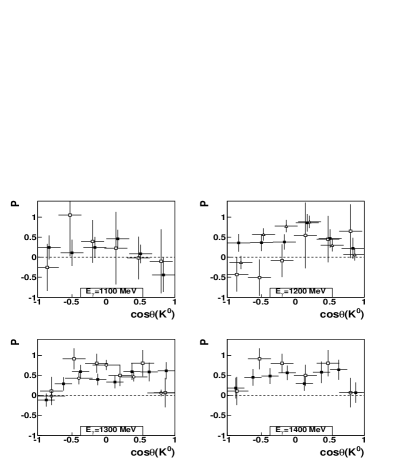

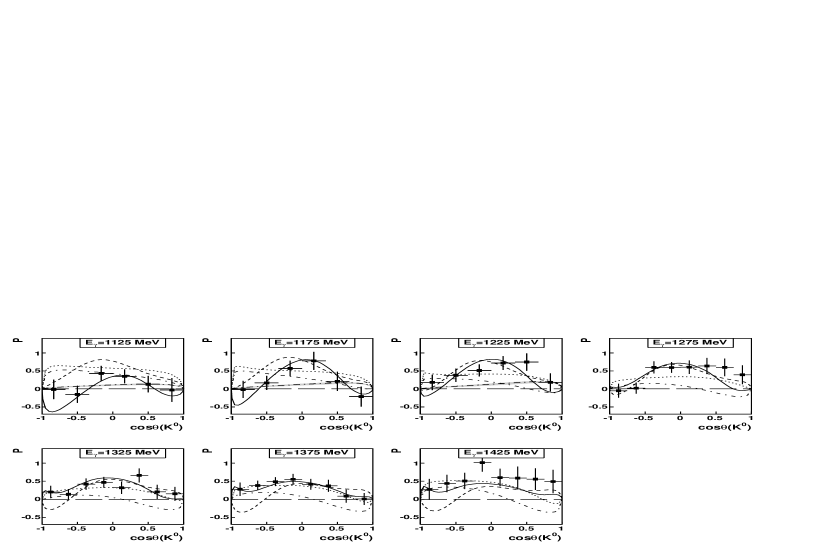
The results of our main set for recoil polarization of are listed in Tables 3 and 4. In Fig. 6, these results are compared to predictions from the models BG2011-1, BG2011-2, RPR-3, and RPR-A and from the chiral-unitary approach. In our opinion, the prediction from BG2011-2 is the closest one for most of the data, and the prediction from RPR-3 is better than RPR-A. The prediction from the chiral-unitary approach is much smaller than the experimental values. In Fig. 7, the recoil-polarization results from the additional set of this work are compared to all previous measurements in this energy range, which are represented by only four energies, with wider energy bins and larger uncertainties. As seen, for all four energies, the present results are in agreement within the error bars with the majority of the previous measurements.
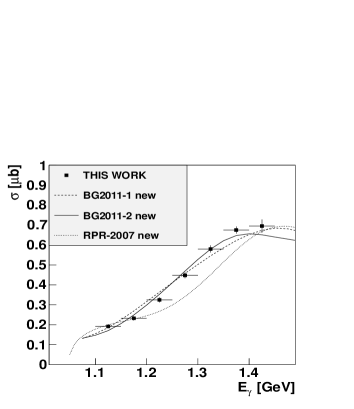
To check the importance of the present data for a better understanding of the dynamics in our energy range, the RPR and BnGa groups added the results of this work in their analysis of photoproduction. The revised results of their fits private are shown in Fig. 8 for the differential cross sections, in Fig. 9 for the total cross sections, and in Fig. 10 for recoil polarization of . As seen, the RPR-2007 approach, which is a revised RPR-3 model, gives a better prediction for the shape of the differential cross sections, but leaves a discrepancy for the total cross sections and recoil polarization. The RPR-A model was eliminated by the present data. For both the BG2011-1 and BG2011-2 solutions, the updated BnGA PWA yields results which are very close to the present data, especially for higher photon energies. Both RPR and BnGa groups observed a strong influence from the present data on their analyses. Details for these results will be published by the RPR and BnGa groups separately private .
V Summary and conclusions
The reaction has been measured from threshold to GeV. The measurement was conducted by using the Crystal Ball and TAPS multiphoton spectrometers together with the Glasgow photon tagging facility at the Mainz Microtron. The experimental results include total and differential cross sections and recoil polarization of . The comparison of the present results to previous measurements reveals generally good agreement. However, the data of this work are obtained for narrower energy bins and with smaller uncertainties. The accuracy of the results presented in this work allows a significant improvement of the world data base for the reaction. The comparison of the present results to the existing model predictions indicates that none of them describes well the present data in the entire measured energy range. With these new data, different models can be restricted much more precisely, leading to a more accurate description of the reaction.
Acknowledgment
The authors wish to acknowledge the excellent support of the accelerator group and operators of MAMI. We also thank A. Sarantsev on behalf of the BnGa PWA group, P. Vancraeyveld and J. Ryckebusch on behalf of the RPR analysis groups, as well as P. Bruns for their help and constructive comments. This work was supported by the Deutsche Forschungsgemeinschaft (SFB443, SFB/TR16, and SFB1044), DFG-RFBR (Grant No. 09-02-91330), the European Community-Research Infrastructure Activity under the FP6 “Structuring the European Research Area” program (Hadron Physics, Contract No. RII3-CT-2004-506078), Schweizerischer Nationalfonds, the U.K. Science and Technology Facilities Council, the U.S. Department of Energy and National Science Foundation, and NSERC (Canada). A. Fix acknowledges additional support from the Russian Federation federal program “Kadry”(Contract No. P691) and the MSE Program “Nauka” (Contract No. 1.604.2011). We thank the undergraduate students of Mount Allison University and The George Washington University for their assistance.
References
- (1) I.S. Barker, A. Donnachie, J.K. Storrow, Nucl. Phys. B 95, 347 (1975).
- (2) A.M. Sandorfi et al., J. Phys. 38, 053001 (2011).
- (3) J.W.C. McNabb et al., Phys. Rev. C 69, 042201 (2004).
- (4) R. Bradford et al., Phys. Rev. C 73, 035202 (2006).
- (5) B. Dey et al., Phys. Rev. C 82, 025202 (2010).
- (6) M.Q. Tran et al., Phys. Lett. B 445, 20 (1998).
- (7) K.-H. Glander et al., Eur. Phys. J. A 19, 251 (2004).
- (8) A. Lleres et al., Eur. Phys. J. A 31, 79 (2007).
- (9) M. Sumihama et al., Phys. Rev. C 73, 035214 (2006).
- (10) H. Kohri et al., Phys. Rev. Lett. 97, 082003 (2006).
- (11) R.K. Bradford et al., Phys. Rev. C 75, 035205 (2007).
- (12) A. Lleres et al., Eur. Phys. J. A 39, 149 (2009).
- (13) R. Castelijns et al., Eur. Phys. J. A 35, 39 (2008).
- (14) R. Ewald (for the CBELSA/TAPS Collaboration), AIP Conf. Proc. 1257, 566 (2010).
- (15) S. Goers et al., Phys. Lett. B 464, 331 (1999).
- (16) R. Lawall et al., Eur. Phys. J. A 24, 275 (2005).
- (17) F.J. Klein (for the CLAS Collaboration), Nucl. Phys. A 754, 321 (2005).
-
(18)
T. Mart, C. Bennhold, Phys. Rev. C 61, 012201 (1999);
www.kph.uni-mainz.de/MAID/kaon/kaonmaid.html - (19) T. Corthals, T. Van Cauteren, J. Ryckebusch, and D.G. Ireland, Phys. Rev. C 75, 045204 (2007).
- (20) A.V. Anisovich, R. Beck, E. Klempt, V.A. Nikonov, A.V. Sarantsev, and U. Thoma, Eur. Phys. J. A 48, 15 (2012); http://pwa.hiskp.uni-bonn.de/baryon.htm
- (21) R. Shyam, O. Scholten and H. Lenske, Phys. Rev. C 81, 015204 (2010).
- (22) V. Shklyar, H. Lenske and U. Mosel, Phys. Rev. C 72, 015210 (2005).
- (23) F. Huang, M. Döring, H. Haberzettl, J. Haidenbauer, C. Hanhart, S. Krewald, U. G. Meißner and K. Nakayama, Phys. Rev. C 85, 054003 (2012).
- (24) B. Borasoy, P.C. Bruns, U.-G. Meißner, and R. Nissler, Eur. Phys. J. A 34, 161 (2007).
- (25) P. Vancraeyveld, Ph.D. thesis, Ghent University, 2011.
- (26) A. Starostin et al., Phys. Rev. C 64, 055205 (2001).
- (27) R. Novotny, IEEE Trans. Nucl. Sci. 38, 379 (1991).
- (28) A.R. Gabler et al., Nucl. Instrum. Methods A 346, 168 (1994).
- (29) H. Herminghaus et al., IEEE Trans. Nucl. Sci. 30, 3274 (1983).
- (30) K.-H. Kaiser et al., Nucl. Instrum. Methods A 593, 159 (2008).
- (31) J.C. McGeorge et al., Eur. Phys. J. A 37, 129 (2008).
- (32) I. Anthony et al., Nucl. Instrum. Methods A 310, 230 (1991).
- (33) S.J. Hall et al., Nucl. Instrum. Methods A 368, 698 (1996).
- (34) S. Prakhov et al., Phys. Rev. C 79, 035204 (2009).
- (35) E.F. McNicoll et al., Phys. Rev. C 82, 035208 (2010).
- (36) R. Gatto, Phys. Rev. 109, 610 (1958).
- (37) A. Sarantsev, J. Ryckebusch, and P. Vancraeyveld, private communication.