MHD Simulation of a Sigmoid Eruption of Active Region 11283
Abstract
Current magnetohydrodynamic (MHD) simulations of the initiation of solar eruptions are still commonly carried out with idealized magnetic field models, whereas the realistic coronal field prior to eruptions can possibly be reconstructed from the observable photospheric field. Using a nonlinear force-free field extrapolation prior to a sigmoid eruption in AR 11283 as the initial condition in a MHD model, we successfully simulate the realistic initiation process of the eruption event, as is confirmed by a remarkable resemblance to the SDO/AIA observations. Analysis of the pre-eruption field reveals that the envelope flux of the sigmoidal core contains a coronal null and furthermore the flux rope is prone to a torus instability. Observations suggest that reconnection at the null cuts overlying tethers and likely triggers the torus instability of the flux rope, which results in the eruption. This kind of simulation demonstrates the capability of modeling the realistic solar eruptions to provide the initiation process.
Subject headings:
Magnetic fields; Magnetohydrodynamics (MHD); Methods: numerical; Sun: coronal mass ejections (CMEs); Sun: flares1. Introduction
Solar eruptions are major drivers of the space weather, and the key of forecast of the space weather is to understand the eruption mechanism. Although manifested as different observational forms including the flares, filaments eruptions and coronal mass ejections (CMEs), it is commonly accepted that solar eruptions are caused by the disruption of the coronal magnetic field, in which the magnetic free energy stored in the corona prior to the event is released. However, the mechanism of their initiations is still unclear. A variety of theoretical models have been proposed to explain the initiation of solar eruptions (see, e.g., Forbes et al., 2006; Schmieder et al., 2013, and references therein).
Numerical simulations are powerful tool to constrain the theoretical models. Over the past few years, many authors have carried out different MHD simulations to investigate the initiation process of eruptions (e.g., Amari et al., 2003; MacNeice et al., 2004; Török & Kliem, 2005; Aulanier et al., 2009; Fan, 2010; Kliem et al., 2010; Roussev et al., 2012, etc.), which have greatly improved our knowledge of the eruption mechanism. However, these simulations commonly involve highly idealized magnetic-field configuration with perfect symmetry and smoothness (a well known example is Titov & Démoulin (1999)’s flux rope model, which is used by Török & Kliem (2005); Török et al. (2011, 2013)) which only mimics the coronal field. Taking into account a more realistic coronal environment might affect the modeling result significantly.
Very recently modelers have developed non-symmetric versions of the idealized models to improve their abilities of resembling the real observations (Aulanier et al., 2010, 2012; Fan, 2011; Török et al., 2011, 2013; Zuccarello et al., 2012), but even this is only qualitative. The realistic coronal field might be much more complex as implied by complex flux distribution of the observed photospheric field, and is difficult to recover by the idealized models. A step forward of understanding what really happens in the solar eruptions, certainly necessitates the numerical simulations constrained directly by the observations (if available). Only in this way, the eruption process can then be expected to be reproduced accurately, and critical parameters, e.g., the eruption direction and speed, can be hoped to be achieved correctly. Although there are also MHD simulation works using line-of-sight observed magnetograms as boundary conditions (e.g., Lugaz et al., 2011; Downs et al., 2012), these simulations focus on the large-scale field response to the eruptions and the propagation of the CMEs while their initiation mechanisms are not treated properly.
At the moment, the photospheric vector mangetograms combined with the force-free field model have been used successfully to reconstruct the realistic coronal field prior to eruptions, when the coronal field is near in equilibrium and thus can be assumed to be force-free (Wiegelmann & Sakurai, 2012). Critical structures, e.g., twisted flux rope (FR) and 3D coronal null point, which are basic building block of many eruption models (e.g., Forbes & Isenberg, 1991; Kliem & Török, 2006; Antiochos et al., 1999), can be reconstructed by using the general nonlinear force-free field (NLFFF) model (Guo et al., 2010; Canou & Amari, 2010; Sun et al., 2012; Jiang & Feng, 2013). Moreover, based on the NLFFF extrapolation for the pre-eruption field, magnetic topology study can shed important light on the eruption mechanism (Savcheva et al., 2012; Sun et al., 2012). This inspires us to input the NLFFF based on real magnetograms into MHD simulation for a better modeling of the real eruption other than using idealized models.
In this Letter, we report a successful simulation of the initiation process of a sigmoid eruption in AR 11283 in its realistic magnetic configuration. The MHD model is initialized by a NLFFF extrapolation for the pre-eruption field, and reproduces almost accurately the SDO/AIA observations of the eruption initiation process.
2. Observations
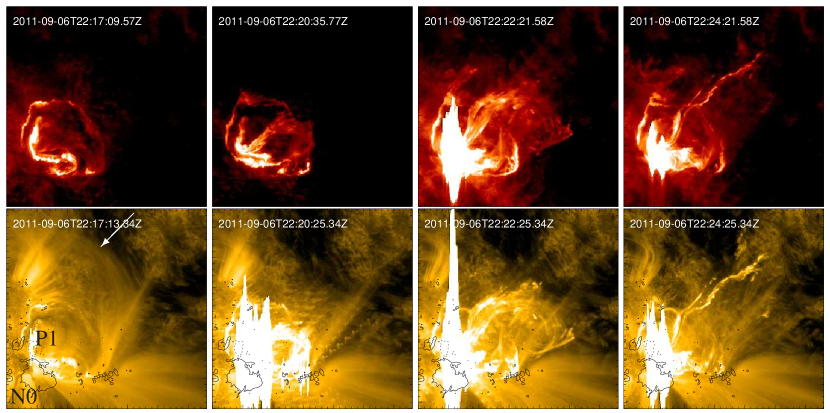
Our target AR 11283 is a very eruptive source region, producing several flares and CMEs when it was located near the disk center. We focus here on the initiation process of a CME on 2011 September 6, i.e., a sigmoid eruption around 22:20 UT (see Figure 1). At 22:00 UT the coronal magnetic field was still near-static and a sigmoid was clearly observed in AIA-94 channel (see Figure 3). After then the field evolved slightly until its drastic eruption at 22:18 UT, which is observed as a fast rising of a FR with a duration of 6 min. The evolution of the FR is most clearly seen in AIA 304 and 171 channels (shown in the first two rows of Figure 1). The FR rose with a speed of roughly 300 km/s in a non-radial direction approximately toward the northwest (of the disk plane). It developed a highly asymmetric and helical shape, with the north leg much brighter than the south leg. Inspection of the successive eruption progress shows that the north leg (rooted in the positive polarity, labeled as P1 in Figure 2) of the FR was held fixed while the south footpoint (rooted in N0) appears to slip along the west during the rising of the rope. Along with the eruption was a X2.1 flare (started at 22:12 UT and peaked at 22:20 UT), with a remarkably circular ribbon, which strongly indicates the presence of a magnetic null configuration (Masson et al., 2009; Wang & Liu, 2012), surrounding the footpoint site of the eruption (see Figure 3). The circular flare ribbon, as a signature of reconnection at the null, is observed a little earlier than the rising of the FR. We also note that a group of large closed loops above the eruption site (denoted by the arrow on Figure 1) expanded and opened quickly with the onset of the flare before the rising of the FR.
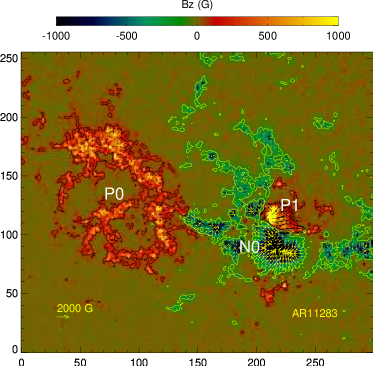
Figure 2 shows a vector magnetogram111The magnetogram is downloaded from website http://jsoc.stanford.edu/jsocwiki/ReleaseNotes2, where products of HMI vector magnetic field datas are released for several ARs. of AR 11283 at 22:00 UT taken by HMI (Schou et al., 2012). Three main polarities are labeled as P0, N0, and P1. Clearly P0 and N0 are much more dispersed than P1, since they were preexisting longer than P1 which emerged into N0 only after September 4. The flare and eruption took place near the polarity inversion line (PIL) between N0 and P1, where non-potential energy is stored by the strongly sheared field. As a parasitic polarity of N0, P1 is surrounded by the negative flux. Such magnetic flux distribution also suggests the existence of a null. Our following numerical models use this magnetogram as input. Unfortunately, this magnetogram is limited to a too small field of view (FoV) to model the global magnetic environment for the eruption, and even worse the FR erupts towards the west and out of magnetogram’s FoV after 22:22 UT. As a result, we can only simulate the very early phase of the eruption process, e.g., how the AR’s local confinement is broken, and still fortunately, this early phase is captured by AIA, with which the simulation can be compared.
3. The Pre-Eruption Magnetic Field
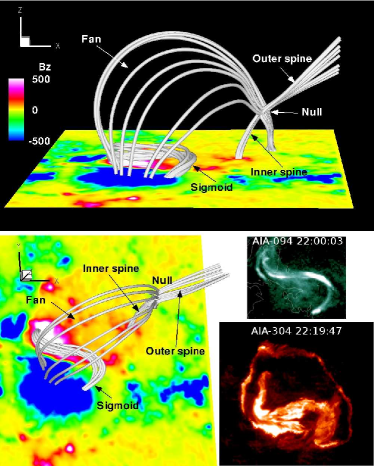
Considering that the coronal magnetic field in static is well modeled by the nonlinear force-free field (NLFFF) model, we have used our CESE–MHD–NLFFF code (Jiang & Feng, 2012; Jiang et al., 2012b) to extrapolate the pre-eruption 3D field at 22:00 UT from the photospheric vector magnetogram as shown in Figure 2. A detailed implementation of this extrapolation has been described by Jiang & Feng (2013), where we show that the large-scale coronal loops are recovered well by the NLFFF solution, and especially the sigmoid is resembled very closely by a bundle of S-shaped field lines near the main PIL of N0-P1. Here we briefly present the basic magnetic topology and review some special aspects of the NLFFF solution, which is important for our interpretation and MHD simulation of the eruption.
Figure 3 and a cross section in Figure 4 show the basic structure of the NLFFF. In Figure 3, the low-lying S-shaped field lines resemble precisely the AIA-94 observation of the sigmoid. Closely above the sigmoid is a FR (see Figure 4), which is strongly sheared but slightly twisted (excluding the kink instability). The core field carries a strong field-aligned current and stores a free energy content of nearly erg, which is sufficient for a major eruption. Overlying the stressed core is the closed flux playing the role of tethers that constrain the pre-eruptive sigmoidal field. Indeed there is a 3D magnetic null point associated with the overlying field. The null locates in the northwest (the direction of the eruption) of the sigmoid with a height of 13 Mm. In the figure we plot several representative field lines closely touching the null, which forms a remarkable X-point configuration at the null (see also Figure 4). These field lines outline the so-called spine-fan topology of a coronal null (Lau & Finn, 1990; Török et al., 2009), as labeled in the figure. Naturally, the fan surface intersects with the chromosphere as a closed circle. The circular flare ribbon is an evidence of reconnection occurring at the null, and is produced by reconnection-accelerated particles chasing along the fan lines down to the chromosphere.
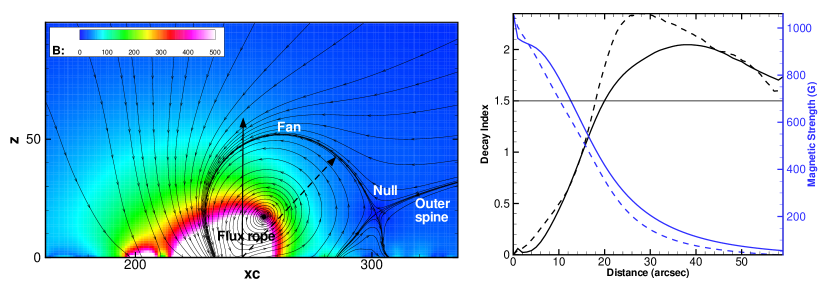
Such field configuration may be unstable as the null reconnection cuts the overlying tethers of the sigmoidal core and facilitates the outward expansion of the FR. Similar configurations, i.e., low-lying sheared/twisted core confined by overlying flux associating with a null were frequently found, e.g., Lugaz et al. (2011); Sun et al. (2012), and Figure 7 of the latter can also be used here to illustrate how the null reconnection works to open the overlying flux. However, the null reconnection does not necessarily leads to a successful eruption, if the overlying envelop flux, even partially cut by reconnection, is still strong enough to confine the stressed core. We thus further study the decay speed of the envelop flux, quantified by a decay index (), to see whether a torus instability (TI) exists here for the FR/overlying flux system (Kliem & Török, 2006; Török & Kliem, 2007). In Figure 4, the decay indexes along two different directions from near the PIL at the bottom (shown in the left panel) are plotted (in the right panel). Clearly in both directions, the FR reaches almost (but not fully) the domain of TI, in which the decay index is above the critical threshold of 1.5 for TI as found by (e.g, Török & Kliem, 2007; Aulanier et al., 2009). Furthermore, the field decays faster in the non-radial direction than in the radial direction (also can be seen in the field strength image in Figure 4), thus can result effectively a non-radial eruption.
Hence the eruption appears to be caused jointly by tether cutting at the null and TI. Specifically, the null reconnection first cuts some overlying tethers, resulting in a small expansion of the FR, which thus enters into the unstable regime of TI; the TI then drives the explosion of the FR, producing a fast evolution due to positive feedback between the tether-cutting reconnection and the expansion of the FR driven by TI. In the next section we put the extrapolated NLFFF into a MHD model along with a plasma in hydrostatic equilibrium to test such eruption mechanism. Before this, an important remark should be made that the NLFFF solution is not exactly force-free but with small numerical errors, thus there are small residual Lorentz forces (Jiang & Feng, 2013). The residual force can play the role of perturbation to the unstable system by inducing small velocity and triggering reconnection at the null. Also we note that if the NLFFF system is stable, it will just relax to a magnetohydrostatic equilibrium in the MHD computation with balance between Lorentz force and plasma.
4. MHD Modeling of the Eruption
The MHD simulation is carried out using our recently developed CESE–MHD model (Jiang et al., 2012a). Here we solve a full set of 3D time-dependent MHD equations with consideration of solar gravity. No explicit resistivity is included in the magnetic induction equation, and magnetic reconnection is still allowed due to numerical diffusion if current sheets are thin enough and under the grid resolution (e.g., Török & Kliem, 2005). A small kinematic viscosity is used, which may reduce the evolution speed of eruption, but is usually necessary for numerical stability in the computation of an extremely dynamical process. The modeling volume is a rectangle box of 224 arcsec 256 arcsec 256 arcsec, (which is a sub-volume of a larger NLFFF extrapolation box) with our region of interest at the center of the box. A non-uniform mesh is used with the smallest grid arcsec near the bottom (the photosphere) and the largest grid 4 arcsec along the side and top faces of the box. The initial conditions of the simulation consists of the NLFFF solution described in Section 3 and a simplified plasma similar to (Jiang et al., 2012a): the plasma is uniform horizontally and in hydrostatic equilibrium vertically with a constant temperature in the gravitational field. The plasma is configured with low (i.e., the ratio of plasma pressure to magnetic pressure, the samllest value is ) and high Alfvén speed (highest value of km/s) to model the coronal environment (see the profiles of the parameters in Figure 2 of Jiang et al., 2012a). The non-reflecting projected-characteristic method (see Jiang et al., 2011; Wu et al., 2006, and reference therein) is implemented at the side and top boundaries of the computational box. At the bottom surface, all the variables are simply fixed to model the line-tied effect of the high- and dense photosphere. This is reasonable since the eruption is very fast with a short duration of less than 10 minutes during which the photospheric driving effect (e.g., the surface motion and flux emergence) can be neglected. Comparing vector magnetgrams taken at 22:00 UT and 22:24 UT shows that the change is indeed small. The computation is stopped when the expansion of the core field reaches the right side boundary, a bit far away from the edge of FoV of the bottom magnetogram. The end time is at where the time unit is scaled as 20 s.
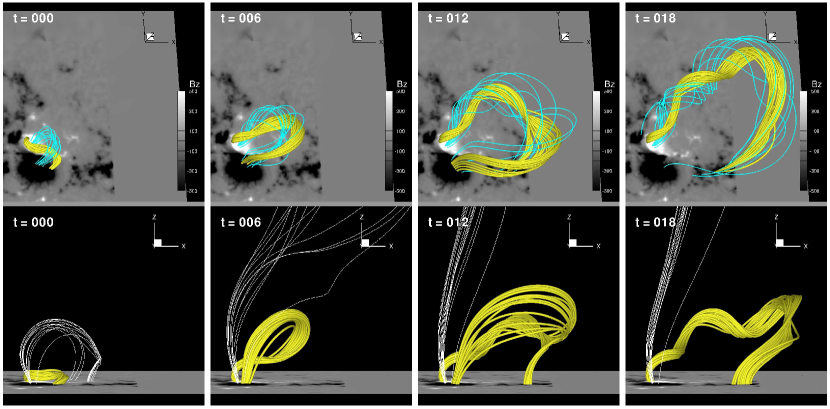
The MHD results shown in Figure 5 are compared with the AIA observations in Figure 1. To show the basic process of the eruption, we plot two sets of field lines, the core field lines and the overlying field lines that initially touch the null point. The core field lines are traced starting from polarity P1, since observation suggests the footpoint of the FR is fixed there. As expected, the overlying flux reconnects and opens and the core field expands and rises rapidly, which confirms the eruption mechanism interpreted in Section 3. The perfect resemblance of the simulation with observations can be seen. Both the development of helical shape and the rising direction of the FR are reproduced almost precisely at each time snapshot as shown. The simulation provides a full 3D picture of the evolution.
The eruption is modulated strongly by the highly-anisotropic ambient field. It is due to the location of the reconnection at the null that leads a strongly inclined non-radial path of the eruption as seen both from the SDO and side views. The observed asymmetry, e.g., that the north leg of the FR is much brighter than the south leg, can be explained well by the simulated field: twist/writhe of the north-leg field is remarkably stronger than the south leg, and thus during the eruption the north leg can hold more plasma by dips due to the twist; moreover the south leg is more vertical (see the side view of the MHD results in Figure 1) and the plasma can easily flow back down by gravity.
Even though magnetic field is fixed at the photosphere, the footpoints of the erupting flux rope are not necessarily fixed there, but instead, they can slip in the same polarity, as is suggested by the observations (see Section 2). The MHD result shows that the south footpoint has moved to the west edge of polarity N0 (in the FoV of the magnetogram) at the end of the computation, which repeats the observed slipping movement. The footpoint slipping can be attributed to the so-called slip-running reconnection in the quasi-separatrix layers (Aulanier et al., 2006) between the FR field and its overlying flux, where very thin current sheet can develop by the stress of the flux expansion.
5. Conclusions
We have carried out a MHD simulation of a sigmoid eruption in a realistic coronal magnetic environment without artificially tuned parameter. Using a CESE–MHD–NLFFF code we first extrapolate the static coronal field prior to eruption. Study of the pre-eruption field shows that there is a coronal null related with the envelope field overlying the sigmoidal core, and the initiation of eruption can be explained by tether cutting at the null triggering a TI of the FR–overlying field system. The NLFFF is then input into a time-dependent MHD model to generate the eruption process. Direct comparison of the eruption field with the SDO/AIA images shows an excellent resemblance, demonstrating our ability of modeling the realistic eruptions. Due to the limited FoV of the magnetogram and model box based on Cartesian geometry, the present simulation can only model how the sigmoidal core breaks its local AR’s confinement, while the explosion out of the large and global field requires including of larger computational volume and even the global corona-solar wind under spherical geometry (Lugaz et al., 2011; Feng et al., 2012).
To our best knowledge, this is probably the first full-MHD simulation of realistic initiation process of solar eruptions. With the success of this simulation, more endeavors of the same kind, i.e., numerical modeling the eruption events in a quantitative way and comparable with observations directly, are inspired to resolve the long-standing problem how solar eruptions are triggered and driven.
References
- Amari et al. (2003) Amari, T., Luciani, J. F., Aly, J. J., Mikic, Z., & Linker, J. 2003, ApJ, 585, 1073
- Antiochos et al. (1999) Antiochos, S. K., DeVore, C. R., & Klimchuk, J. A. 1999, ApJ, 510, 485
- Aulanier et al. (2012) Aulanier, G., Janvier, M., & Schmieder, B. 2012, A&A, 543, A110
- Aulanier et al. (2006) Aulanier, G., Pariat, E., Démoulin, P., & DeVore, C. R. 2006, Sol. Phys., 238, 347
- Aulanier et al. (2009) Aulanier, G., Török, T., Démoulin, P., & DeLuca, E. E. 2009, ApJ, 708, 314
- Aulanier et al. (2010) Aulanier, G., Török, T., Démoulin, P., & DeLuca, E. E. 2010, ApJ, 708, 314
- Canou & Amari (2010) Canou, A. & Amari, T. 2010, ApJ, 715, 1566
- Downs et al. (2012) Downs, C., Roussev, I. I., van der Holst, B., Lugaz, N., & Sokolov, I. V. 2012, ApJ, 750, 134
- Fan (2010) Fan, Y. 2010, ApJ, 719, 728
- Fan (2011) Fan, Y. 2011, ApJ, 740, 68
- Feng et al. (2012) Feng, X., Jiang, C., Xiang, C., Zhao, X., & Wu, S. 2012, The Astrophysical Journal, 758, 62
- Forbes & Isenberg (1991) Forbes, T. G. & Isenberg, P. A. 1991, ApJ, 373, 294
- Forbes et al. (2006) Forbes, T. G., Linker, J. A., Chen, J., Cid, C., Kóta, J., Lee, M. A., Mann, G., Mikić, Z., Potgieter, M. S., Schmidt, J. M., Siscoe, G. L., Vainio, R., Antiochos, S. K., & Riley, P. 2006, Space Sci. Rev., 123, 251
- Guo et al. (2010) Guo, Y., Schmieder, B., Démoulin, P., Wiegelmann, T., Aulanier, G., Török, T., & Bommier, V. 2010, ApJ, 714, 343
- Jiang et al. (2011) Jiang, C., Feng, X., Fan, Y., & Xiang, C. 2011, ApJ, 727, 101
- Jiang et al. (2012a) Jiang, C., Feng, X., Wu, S. T., & Hu, Q. 2012a, ApJ, 759, 85
- Jiang et al. (2012b) Jiang, C., Feng, X., & Xiang, C. 2012b, ApJ, 755, 62
- Jiang & Feng (2012) Jiang, C. & Feng, X. 2012, ApJ, 749, 135
- Jiang & Feng (2013) —. 2013, ApJ, 769, 144
- Kliem et al. (2010) Kliem, B., Linton, M. G., Török, T., & Karlický, M. 2010, Sol. Phys., 266, 91
- Kliem & Török (2006) Kliem, B. & Török, T. 2006, Physical Review Letters, 96, 255002
- Lau & Finn (1990) Lau, Y.-T. & Finn, J. M. 1990, ApJ, 350, 672
- Lugaz et al. (2011) Lugaz, N., Downs, C., Shibata, K., Roussev, I. I., Asai, A., & Gombosi, T. I. 2011, ApJ, 738, 127
- MacNeice et al. (2004) MacNeice, P., Antiochos, S. K., Phillips, A., Spicer, D. S., DeVore, C. R., & Olson, K. 2004, ApJ, 614, 1028
- Masson et al. (2009) Masson, S., Pariat, E., Aulanier, G., & Schrijver, C. J. 2009, ApJ, 700, 559
- Roussev et al. (2012) Roussev, I., Galsgaard, K., Downs, C., Lugaz, N., Sokolov, I., Moise, E., & Lin, J. 2012, Nature Physics, 8, 845
- Savcheva et al. (2012) Savcheva, A., Pariat, E., van Ballegooijen, A., Aulanier, G., & DeLuca, E. 2012, ApJ, 750, 15
- Schmieder et al. (2013) Schmieder, B., Démoulin, P., & Aulanier, G. 2013, Advances in Space Research, 51, 1967
- Schou et al. (2012) Schou, J., Scherrer, P. H., Bush, R. I., Wachter, R., Couvidat, S., Rabello-Soares, M. C., Bogart, R. S., Hoeksema, J. T., Liu, Y., Duvall, T. L., Akin, D. J., Allard, B. A., Miles, J. W., Rairden, R., Shine, R. A., Tarbell, T. D., Title, A. M., Wolfson, C. J., Elmore, D. F., Norton, A. A., & Tomczyk, S. 2012, Sol. Phys., 275, 229
- Sun et al. (2012) Sun, X., Hoeksema, J. T., Liu, Y., Chen, Q., & Hayashi, K. 2012, ApJ, 757, 149
- Titov & Démoulin (1999) Titov, V. S. & Démoulin, P. 1999, A&A, 351, 707
- Török et al. (2009) Török, T., Aulanier, G., Schmieder, B., Reeves, K. K., & Golub, L. 2009, ApJ, 704, 485
- Török & Kliem (2005) Török, T. & Kliem, B. 2005, ApJ, 630, L97
- Török & Kliem (2007) —. 2007, Astronomische Nachrichten, 328, 743
- Török et al. (2011) Török, T., Panasenco, O., Titov, V. S., Mikić, Z., Reeves, K. K., Velli, M., Linker, J. A., & De Toma, G. 2011, ApJ, 739, L63
- Török et al. (2013) Török, T., Temmer, M., Valori, G., Veronig, A. M., van Driel-Gesztelyi, L., & Vršnak, B. 2013, Sol. Phys., 286, 453
- Wang & Liu (2012) Wang, H. & Liu, C. 2012, ApJ, 760, 101
- Wiegelmann & Sakurai (2012) Wiegelmann, T. & Sakurai, T. 2012, Living Reviews in Solar Physics, 9, 5
- Wu et al. (2006) Wu, S. T., Wang, A. H., Liu, Y., & Hoeksema, J. T. 2006, ApJ, 652, 800
- Zuccarello et al. (2012) Zuccarello, F. P., Meliani, Z., & Poedts, S. 2012, ApJ, 758, 117