Revealing the heavily obscured AGN population of High Redshift 3CRR Sources with Chandra X-ray Observations.
Abstract
Chandra observations of a complete, flux-limited sample of 38 high-redshift (1z2), low-frequency selected (and so unbiased in orientation) 3CRR radio sources are reported. The sample includes 21 quasars (= broad line radio galaxies) and 17 narrow line radio galaxies (NLRGs) with matched 178 MHz radio luminosity (log L). The quasars have high radio core-fraction, high X-ray luminosities (log LX) and soft X-ray hardness ratios (HR) indicating low obscuration. The NLRGs have lower core-fraction, lower apparent X-ray luminosities (log LX) and mostly hard X-ray hardness ratios (HR) indicating obscuration ( cm-2). These properties and the correlation between obscuration and radio core-fraction are consistent with orientation-dependent obscuration as in Unification models. About half the NLRGs have soft X-ray hardness ratios and/or high OIII] emission line to X-ray luminosity ratio suggesting obscuration by Compton thick (CT) material so that scattered nuclear or extended X-ray emission dominates (as in NGC1068). The ratios of unobscured to Compton-thin ( (int) cm-2) to CT ((int) cm-2) is 2.5:1.4:1 in this high luminosity, radio-selected sample. The obscured fraction is 0.5, higher than is typically reported for AGN at comparable luminosities from multi-wavelength surveys (). Assuming random nuclear orientation, the unobscured half-opening angle of the disk/wind/torus structure is o and the obscuring material covers 30o of which o is Compton thick. The multi-wavelength properties reveal that many NLRGs have intrinsic absorption higher than indicated by their X-ray hardness ratios, and their true LX values are 10–100 larger than the hardness-ratio absorption corrections would indicate.
1 Introduction
The standard model for the nuclear regions of an active galaxy (AGN) includes a super-massive black hole (SMBH) surrounded by an accretion disk (AD) and corona producing strong, thermal optical-UV-soft X-ray and non-thermal X-ray emission. Gas and dust in the vicinity are heated by the nuclear emission producing the broad and narrow ultraviolet (UV), optical and infrared (IR) emission lines, and near-IR hot dust emission characteristic of AGN. Radio-loud (RL) AGN also include relativistic jets of plasma streaming outwards from the nucleus along the accretion disk axis and emitting non-thermal synchrotron and associated inverse-Compton radiation. The observed radio structures include jets, hot-spots, and lobes for which the appearance (core-/lobe-dominated) is strongly related to the viewing-angle/orientation of the source to our line-of-sight (Barthel, 1989). AGN are broadly classified into type 1 sources, with both broad and narrow UV-IR emission lines, and type 2 sources with only narrow emission lines. The detection of polarized broad lines in 3C 234 (Antonucci, 1984) and NGC1068 (Antonucci & Miller, 1985) led to the general acceptance that some fraction of (narrow-lined) Seyfert 2s are absorbed, edge-on (broad-lined) Seyfert 1s, so that absorption and orientation are also factors for at least some radio-quiet AGN. The generally accepted Unification model for AGN (Barthel, 1989; Antonucci & Miller, 1985) interprets the observed range in emission line, radio structure, and other properties as being primarily due to the orientation of the source relative to our line-of-sight.
As a result of the orientation-dependence of their observational characteristics, a critical problem in understanding AGN is to distinguish observed differences due to orientation from intrinsic physical differences. The AD and corona, possibly combined with a larger torus and/or wind (Elvis, 2000; Konigl & Kartje, 1994), provide obscuration which is anisotropic and strongly frequency-dependent and results in complex, orientation-dependent selection effects for observations in most wavebands. This affects both source detection and classification. The orientation dependence of the observed Spectral Energy Distributions (SEDs) of AGN results in difffering levels of bias against most obscured sources in traditional optical/ultraviolet/near-infrared/soft X-ray surveys. Orientation unbiased surveys, which would properly test Unification schemes, are difficult to come by.
The advent of the Great Observatories has facilitated a number of major multi-wavelength surveys (e.g. SWIRE (Lonsdale et al., 2003), GOODS (Giavalisco et al., 2004), Boötes (Hickox et al., 2007), ChaMP (Kim et al., 2007), COSMOS (Scoville et al., 2007), AEGIS (Davis et al., 2007; Eisenhardt et al., 2004), CANDELS (Grogin et al., 2011), HERMES (Oliver et al., 2012)) which, through the use of hard X-ray and/or mid-infrared (IR) selection, probe the AGN population, including obscured objects, more completely than traditional surveys (Best et al., 2000; Polletta et al., 2006). Mid-IR selection requires secondary, usually X-ray selection to distinguish AGN from the larger IR galaxy population (Donley et al., 2012; Polletta et al., 2006; Barmby et al., 2006), but even then a bias against highly-obscured sources remains. Although incomplete, surveys at near-IR wavelengths (2MASS, Cutri et al. (2002); Martínez-Sansigre et al. (2005)) have revealed a population of red, moderately obscured AGN (Wilkes et al., 2002, 2005) of both types 1 and 2 with space density comparable to normal type 1 AGN. Current Cosmic X-ray Background (CXRB) models successfully include equal populations of unobscured and moderately obscured (log (int) ) AGN to model the emission up to keV (Gilli et al., 2007). But a population of Compton thick (CT, cm-2) AGN comparable to that of Compton thin AGN is required to explain the higher energy (30 keV) CXRB. This CT population remains mostly undetected individually. They are difficult to find, even at Chandra and XMM-Newton X-ray energies (10 keV). Direct light from NGC 1068, the “Rosetta-stone” type 2 source, is undetected by BeppoSAX i.e. to energies 100 keV (Matt et al., 1997). Estimates, which are based on the small numbers found and/or on X-ray stacking techniques (Fiore et al., 2012, 2009; Daddi et al., 2007; Polletta et al., 2006; Tozzi et al., 2006; Bassani et al., 2006; Panessa et al., 2006; Cappi et al., 2006; Risaliti et al., 1999), cover a wide range ( the rest of the AGN population).
Low-frequency radio-selection, which is based on extended, optically-thin emission and so largely independent of orientation, provides the only way to assemble a complete, randomly-oriented sample of AGN. We are therefore carrying-out a multi-wavelength study of a well-defined sample of low-frequency radio-selected (178 MHz), high-redshift (1z2), and thus high-luminosity (log L), 3CRR radio sources. A major advantage provided by the radio data is an independent orientation indicator in the relative strength of (beamed) core and (isotropic) extended emission (core fraction = Fcore/Flobe(5 GHz), Orr & Browne (1982)). Models for the AGN nuclear obscuration range from geometrically thick, smooth (Krolik & Begelman, 1988) or clumpy (Nenkova et al., 2008) tori to accretion disks with winds (Konigl & Kartje, 1994; Elvis, 2000) and/or warps (Lawrence & Elvis, 2010). The key input of the X-ray absorption column densities, IR-optical SEDs, and radio core fraction can help to discriminate between and/or constrain these models.
One caveat to a radio-loud sample is that only % of AGN are radio-loud, and they may not accurately represent the majority AGN population, e.g. radio emitting plasma may affect the opening angle of the torus (Falcke et al., 1995), and generally the X-ray emission includes an extra extended component related to the radio core and jet.
1.1 X-rays from radio-loud quasars.
The X-ray emission from radio-quiet (RQ) AGN is well-known to include multiple components (Mushotzky et al., 1993). As well as the non-thermal, accretion-related power law which dominates the X-ray emission of luminous broad-lined AGN, contributions from a soft excess, generally linked to the AD, reflected emission from hot and/or cold material surrounding the nucleus, emission lines (Ogle et al., 2003), and/or scattered nuclear light become significant in lower luminosity sources and at high inclinations when the nuclear light is strongly obscured (Mushotzky et al., 1993). For radio-loud AGN (RLAGN) additional, non-thermal X-ray emission is commonly associated with radio structures, lobes, and hot spots. This can generally be resolved from the nuclear X-ray emission with the high spatial resolution of Chandra (Wilkes et al., 2012; Worrall, 2009; Harris & Krawczynski, 2006). In the nucleus, the presence of an additional beamed, radio-jet-related component is demonstrated by the, on average, higher soft X-ray luminosity (Zamorani et al., 1981) and harder spectrum (Wilkes & Elvis, 1987; Worrall & Wilkes, 1990) of core-dominated (face-on), broad-lined RLAGN in comparison with RQAGN as observed with the Einstein Observatory.
The strong correlation between core radio and X-ray luminosities (Hardcastle & Worrall, 1999; Worrall & Birkinshaw, 1994; Fabbiano et al., 1984) supports a Unification model in which beamed radio and X-ray emission originate at the base of the jet with the latter being related to the radio via synchrotron or synchrotron self-Compton processes. In lobe-dominated and edge-on sources, where a smaller beaming factor reduces the emission from this component, the X-ray emission lies above the X-ray/radio core correlation, and the spectrum is softer, consistent with a significant contribution from an accretion-related component as in RQAGN (Hardcastle & Worrall, 1999). At low redshift (z1) it has been possible to distinguish or place limits on the relative contributions from nuclear jet- and accretion-related X-ray components and confirm that the jet-related component is more strongly related to the core radio emission and absorption of the accretion-related component is related to source orientation (Hardcastle et al., 2009; Evans et al., 2006; Belsole et al., 2006). The lower signal-to-noise (S/N) of the X-ray data for the higher redshift 3CRR sources presented here does not allow such separation.
1.2 Orientation, Obscuration and Unification.
While a level of Unification of luminous quasars and radio galaxies is well-established (Barthel, 1989), the variations in the relative numbers of quasars and radio galaxies as a function of redshift and/or luminosity have called the simplest version of that scheme into question (Singal, 1993; Lawrence & Elvis, 1982). The ratio of obscured to all AGN (the “obscured fraction”) remains a matter of debate as different studies draw a variety of conclusions. At low redshift and luminosity, optical surveys show that type 2 AGN appear to be more numerous than type 1 by a factor of a few: obscured fractions of (Maiolino & Rieke, 1995; Huchra & Burg, 1992; Lawrence & Elvis, 1982) are typical. Hard X-ray surveys, which are sensitive to gas rather than dust obscuration, find luminosity-dependent obscured fractions of 0.20.8 at low-redshift (z 0.1, INTEGRAL, Sazonov et al. (2012), Swift/BAT, Burlon et al. (2011)). High luminosity, radio-selected samples indicate an obscured fraction of 0.6 consistent with an unobscured half-opening angle of in Unification models (Willott et al., 2000) but with a luminosity dependence (Grimes et al., 2005) which can be explained by the “receding torus model” (Falcke et al., 1995; Lawrence, 1991). The 3CRR sample (Laing et al., 1983) also shows a dependence on luminosity with obscured fractions of 0.67 in the redshift range 0.5z 1 (Barthel, 1989) and 0.5 in the current sample (1 z 2). Estimates based on the luminosity of the narrow, optical OIII]5007 emission line show a range of 0.40.9, also decreasing with luminosity (Simpson, 2005). X-ray surveys, again measuring the absorbing gas, generally conclude that the obscured fraction decreases with luminosity and increases with redshift, covering a range of (Hasinger, 2008; Treister & Urry, 2006; La Franca et al., 2005) although the redshift dependence may only be present at high luminosities (LX erg s-1, Iwasawa et al. (2012); Gilli et al. (2010)). However Dwelly & Page (2006) find no relation between the obscured fraction and either luminosity or redshift in their analysis of deep XMM-Newton observations of the Chandra Deep Field South (CDFS). Estimates based on the IR emission imply a higher obscured fraction at high luminosity (), a difference which may be due to missing highly-obscured sources in the X-ray surveys (Polletta et al., 2008; Treister et al., 2008).
An alternate explanation for a luminosity dependence of the obscured fraction is contamination by a second population of sources at low luminosity which are not standard, actively-accreting AGN (Grimes et al., 2004; Willott et al., 2000). There is a significant subset of low-luminosity NLRGs with low-ionisation emission lines (LERG, low-ionisation emission-line radio galaxy). Most FRI-type radio sources (Fanaroff & Riley, 1974) and a subset of the lower-radio power (P178MHz 1026.5 W Hz-1 sr-1) FRII-type (Chiaberge et al., 2002; Grimes et al., 2004) are classified as LERGs. LERGS generally have weak, largely unobscured X-ray emission (Hardcastle et al., 2009) and weak mid-IR emission (L(15m) erg s-1, Ogle et al. (2006)), both of which correlate with AGN luminosity indicators such as OIII]5007 emission line luminosity (LOIII]) (Dicken et al., 2009; Maiolino & Rieke, 1995) and core radio strength. Thus there is no evidence for a hidden, actively accreting nucleus, and LERGs may be powered by a radiatively inefficient accretion flow (Hardcastle et al., 2009; Evans et al., 2006; Ogle et al., 2006; Ghisellini & Celotti, 2001). In this case, the unresolved radio, IR, and X-ray cores would be purely jet- rather than accretion-related, e.g. as in M87 (Whysong & Antonucci, 2004; Willott et al., 2000), and LERGs would not be part of the primary AGN population. The obscured fraction in the 3CRR sample determined without the LERGs is with little/no dependence on redshift or luminosity (Ogle et al., 2006; Barthel, 1989). It is clear that studies of the obscured fraction as a function of luminosity and z need to take account of source classification.
Spitzer studies of luminous 3CRR sources, i.e. excluding LERGs, from z show no luminosity dependence of the obscured fraction and thus support simple Unification. At shorter wavelengths, our multi-wavelength study of the high-redshift (z1) 3CRR radio sample has demonstrated a marked difference between the Spitzer-observed IR SEDs of radio galaxies and quasars (Haas et al., 2008; Leipski et al., 2010; Ogle et al., 2006; Shi et al., 2005) which can be explained by nuclear obscuration of a randomly-oriented sample in a Unification model. Studies of lower-redshift 3CRs agree but also show evidence for a contribution to the inclination dependence from beamed emission (Cleary et al., 2007). At longer wavelengths, 24m and 70m, emission is unrelated to the source orientation (Dicken et al., 2009; Haas et al., 2004). Herschel observations suggest a significant contribution by star formation, expected to be independent of obscuration, in the far-IR for a subset of the sources (Barthel et al., 2012), supporting results by Tadhunter et al. (2007). The inner parts of the narrow emission line regions (NLR) may also be obscured, weakening the OIII]5007 emission line (Haas et al., 2005; Jackson & Browne, 1990) but not OII]3727 (Hes et al., 1993), and resulting in the higher-ionization lines being visible only in the IR. However, for the highest luminosity radio sources this seems not to be a large effect (Grimes et al., 2004; Jackson & Rawlings, 1997), perhaps due to the more extended and so less obscured NLR in higher luminosity radio sources (Best et al., 2000).
1.3 This paper
The high-redshift 3CRR sample, which includes only powerful, actively accreting AGN (no LERGs) with a limited range of both luminosity and redshift, is a particularly uniform and well-suited sample with which to investigate the relation of the full SED to orientation/obscuration and to study the properties of the obscuring material. This paper describes the 3CRR sample (Section 2), presents our analysis of new and existing Chandra and XMM-Newton data (Section 3), characterizes the X-ray properties and investigates their relation to radio and IR emission (Section 4), discusses the results in the context of Unification models (Section 5), and summarizes the conclusions (Section 6).
Throughout the paper we assume a CDM cosmology with Ho=71 km s-1 Mpc-1, , and (Larson et al., 2011).
2 The Sample and Supporting Data
The 3CRR catalog (Laing et al., 1983) contains 180 radio galaxies and Quasi-stellar Radio Sources, quasars, up to redshift = 2.5 and is 100% complete to a flux of 10 Jy at 178 MHz . At these low frequencies all sources are dominated by emission from the radio lobes resulting in little/no bias based on the orientation of the source. The 3CRR sample has been studied in detail over many wavebands. The radio morphologies are well known and their radio sizes, lobe separations and jet prominence, and core fractions at higher frequencies (5 GHz) permit estimates of their radio axis orientation. We have selected a complete sample of high-redshift (1 2) and thus high luminosity, 3CRR sources to ensure they are actively accreting, that none are LERGs (Hine & Longair, 1979), and that the AGN dominates the bolometric luminosity of the source. The complete sample of 38 3CRR high-z sources111which includes two 4C sources found by Laing et al. (1983) to match the 3CRR selection criteria (Table 1) includes 21 lobe-dominated, steep spectrum quasars (a.k.a. broad-line radio galaxies, Quasi-Stellar Objects, QSOs) and 17 narrow line radio galaxies (NLRGs), all of Fanaroff-Riley type FR II with double lobes of P(178 MHz) 1026.5 W Hz-1 generally extending far beyond the host galaxy. A subset of both types (6 quasars, 2 NLRGs) has steep radio spectra () and compact (10 kpc) structure (CSS, compact steep spectrum, O’Dea (1998); Fanti et al. (1985)). There is at most one marginally core-dominated radio source, 3C 245,222A compact triple source with a steep radio spectrum (Barthel et al., 1984; Foley & Barthel, 1990) for which a variable core may result in a high core-fraction. in this sample so that beamed emission is not generally dominant.
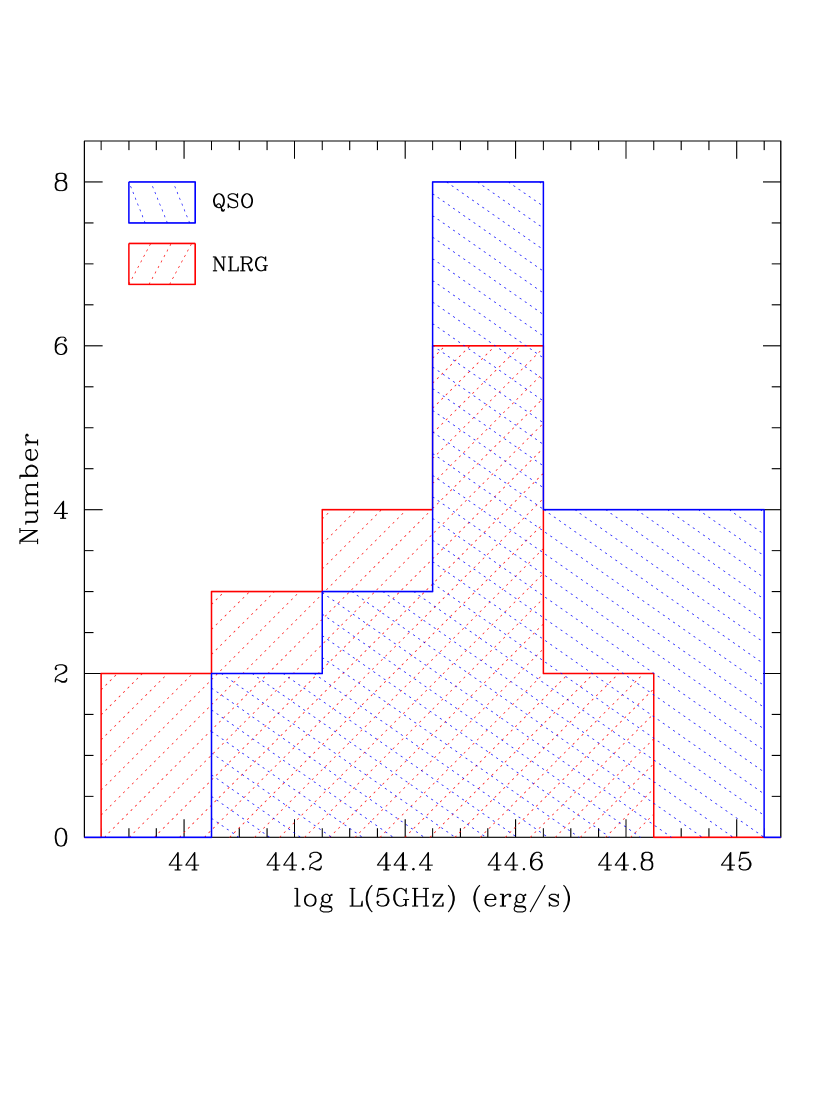
Because of their brightness (F(178 MHz) 10 Jy), the complete nature of the survey, the comprehensive multi-wavelength data available, and their high luminosity, the high-redshift 3CRR sources constitute an excellent sample with which to study orientation-based effects. The mean 5 GHz luminosity (log L erg s-1, Figure 1(left)) is about five times higher than for the 3CRR sources at 0.5 1. The high redshift lowers the effects of X-ray absorption, which largely shifts out of the Chandra band unless the source is close to CT. This strong negative k-correction means that the X-ray flux of heavily absorbed AGN is not such a strong function of redshift in this range (Wilman & Fabian, 1999), and CT AGN are detectable. Spitzer IRAC and MIPS photometry have been obtained to delineate the IR continuum for the full sample and IRS spectroscopy for those in the range 1.0z1.4 (Haas et al., 2008; Leipski et al., 2010).
3 X-ray Data and Analysis
Eleven sources in our high-z 3CRR sample, 2 NLRGs and 9 quasars, were previously observed by Chandra and 4 sources, 3 NLRGs (1 in common with Chandra) and 1 quasar, with XMM-Newton. New Chandra ACIS-S observations were obtained for the remaining 24 quasars and NLRGs and for 3C 270.1 where the existing Chandra data were of poor quality. The exposure times were set for a detection at expected levels for NLRGs and quasars as a function of redshift. Sub-arrays were used for the brightest quasars to avoid pileup issues. The observations used in this paper, both new and archival, are listed in Table 1 along with known properties of the sources and references to published analysis of existing Chandra and/or XMM-Newton X-ray data. All but one sources were detected making this the most complete X-ray-observed sample of AGN to date. There is a wide range of S/N from a few counts for the faintest NLRG to net counts for the brightest quasars.
The Chandra data were processed using the standard pipeline with calibration products appropriate for their observation dates. Archived Chandra datasets observed in ACIS VFAINT mode were reprocessed to take advantage of improved calibration of the CTI correction and background cleaning. Counts were extracted from a 2.2′′ radius circle (to enclose the full point spread function) centered on the X-ray source position for energy bands: broad (B, 0.38.0 keV), soft (S, 0.32.0 keV), and hard (H, 2.08.0 keV). Background counts were extracted in the same energy bands from an annulus centered on the position of each source with inner and outer radii of 15′′ and 35′′ respectively, adjusted if necessary to exclude nearby sources. Any sources remaining within the background annulus were removed. The resulting net counts and hardness ratios333Hardness ratio based on the counts, HR=(H-S)/(H+S) with uncertainties determined using the Bayesian estimation (BEHR) method, (Park et al., 2006) are given in Table 2.
In order to provide a uniform set of derived X-ray properties, all Chandra-observed sources were run through an automated spectral analysis process using the Levenberg-Marquardt optimization method in CIAO/Sherpa with the statistic including the Gehrels variance function, which allows for a Poisson distribution for low-count sources. Two spectral fits were performed, the first fit assumed a power law spectrum with a canonical slope (Just et al., 2007; Mushotzky et al., 1993) and Galactic absorption as characterized by the equivalent hydrogen column density ((gal), Table 1, Dickey & Lockman (1990)) the second added an intrinsic absorption component at the redshift of the source ((int)). The results were inspected individually, and those for the best spectral fits are listed in Table 2, including Galactic and intrinsic absorption-corrected fluxes and luminosities in standard bands. When no significant (int) was detected a upper limit is listed. Spectral fits for sources with low net counts () provided no useful constraint on (int). For sources where the data have sufficient net counts (), mostly quasars, the results of a third spectral fit allowing the power law slope to be free are also listed in Table 2. Derived spectral parameters are consistent with those reported in published data except where noted in the table. Detected (int), indicating absorption in excess of the Galactic column density, is most likely to be absorption intrinsic to the quasar associated with the nucleus and/or the host galaxy. Although unlikely, a contribution from absorption by intervening material/sources along the line-of-sight cannot be ruled out.
There are 3 sources with only XMM-Newton data: 3C 239/322/454.0. The results of published spectral analysis were used to derive equivalent Chandra quantities for 3C 239/454.0 (Salvati et al., 2008). For 3C 322 the XMM-Newton data showed no detection of the AGN (Belsole et al., 2004). In order to determine an upper limit, the data were measured directly (Tables 1,2).
About half the sample show significant extended X-ray emission. An example is 3C 270.1 (Wilkes et al., 2012) with X-ray emission related to the radio structure, as is often observed (Harris & Krawczynski, 2006; Worrall, 2009), along with possible detection of thermal emission from a surrounding cluster. The study of the extended X-ray emission will be covered in a later paper. Extra-nuclear emission originating close to the nucleus will generally not be resolved at these high redshifts. In cases with visible extent which may be contaminating the nuclear X-ray counts determined via the standard extraction region, an additional, smaller region was also used to better isolate the emission from the nucleus. When the results differ, a second set of counts and hardness ratios is reported in Table 2, footnote 12. These counts were not used in our general analysis in order to ensure uniform measurements across the full sample.
4 Results
4.1 X-ray Luminosity
Being low-frequency (178 MHz) radio-selected, for which the emission is generally optically thin, the quasars and NLRGs are well-matched in this orientation-independent parameter. Figure 1(left) shows the distributions of total radio luminosity at the higher frequency of 5 GHz, where beaming is more important. The overlap remains good, with a small shift towards brighter luminosities for the quasars. The difference between the median luminosities of the NLRGs (log L = 44.41), and the quasars (log L = 44.59) indicates that beamed emission from the core contributes on average % of the radio luminosity in the lobe-dominated quasars and likely a similar fraction of the X-ray luminosity as well.
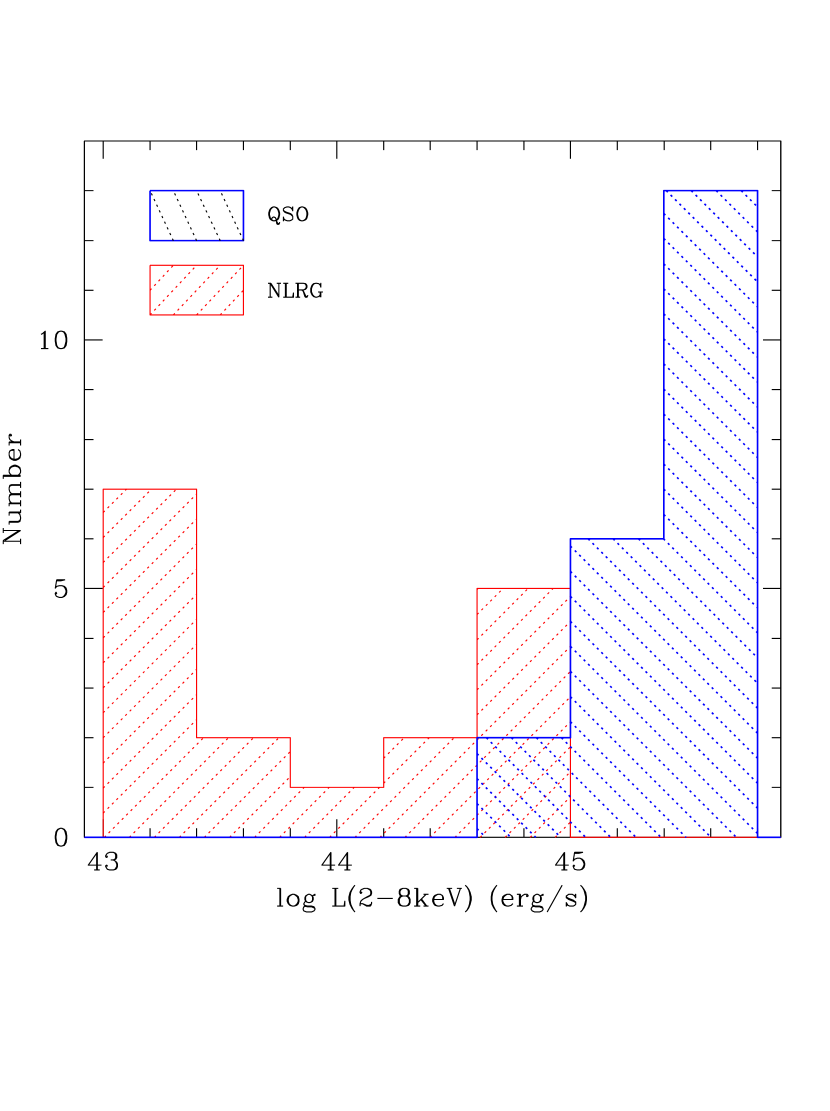
The distribution of X-ray luminosities derived from the initial power law spectral fits, with no (int) included, is shown in Figure 1(right). In contrast to the radio luminosity, the X-ray luminosity distributions barely overlap, demonstrating the well known difference between the observed X-ray emission from quasars and NLRGs with the quasars factors of brighter (Hardcastle & Worrall, 1999; Worrall et al., 1994). In this sample, the ratio of the median LX for quasars and NLRGs is . Unification models interpret this difference as due to obscuration in the edge-on NLRGs.
4.2 X-ray Hardness Ratio and Absorption
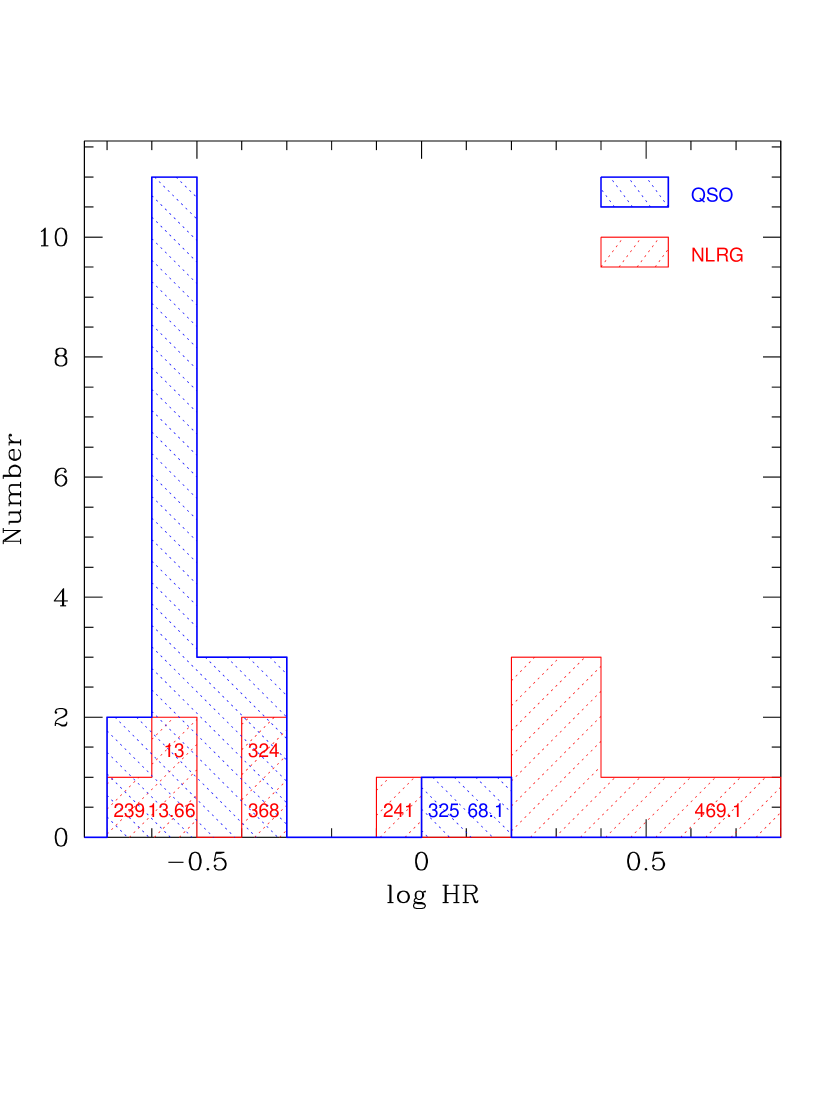
X-ray hardness ratio is an indicator of the intrinsic spectrum which can be used over a wide range of S/N. Assuming the primary power law dominates and that its spectral index is similar in all sources, the hardness ratio statistically indicates the amount of obscuration. Figure 2 shows a comparison of the distribution of X-ray hardness ratios determined using our standard X-ray analysis (Table 2) for the quasars and NLRGs in the 3CRR high-redshift sample. The quasars, with only two exceptions, show soft spectra covering a narrow range of hardness ratio (), consistent with the average spectrum of a quasar: and little/no obscuration. The NLRGs, on the other hand, cover a wide range of hardness ratios (HR). Five are consistent with the soft spectra of quasars, but the majority are significantly harder. The two harder quasars noted above 3C 68.1/325, along with NLRG 3C 241 lie between the quasars and NLRGs, having moderately hard spectra consistent with obscuration by material with (int) cm-2.
The X-ray spectra of quasars are known to include several components, limiting the accuracy with which any intrinsic obscuration can be determined in low S/N data (Section 1). For example, the presence of a soft excess or scattered nuclear emission decreases the estimated obscuration if not accounted in the fits. By contrast, the presence of a reflection component would harden the effective X-ray slope at high energies, resulting in an over-estimate of the obscuration in our single power law fits to individual sources. Thus both hardness ratios and single power law spectral fits can be misleading in individual cases (Wilkes et al., 2005; Pounds et al., 2005). Higher S/N data than are available for the NLRGs in this sample are required to reliably de-convolve any multiple spectral and/or spatial components.
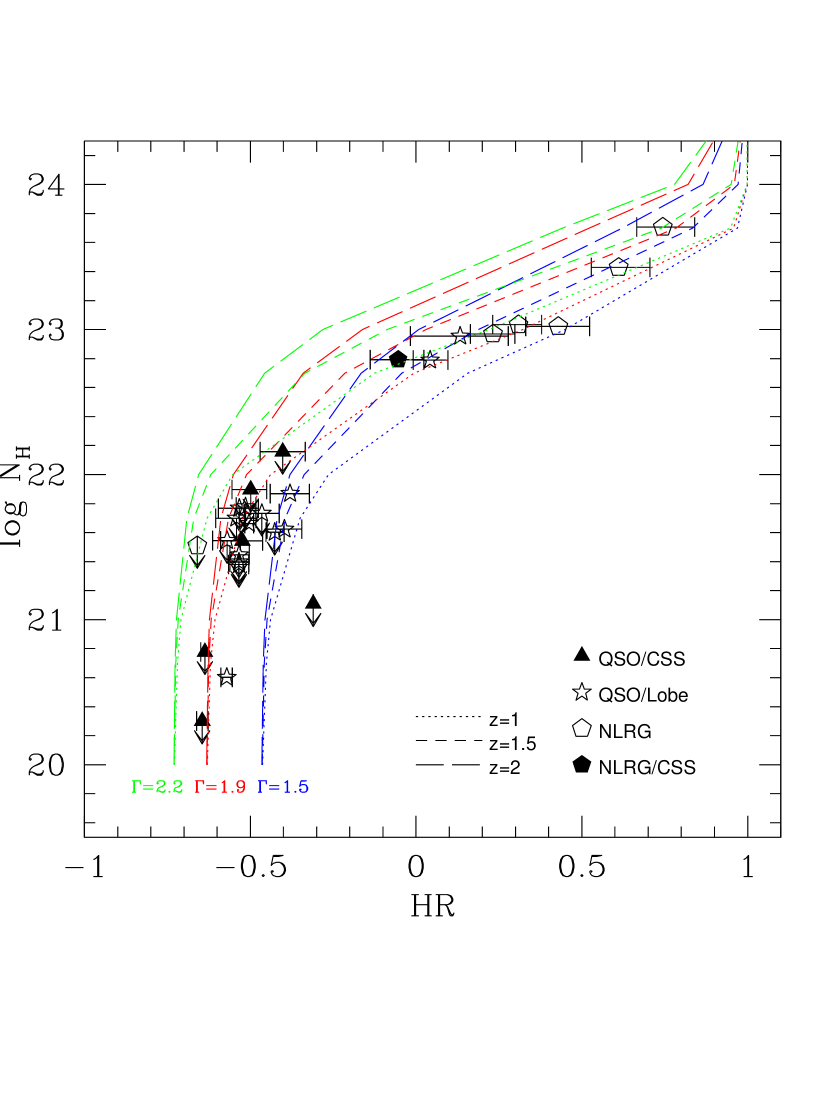
The (int) obtained from the spectral fits is shown in Figure 3 as a function of the observed hardness ratio with lines showing the relationship between (int) and HR for a single, absorbed power law with several slopes and redshifts superposed for comparison. The NLRGs trend similarly to models with the canonical quasar X-ray spectrum (Just et al., 2007) with HRs indicating a maximum detected column density cm-2. The fitted spectral slopes for the 7 quasars (non CSS) with net counts (Table 2) show a mean of 1.690.05 and no evidence for a soft excess. This is harder than the standard slope of 1.9, consistent with a contribution from beamed, jet-related emission which generally has a harder (1.5) slope (Wilkes & Elvis (1987), see Section 1.1).
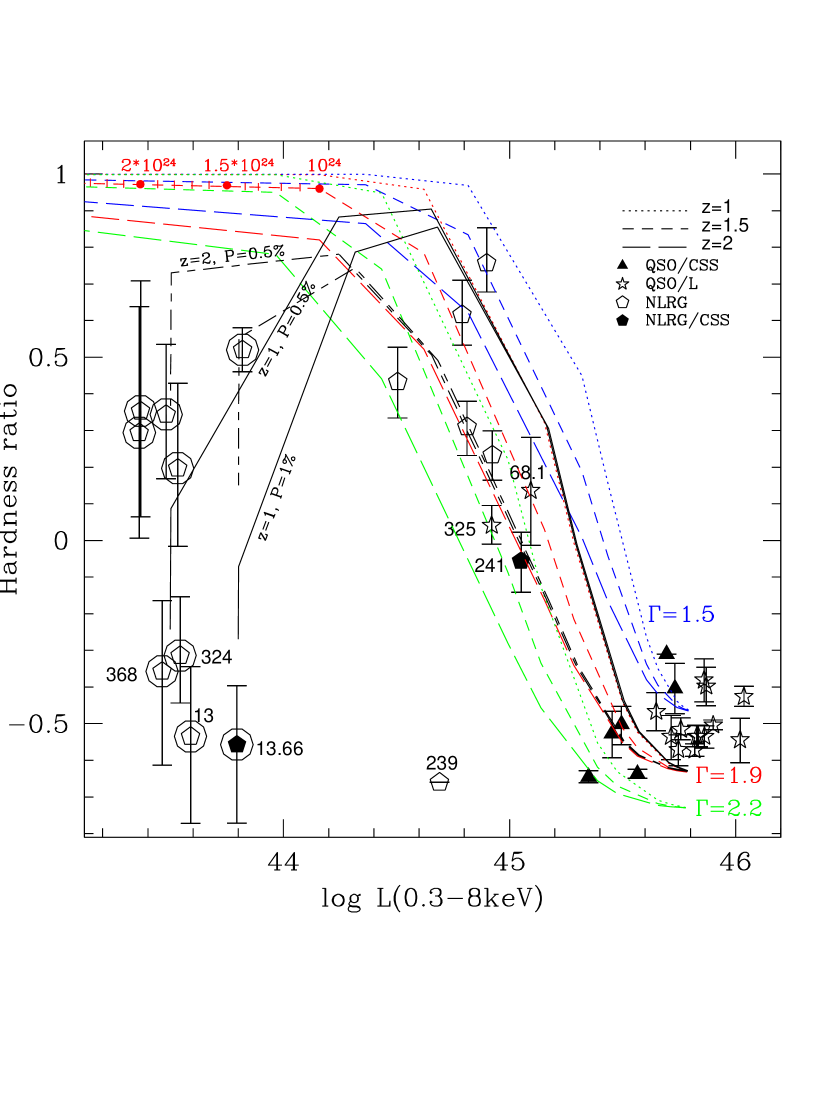
Figure 4 shows the hardness ratio as a function of the broad band X-ray luminosity determined from the spectral fit in our standard analysis but uncorrected for any deduced (int). Models for a power law X-ray spectrum for a luminosity typical of the quasars in the sample with a range of slope (), intrinsic absorption ((int)), and redshift are shown for comparison. The observed quantities are consistent with the models for X-ray luminosities above erg cm-2 s-1, where sources with lower luminosities than the quasars have harder HR as expected for mild absorption. However, as the luminosity decreases further the observed hardness ratios remain constant or soften. This trend can be explained in terms of spectral complexity, where contributions from weaker components (e.g. soft excess, reflection) become significant as the dominant power law emission is absorbed away. To illustrate the effect of a weaker component, the black lines in Figure 4 show the addition of nuclear power law emission () scattered from extended material at levels of 0.5% and 1% for z=1,2. This example demonstrates that an additional, soft component can explain the HRs of the lowest LX NLRGs in this figure.
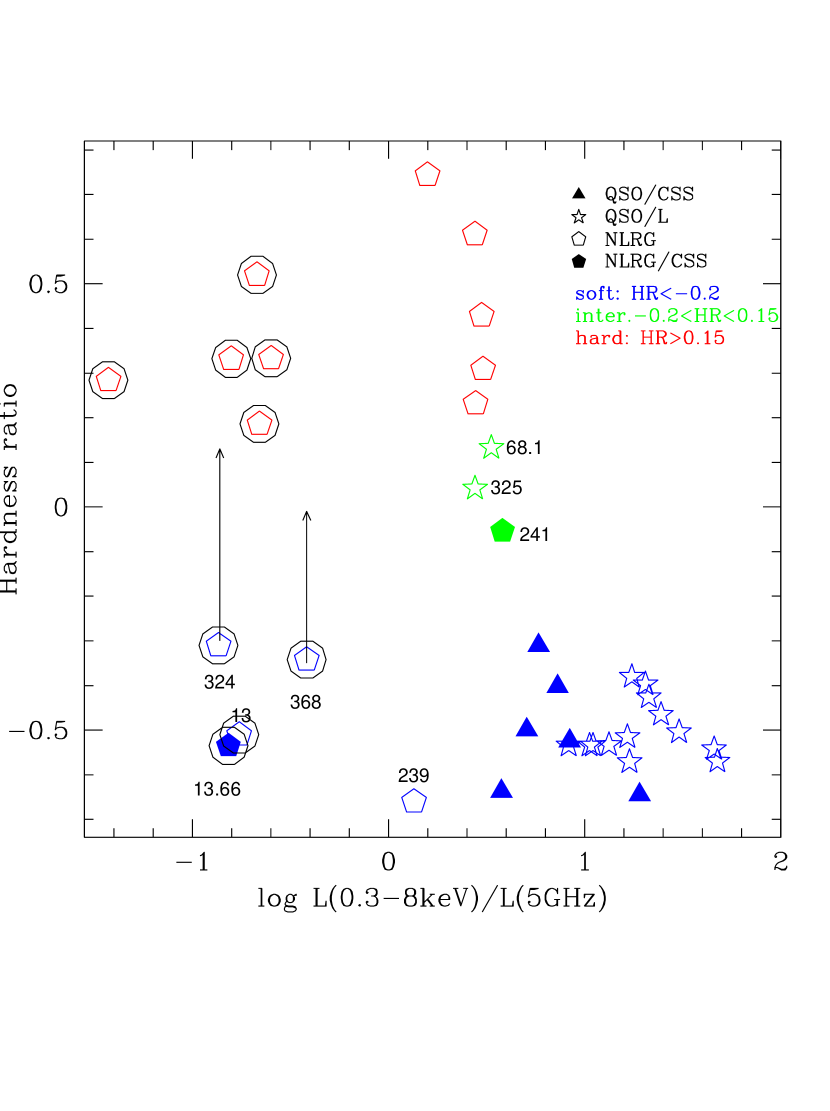
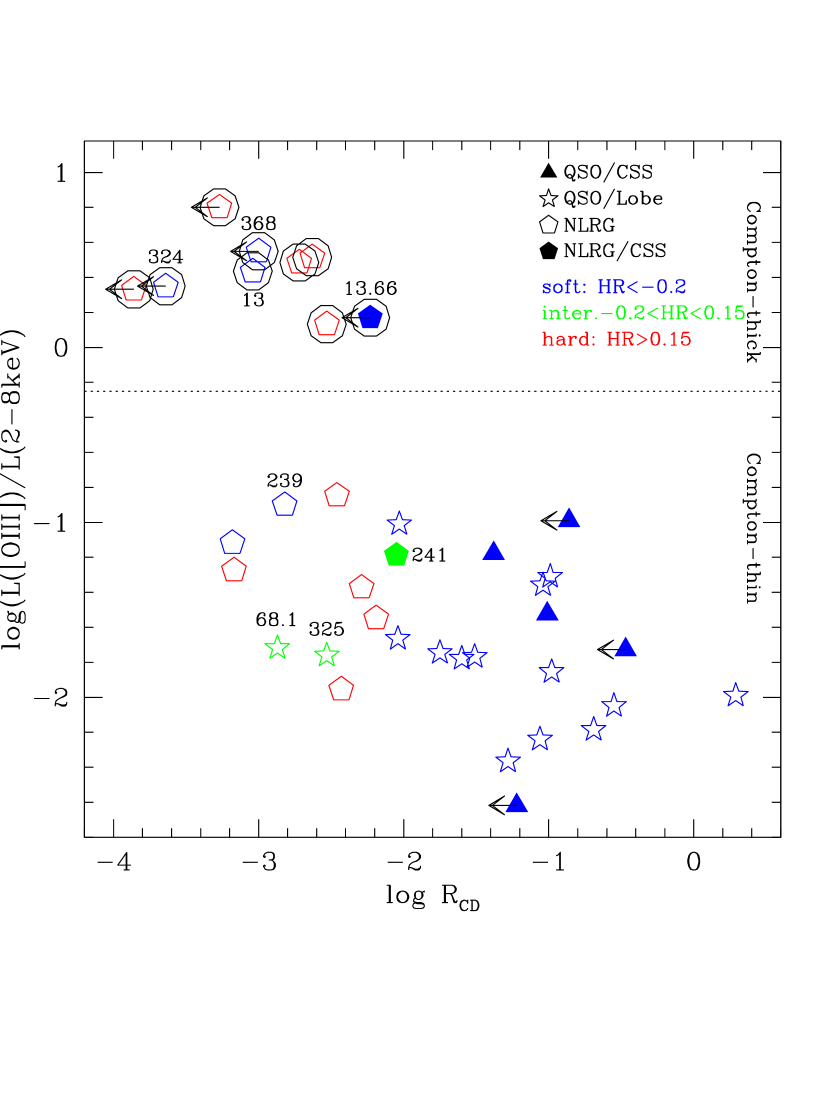
A more general measure of the relative X-ray luminosity is given by normalizing to the total radio luminosity. Figure 5 shows the hardness ratio as a function of X-ray to total radio luminosity ratio, LX/LR (=LX(0.3-8 keV)/L). Since the range of LX for the quasars is small, the trends are very similar to those in Figure 4. This figure clearly shows the 3 intermediate sources discussed earlier (quasars 3C 68.1/325 and NLRG 3C 241) which lie in between the rest of the quasars and NLRGs suggesting intermediate obscuration levels. The upwards arrows indicate the change in HR for soft NLRGs 3C 324/368 when using a smaller (1′′ arcsec) circle to extract the counts, excluding some of the extended emission clearly present in these two sources (Table 2, footnote 12).
For sources with counts, the spectral fits do not provide useful constraints on (int). However, based on the comparison between models and data in Figure 4, we conclude that the lower values of LX and LX/LR in NLRGs are due to obscuration. Thus LX/LR is a more reliable obscuration indicator than the X-ray HR which includes additional, soft X-ray emission components. The factor of lower X-ray luminosities for the NLRGs indicate intrinsic column densities (int) cm-2 in the current sample. This corresponds to AV, (Seward, 2000). Values of (int) determined for the 9 low-count sources (encircled in Figure 4) using the models in that figure are listed in Table 3.
4.3 X-ray and mid-IR Properties
Spitzer observations of the high-redshift 3CRR sample (Haas et al., 2008) demonstrate uniform power law plus silicate emission SEDs for the quasars while the NLRGs show a variety of SED shapes. The latter are interpreted in terms of a range of quasar to host galaxy ratios and absorption properties. Quasars and NLRGs separate well in the optical depth of 9.7m silicate absorption () with the NLRGs having higher values (Leipski et al., 2010). The level of also tracks the source orientation (). The one exception in this sample is 3C 190, a CSS quasar with significant silicate absorption (= 0.60, see Section 5.3).
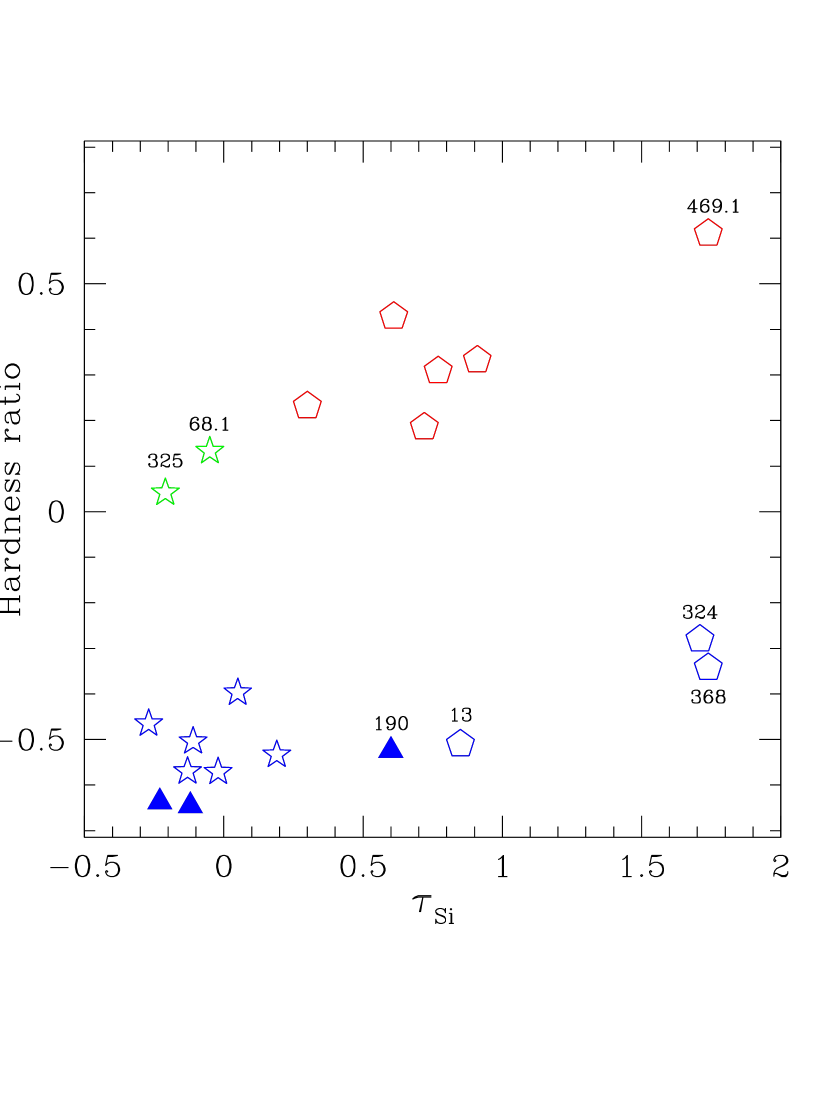
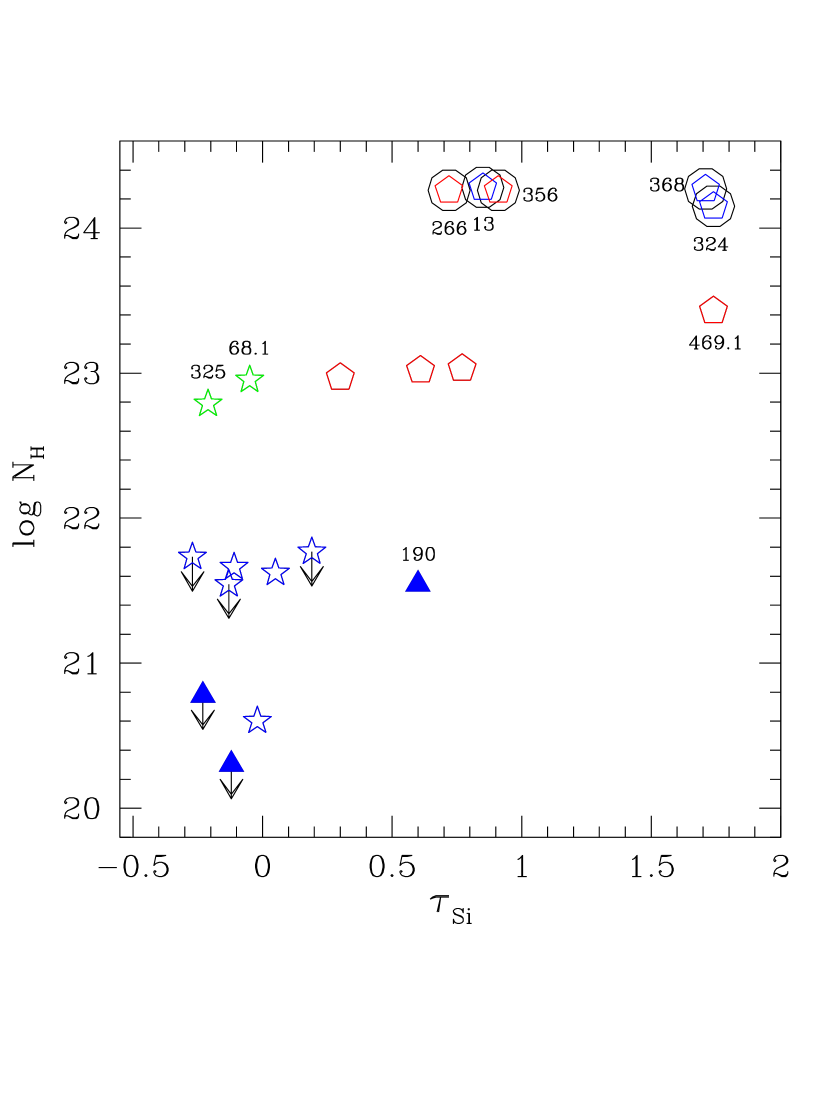
X-ray absorption column densities are often significantly higher than those in the visible or IR (factors of 3-100, Maiolino et al. (2001)), implying differing lines of sight, low gas-to-dust ratios perhaps due to high temperatures in the material close to the nucleus, or a lack of small grains in the nuclear dust (Gaskell et al., 2004). A reported correlation between the strength of the silicate absorption feature and estimated X-ray absorption (Shi et al., 2006) indicates higher X-ray (gas) column density. Figure 6 shows the X-ray hardness (left) and the estimated (int) (right) as a function of from Leipski et al. (2010). Relative to an average quasar spectrum, which includes silicate 9.7m emission, the NLRGs, including those with soft hardness ratios, show significant . This implies that gas (X-ray absorption) and dust (IR absorption) are related. However the intermediate sources, 3C 68.1/325,444The third, 3C 241 was not observed with the Spitzer IRS look like quasars in the IR, with no significant and inconsistent with a detailed gas/dust spatial correlation. Tests show a significant correlation of with X-ray (int) in the current sample (P0.0001, Kendall’s test).
The three sources with the highest (1) are well separated from the remainder of the galaxies in Figure 6. Of these, two X-ray soft NLRGs 3C 324/368 are known to be located in edge-on host galaxies (Best et al., 1998; Laskar et al., 2010), supporting earlier suggestions that the host galaxy contributes significantly to the IR obscuration in active galaxies and quasars (Goulding et al., 2012; Deo et al., 2009). The optical data for the third, NLRG 3C 469.1, are of too low quality to confirm a similar edge-on view, but the extended, aligned radio and X-ray emission (Laskar et al., 2010) are suggestive.
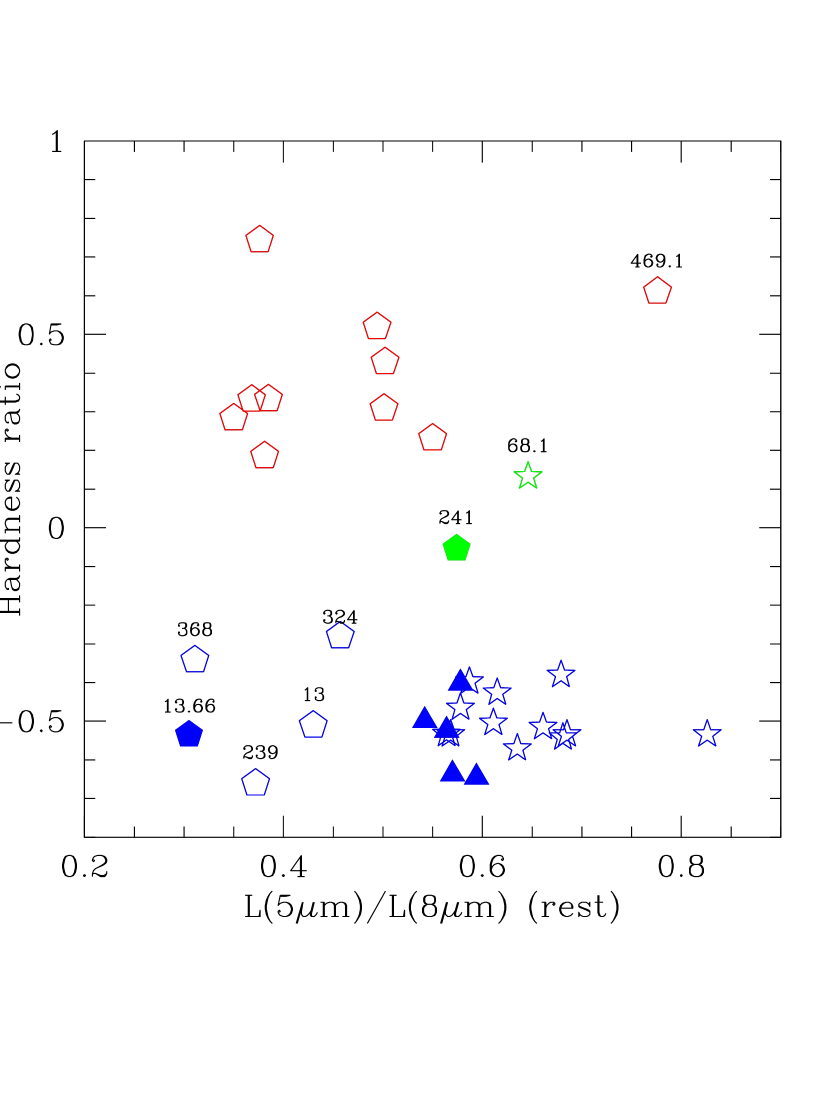
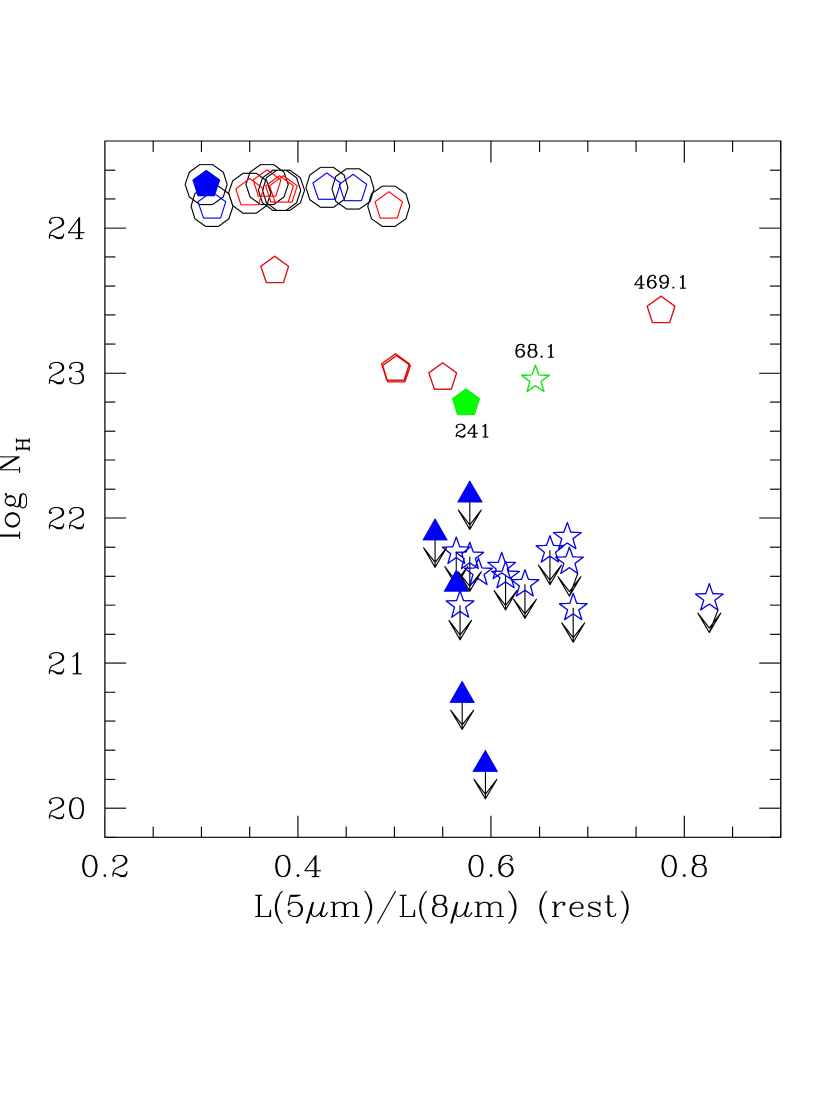
Figure 7 shows X-ray HR (left) and (int) (right) as a function of rest-frame L5μm/L8μm555k-corrected based on the observed slope between 8m (IRAC) and 24m (MIPS). which is also demonstrated to be an absorption indicator (Haas et al., 2008). Quasars are relatively unabsorbed with high L5μm/L8μm while NLRGs are absorbed with lower values. While the X-ray and IR absorption appear to be related, there is no significant correlation with either X-ray HR or (int). The intermediate sources have quasar-like L5μm/L8μm. NLRG 3C 469.1 is once again unusual. It has very strong silicate absorption so that the derived rest-frame L5μm/L8μm is unusually blue (Figure 7). Apart from this anomally, the IR and visible SED of 3C 469.1 (Figure 8) is red and consistent with that of a NLRG (Leipski et al., 2010).
The near-IR obscuration of the NLRGs deduced from the L5μm/L8μm ratio indicates an average obscuration AV (Haas et al., 2008), while that indicated by is lower, AV (Leipski et al., 2010). The X-ray data imply AV, again showing the tendency for the X-ray absorption to be higher. The difference in the two IR absorption indicators suggests that the hot dust component (m) is closer to the AGN than the MIR emission/absorption region (Deo et al., 2011).
4.4 Radio Core Fraction
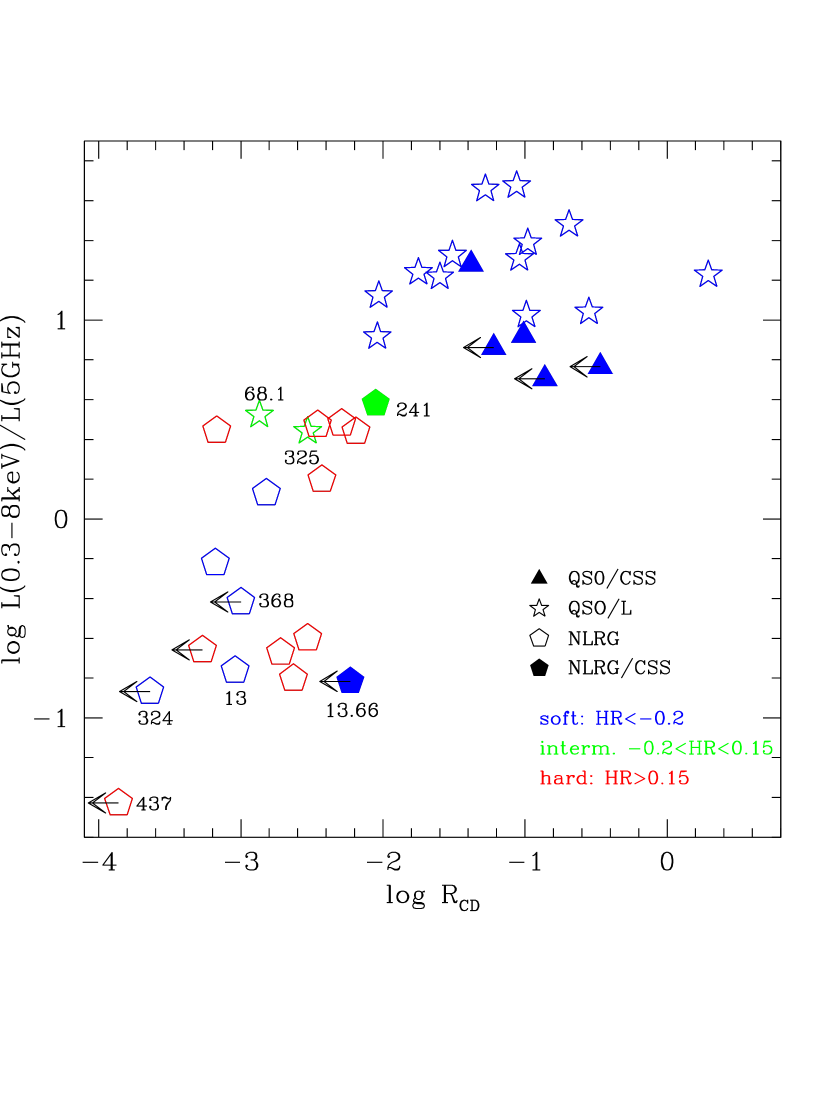
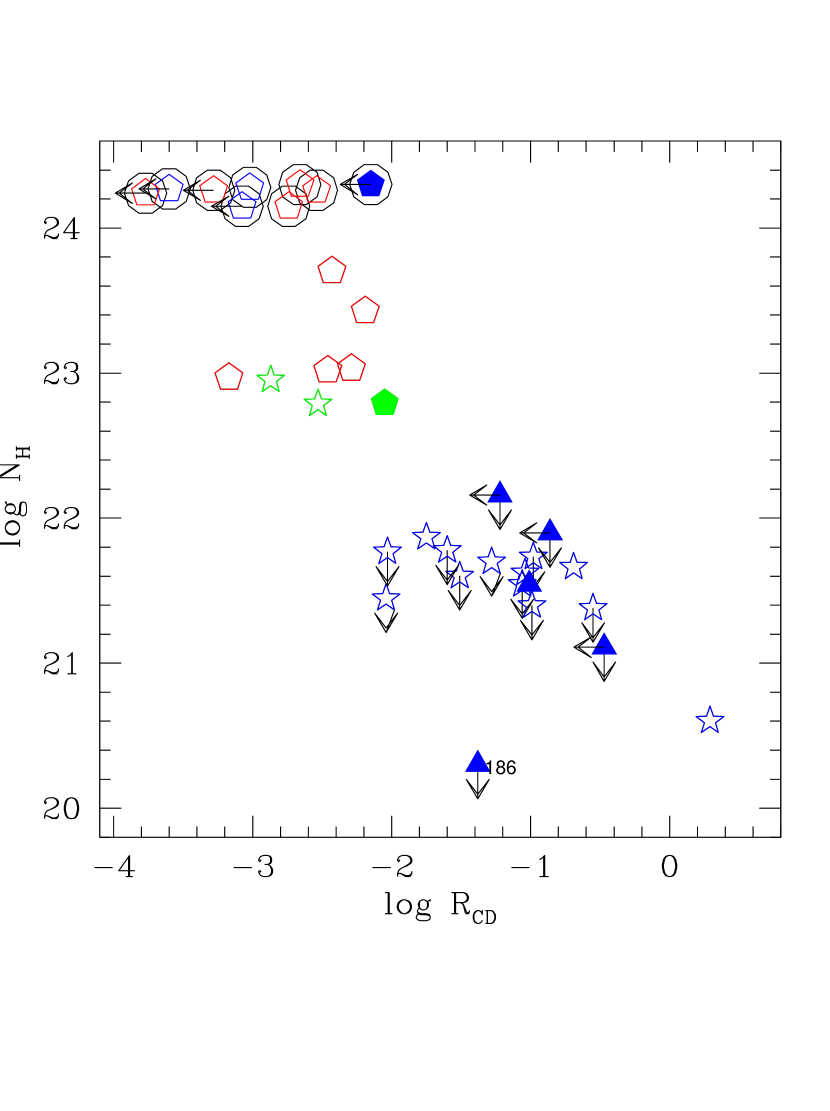
As noted earlier, at low frequencies all the 3CRR sources are lobe-dominated, but at higher frequencies emission from the core becomes significant. The relative strength of the core emission (core fraction, ) can be used as an orientation indicator. Unification models predict a correlation between obscuration and orientation. Figure 9(left) shows LX/LR as a function of with X-ray hardness ratio indicated by color. A strong correlation is present (Pnull=0.0001 Generalized Kendall’s test including upper limits on ), consistent with Unification models (see also Donley et al. (2005) for lower-redshift, radio-loud AGN). The orientation dependence of the beamed, core emission is likely to also contribute to this relation. The significant relation between (int) and (Pnull=0.0001, Kendalls’ test) shown in Figure 9(right)) also strongly supports Unification models.
5 Discussion
5.1 Compton Thick (CT) Candidates
Four of the Chandra observed NLRGs, 3C 13/324/368, and 4C 13.66, have soft X-ray hardness ratios consistent with a clear line-of-sight to a face-on quasar while their X-ray luminosities are low, comparable to the other NLRGs. The count rates are sufficiently low that spectral fits provide no useful constraint on intrinsic column density for these sources (Table 2). There are two possible interpretations. First, they could be LERGs which have little/no X-ray absorption and lack an actively accreting AGN (Section 1.2), but since the current sample is high luminosity this is unlikely. Second, the direct AGN light in the soft NLRGs may be sufficiently absorbed (Compton thick, CT) that the observed X-rays are dominated by other, relatively weak components, as observed in red quasars (Kuraszkiewicz et al., 2009a) and consistent with the models in Figure 4.
The circumnuclear regions of AGN are rarely resolved, particularly at high redshift, and so the extracted X-ray counts will include contributions such as nuclear light scattered into our line-of-sight via dust/electrons above/below the AD/torus, extended X-ray emission due to photo- or collisional-ionization in material surrounding the nucleus, and/or non-thermal emission from extended radio structure. NGC 1068 is the archetypal CT source for which the X-ray emission was measured to be weak and soft in low spatial resolution data (Monier & Halpern, 1987). Detailed Chandra and XMM-Newton data have since revealed extended soft X-ray emission and a complex X-ray spectrum including multiple reflected components (Matt et al., 2000; Pounds & Vaughan, 2006; Ogle et al., 2003). Although there are too few source counts in the soft NLRGs to study source extent, counts were extracted from a smaller (1′′ radius) circle to test this possibility. For 3C 324/368, the Chandra data show extended X-ray emission over a larger region and the resulting nuclear spectrum is harder (Table 2 footnote 12, Figure 5), consistent with contamination by softer extended emission. The lack of similar spectral hardening for 3C 13 and 4C 13.66 does not rule out the presence of unresolved extended soft emission.
The luminosity of the OIII] emission line (hereafter LOIII]) tracks the radio and X-ray luminosities for broad and narrow-lined AGN (Jackson & Rawlings, 1997; Mulchaey et al., 1994), and at high luminosities there is little/no inclination dependence (see discussion in Section 1.2). Given the strong dependence of the observed X-ray flux on obscuration, LOIII] is often used as an indicator of the intrinsic X-ray luminosity, and the ratio of the two quantities indicates whether/not a source is CT (Risaliti et al., 1999; Panessa et al., 2006). Figure 10 shows the ratio LOIII]/LX666LOIII] measurements are from Grimes et al. (2004). For 3C 43/204/325/437/469.1 LOIII] was determined from LOII] using the relation reported in that paper. as a function of for the 3CRR sample in comparison with the CT criterion of Juneau et al. (2011). Any weakening of the observed LOIII] due to obscuration of the inner NLR would imply a larger intrinsic LOIII]/LX. All four of the Chandra-observed X-ray soft NLRGs have high LOIII]/LX ratios, consistent with CT X-ray emission. Five additional NLRGs 3C 68.2/266/294/356/437 are also CT by this criterion. They have HRs (Table 2) but their LX values are comparable with the soft NLRGs and, in comparison with the models (Figure 4), indicate (int) cm-2 (Table 3).
Another parameter suggested to be a CT indicator is (Georgantopoulos et al., 2011). There are 3 sources with 1: 3C 324/368/469.1 (Figure 6, Section 4.3), adding 3C 469.1 as a CT candidate. However not all properties of this source align with a CT interpretation. 3C 469.1 has a relatively high LX, a hard X-ray spectrum (Figure 5), (int) cm-23 (Table 2), and low LOIII]/LX (Figure 10). Although we cannot rule out that this source is intrinsically different, it seems most likely that the nuclear absorption is not CT and that the unusually high is dominated by the host galaxy. Three other CT candidates 3C 13/256/266 have significant while the remainder do not have the IRS data required to measure this feature.
The NLRG 3C 239, observed by XMM-Newton, has a soft X-ray spectrum and possible Fe K emission leading Salvati et al. (2008) to suggest it is a CT source. The Spitzer L5μm/L8μm flux ratio aligns with the other soft NLRGs (Figure 7). However the radio core fraction indicates an intermediate orientation (Figure 9), LX is significantly higher than the other soft NLRGs (Figure 5), and the low LOIII]/LX ratio places it well inside the Compton-thin region (Figure 10). Optical imaging shows a complex structure suggestive of a merger remnant (Best et al., 1997). Given the conflicting properties and the relatively low S/N of the XMM-Newton data,777such that the Fe K emission line is within 2 of the normal strength for a type 1 AGN, (Risaliti private communication) this source is not included in the list of CT candidates. The unusual combination of soft X-ray spectrum and intermediate X-ray luminosity (Figure 5) suggest an intermediate level of absorption combined with significant soft excess emission. Deeper X-ray data are required to confirm/refute this suggestion.
The Chandra spectrum of the NLRG 3C 294 was studied at higher S/N by Fabian et al. (2003b), who report that it is dominated by a disk reflection component and deduce = cm-1, within 2 of being CT, and an intrinsic LX erg cm-2 s-1. We thus consider the evidence that this source is CT to be marginal, and it is not included in our final CT list.
We conclude that there are 8 CT candidates amongst the 16 NLRGs (not including the intermediate source 3C 241 as an NLRG, Section 5.2) in this sample. We used the CIAO/Sherpa extension package Datastack to perform simultaneous X-ray spectral fits to the 8 datasets to explore their spectral form since individual fits provided no constraints on the spectral parameters (Section 3). Datastack allows the source redshifts and calibration files of the individual observations to be used appropriately during simultaneous fitting of a group of sources. The results confirm that no significant (int) is detected and that a power-law provides a good fit (). However, since the total number of counts for all 8 sources is 150, the fit does not provide strong constraints on the presence of a reflection component.
The 8 CT sources represent % of the 3CRR sources in this redshift range. Of these sources, 5 are well-documented aligned radio galaxies with extended optical/IR emission distributed along the radio axis: 3C 13 (Best et al., 1997), 3C 266 (Zirm et al., 2003), 3C 324 and 3C 368 (Best et al., 1998), and 4C 13.66 (Rawlings et al., 1996), although this last is very small (1.4′′) on the sky and the optical extension is not well-defined. The predominantly edge-on nature of these candidates for CT nuclear absorption suggests that the host galaxy may contribute significantly to the absorption (Goulding et al., 2012; Deo et al., 2009; Kuraszkiewicz et al., 2009b).
5.2 Intermediate Quasars and NLRGs
Two of the quasars (3C 68.1/325) are unusually hard in the X-ray compared with the remainder of the 3CRR quasars (Figure 4). Their X-ray properties, along with those of NLRG 3C 241, are intermediate between those of NLRGs and quasars (Section 4.2).
3C 68.1 has hard X-ray emission, while the silicate absorption at 9.7m is weak and in the quasar range (Leipski et al., 2010). The SED (Figure 8) shows a red optical/near-IR continuum and little/no blue bump. The optical spectrum includes broad and narrow emission lines and strong, narrow absorption close to the emission line redshift (v km s-1, Brotherton et al. (1998)). The optical continuum and broad lines are highly polarized, ranging from % progressing from red to blue along the spectrum. The combination of high polarization, no strong variability, broad lines, weak (undetected in the ROSAT All-Sky Survey) X-rays and strong UV absorption was interpreted by Brotherton et al. (1998) as due to an inclined system where the scattered, polarized emission is diluted by dust-reddened direct light towards the red end of the optical spectrum. The Chandra detection shows relatively weak X-ray emission obscured by an intermediate absorbing column density ((int) cm-22, Table 2), confirming this picture.
3C 325, originally classified as a NLRG, was re-classified as a quasar based on the presence of weak broad components to the optical emission lines (Grimes et al., 2005). That paper also updated the redshift to 1.135 (earlier reported to be 0.86). The Spitzer IR data confirm the re-classification, showing the strong, smooth, power-law-like continuum and silicate emission that are characteristic of the 3CRR quasars (Leipski et al., 2010). The SED (Figure 8) shows a red optical/near-IR continuum and little/no blue bump. The Chandra data show relatively weak X-ray emission and intermediate absorption column density ((int) cm-2, Table 2).
3C 241 is classified as an NLRG/CSS, but a broad H line has been observed in this source (Hirst et al., 2003) implying that it is also intermediate between quasars and NLRGs. The SED (Figure 8) shows a red optical/near-IR continuum and no blue bump. There are no Spitzer IRS data for this source. The Chandra data again show relatively weak X-ray emission and intermediate absorption column density ((int) cm-2, Table 2).
The multi-wavelength properties of all 3 sources are very similar to those of red AGN and suggest type 1 quasars with an intermediate level of obscuration so that the X-ray flux remains relatively strong (Wilkes et al., 2002, 2005). The AGN IR bump outshines the host galaxy emission but the optical/UV emission is largely obscured (Kuraszkiewicz et al., 2009a).
Numerous hybrid sources whose classification as type 1 or 2 AGN depends on the observed waveband have been reported over the years. Galaxies bright in the IR and dominated by a starburst may contain an AGN. AGN with narrow lines in the optical reveal broad lines in IR observations or in polarized optical light. Specific AGN classes include XBONGs (X-ray bright, optically normal galaxies, Georgantopoulos & Georgakakis (2005)) or optically dull AGN (Elvis et al., 1981), red quasars (e.g. 2MASS sample, Cutri et al. (2002)), type 2 quasars (Zakamska et al., 2008; Ptak et al., 2006). Explanations include an evolutionary stage in which a quasar is emerging from an early, enshrouded state (Hopkins et al., 2006; Sanders et al., 1988), an intermediate orientation of the AGN in which the quasar is viewed through a lower column density of material and/or an edge-on host galaxy(Kuraszkiewicz et al., 2009a, b; Wilkes et al., 2002; Elvis, 2000), dilution by a bright and/or edge-on host galaxy, or an intrinsically weak AGN (Trump et al., 2009; Hopkins et al., 2009). Since this is a luminous, radio-selected sample, the last two possibilities, which imply a weak AGN, seem unlikely. While an evolutionary stage with a weak AGN cannot be ruled out, we will see below (Figure 9) that the core fraction of these three sources supports an intermediate viewing angle with a lower column density of obscuring material. This would be identified with a corona/wind above or below the AD/torus as posited in current models (Elvis, 2000; Konigl & Kartje, 1994) or a relatively clear line-of-sight in a clumpy torus model (Nenkova et al., 2008).
5.3 Compact Steep Spectrum (CSS) Sources
The 3CRR sample includes 8 CSS sources: 6 are classified as quasars, 1 as a NLRG (CT candidate 4C 13.66), and 1 as an intermediate source (3C 241). The radio source size is smaller than a typical galaxy, and models generally involve a young radio source in a later stage than the GHz peaked sources (GPS), which tend to be smaller with radio structure comparable in size to the NLR (O’Dea, 1998). The lack of X-ray absorption in Chandra observations of both GPS and CSS sources (Siemiginowska et al., 2008) ruled out earlier models in which the radio source was confined by interaction with a surrounding medium. Their X-ray properties are consistent with unification: the quasars are not heavily obscured while the NLRGs are. The small radio size then indicates that they are young rather than confined by an external medium whose presence would be clear from additional X-ray absorption (Siemiginowska et al., 2008). However, comparison of the X-ray properties of a well-defined sample of GPS sources with a heterogeneus sample of radio galaxies and quasars suggests that GPS sources are X-ray weak (by a factor ) and somewhat obscured (Tengstrand et al., 2009).
Our sample provides a well-matched set of CSS and other radio sources. Their X-ray properties generally align with those of the rest of the sample. The quasars show no absorption, the NLRG 4C 13.66 is a CT candidate and the intermediate source 3C 241 is similar to the other two in that category (Figure 4). Figure 5 shows that the CSS quasars are at the low end of the LX/LR range for quasars. The mean ratio for CSS quasars is a factor of 2.5 lower than that for the rest of the quasars due to a combination of higher L and lower LX. The fitted X-ray slopes for the two sources with sufficient counts (Table 2) are relatively soft: (3C 287), (3C 186, see also Siemiginowska et al. (2008)) compared with the other quasars (mean ). Thus the X-ray properties of this uniform set of CSS quasars support earlier conclusions that the radio sources are young rather than confined. The CSS quasars have LX/LR values a factor of lower than the well-matched quasars in this sample, a smaller shift than that reported by Tengstrand et al. (2009). The combination of lower LX/LR and softer X-ray slopes could result from weaker jet-related X-ray emission, but a larger well-matched sample is needed to confirm a systematic discrepancy.
3C 190 is a CSS quasar with conflicting properties. The X-ray properties align with the other CSS quasars, but the IR data indicate silicate absorption (, Leipski et al. (2010)) rather than the typical emission. This measurement was made with respect to the silicate emission from an average quasar so that an alternative interpretation is of weak/absent silicate emission. It has been suggested (Leipski et al. (2010) and Ogle et al., in preparation) that CSS quasars may have unusual silicate features, although the other CSS quasars in the current sample have silicate emission similar to normal quasars, not supporting this idea. Other possibilities include significant host galaxy absorption or a complex X-ray spectrum so that the deduced low (int) is incorrect.
5.4 The Distribution of Intrinsic X-ray Absorption Column Densities
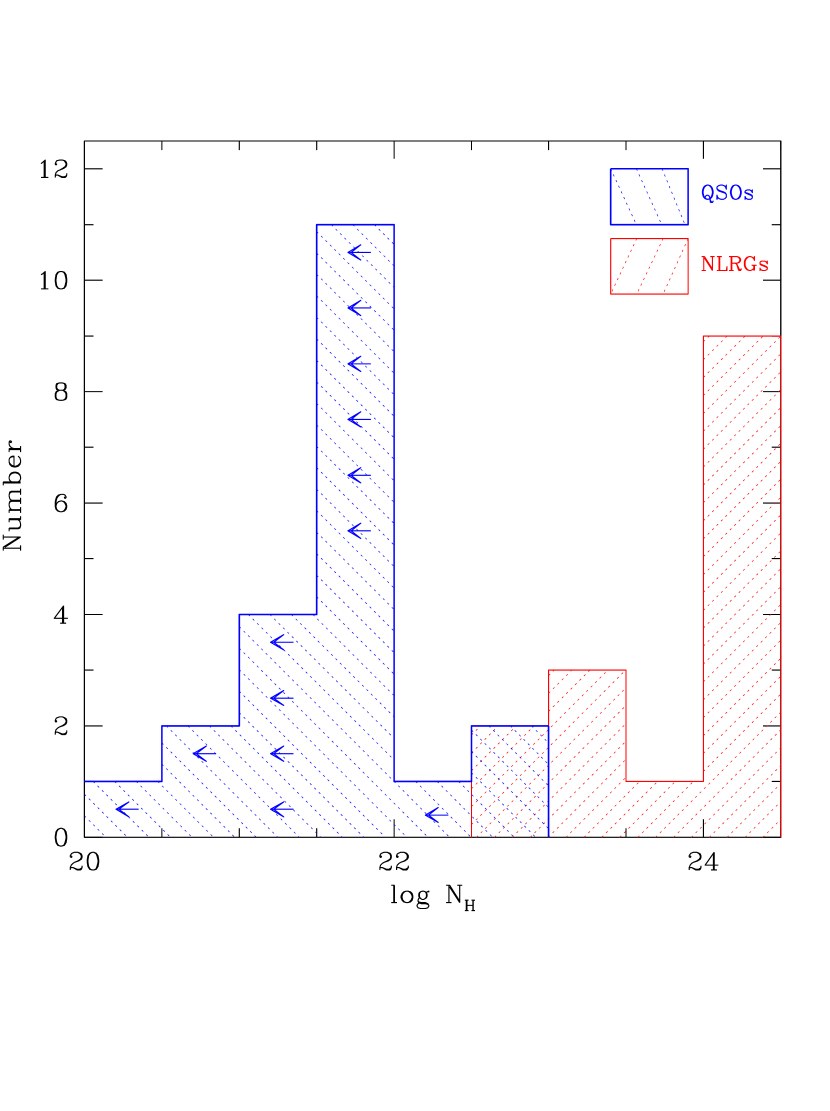
The best estimates of the intrinsic absorption column densities, (int) for the 3CRR sources (Tables 2, 3) were determined with reference to both X-ray and multi-wavelength properties of each source (Section 4.2). The resulting (int) distribution is bi-modal (Figure 11) with (int) for the NLRGs peaking at cm-2. A similar distribution, with obscured sources peaking cm-2, was reported for lower-redshift 3CRR galaxies (z1, Evans et al. (2006); Hardcastle et al. (2009), their Figure 16). In that case, the (int) was based on spectral fits which include two power law components, one of which (accretion-related) is absorbed while the other (radio-jet-related) is not. The current Chandra data are not of sufficiently high S/N to allow the multi-component fitting used in the low-redshift sample. Despite the different analysis, the similarity of the two distributions reinforces the earlier conclusion that the (int) distribution for radio-selected AGN extends to higher values than that of type 2 sources found in the SDSS. Distributions derived for lower-luminosity, local Seyfert 2 galaxies are more similar (Risaliti et al., 1999). Once again this result emphasizes that low-frequency radio selection includes the full population, including the highly-obscured (edge-on) sources that selection in other wavebands preferentially misses.
Low S/N observed X-ray spectra do not accurately reflect the true level of obscuration for highly-obscured sources. Even in the high-luminosity 3CRR sample, some objects display weak and soft X-ray emission because the primary X-ray power law is sufficiently obscured that weaker X-ray components dominate. Using HRs or simple power law fits to estimate the absorption column densities may yield values too low and lead to intrinsic X-ray luminosities below the true values. Underestimated absorption would result in an apparent lack of heavily obscured sources in X-ray-selected AGN samples because such sources either appear to be unabsorbed, adding to the unobscured rather than the obscured source counts, or they fall below the flux limit and are missing from the sample altogether.
From the distribution of (int) we conclude that the obscured fraction in the high-z 3CRR sample is 0.50.1, and the CT fraction is 0.210.07, both consistent with CXRB model predictions in this range of LX (Gilli et al., 2007). This obscured fraction is higher than is typically reported for sources in the same luminosity range (, see Section 1.2), a discrepancy which can be explained if the % CT sources are generally either undetected or accounted as unobscured. Similar CT fractions (0.18) have been reported for z, lower LX (log LX ) X-ray-selected sources in the CDFS (Fiore et al., 2012) and in low-redshift (z) hard X-ray surveys (Burlon et al., 2011). In summary, the ratio of unobscured to Compton-thin ( (int) cm-2) to CT ((int) cm-2) is 2.5:1.4:1 for the high-z 3CRRs.
5.5 Geometry of the Nuclear Region
The strong relations between the X-ray-to-radio luminosity ratio (LX/LR) and the intrinsic absorption column density ((int)) and the AGN orientation as indicated by (Figure 9) confirm that orientation-dependent obscuration dominates the nuclear X-ray and core radio properties of high-redshift RLAGN, supporting the Unification model. Anomalously high in a few sources indicates that the host galaxy makes significant contributions to the SEDs when the spatial resolution is insufficient to isolate the nuclear emission.
Estimates of the number of sources as a function of the amount of obscuration provide constraints on the covering factor of the material in the nuclear regions immediately surrounding the central SMBH. Half of the sample (19 of 38) are type 1 sources (obscured fraction of 0.5) with little/no X-ray absorption, strong, broad emission lines, and blue visible colors. This is consistent with previous estimates for samples of radio galaxies once the LERGs are removed (Barthel, 1989; Ogle et al., 2006). Assuming randomly-oriented 3CRR sources and a geometry in which the obscuring material lies preferentially in a plane perpendicular to the radio jet, the probability of a source lying in a cone of angle is given by P() = 1cos (Barthel, 1989) leading to an estimated half-opening angle for the obscuring material of 60o.
The 3CRR sample includes 8 Compton-thick candidate NLRGs with one/more of the following properties: low X-ray luminosity (LX/LR, sometimes accompanied by soft X-ray spectra), high OIII]5007 to X-ray luminosity ratio, low , high . In a Unification scenario, these are the highest inclination sources, viewed through the optically-thick material of the AD/torus so that only weaker emission, reflected/scattered from cold and/or warm (ionized) material outside the nucleus, is visible in the X-rays i.e. similar to the archetypal edge-on AGN NGC 1068. The CT candidates represent % (8 of 16) of the NLRGs in this sample. Six of these sources are also in edge-on or merging host galaxies suggesting that host galaxy obscuration also plays a role. With % of the total sample in this category, we estimate that the CT torus/AD covers o above and below the equatorial plane of the system.
The remaining 8 NLRGs and the 3 intermediate sources888The optical and IR spectral data for many of the NLRGs, which are very faint optical sources, are of low S/N making weak broad lines difficult to detect so that the NLRG vs intermediate classification is non uniform. (Section 5.2), have Compton-thin (int) and intermediate LX/LR and . This group constitutes % of the sample, indicating obscuration above and below the CT disk covering a further o. The presence of 3 intermediate class sources suggests that the material decreases in density away from the plane of the disk, perhaps including an atmosphere/wind (Konigl & Kartje, 1994; Murray & Chiang, 1995).
6 Conclusions
-
1.
Chandra X-ray observations of a complete sample of 38 high-redshift (1z2) 3CRR radio sources (log L, log LX) combined with multi-wavelength data have demonstrated that source orientation can explain the full range of X-ray properties, consistent with the orientation-dependent obscuration of the Unification model for radio-loud quasars and radio galaxies (NLRGs).
-
2.
The obscured fraction for this sample of high-redshift 3CRR sources is 0.50.1, consistent with that expected at log LX in CXRB models (Gilli et al., 2007), but higher than that generally reported at these luminosities (). The difference is most likely due to the lack of bias against obscured sources in the low-frequency-radio-selected 3CRR sample.
-
3.
The multi-wavelength properties of many of the 3CRR NLRGs reveal significantly () higher levels of intrinsic absorption ((int)) than indicated by the X-ray hardness ratios. In such cases the use of X-ray hardness ratio to correct for (int) results in LX values too low.
-
4.
We conclude that 8 of the NLRGs (5018%) are Compton thick (3C 13/68.2/266/324/356/368/437 and 4C 13.66). The high fraction of CT sources (21%) compared with visible and X-ray-selected samples is a result of the lack of bias against heavily-obscured sources via radio-selection. The ratio of unobscured to Compton-thin ( (int) cm-2) to CT ((int) cm-2) is 2.5:1.4:1.
-
5.
Assuming a random distribution of orientation and a simple geometry in which the obscuring material is concentrated perpendicular to the radio axis, we deduce that obscuration in the nuclear regions of high-z, radio-loud AGN includes: a CT obscuring disk/torus extending o from the midplane, additional obscuring material extending for another o with the density decreasing away from the mid-plane, and the remaining o is largely unobscured. This last is consistent with previous estimates of torus/disk opening angles for high-luminosity AGN.
-
6.
LX/LR and LOIII]/LX, in comparison with typical values for broad-line AGN, provide a better measure of intrinsic absorption than the X-ray hardness ratio (HR).
-
7.
The distribution of (int) for the high-redshift 3CRR sample peaks at (int) cm-2, similar to the results for lower-redshift 3CRR sources.
-
8.
Given the edge-on nature of the host galaxies of at least 5 of the CT NLRGs (3C 13/266/324/368 and 4C 13.66), it is likely that host galaxy absorption contributes significantly to dust absorption signatures such as .
-
9.
The Compact Steep Spectrum (CSS) RLAGN (3C 43/186/190/241/287/318/454.0 and 4C 13.66) have a factor of lower LX/LR and softer X-ray spectra ( cf. 1.7) than the non-CSS RLAGN in this complete sample.
Acknowledgements
Support for this work was provided by the National Aeronautics and Space Administration through Chandra Award Number G08-9106X, by the Chandra X-ray Center, which is operated by the Smithsonian Astrophysical Observatory for and on behalf of the National Aeronautics Space Administration under contract NAS8-03060 (Chandra X-ray Center) and by the Smithsonian Institution Endowment, Scholarly Studies Program, fund # 40488100HH0017. The scientific results in this article are based to a significant degree on observations made by the Chandra X-ray Observatory (CXO). We would like to thank Mark Avara and Margaret Yellen for their early work on this project.
References
- Akujor & Garrington (1995) Akujor, C. E. & Garrington, S. T. 1995, A&AS, 112, 235
- Akujor et al. (1994) Akujor, C. E., Luedke, E., Browne, I. W. A., Leahy, J. P., Garrington, S. T., Jackson, N., & Thomasson, P. 1994, A&AS, 105, 247
- Akujor et al. (1991) Akujor, C. E., Spencer, R. E., Zhang, F. J., Davis, R. J., Browne, I. W. A., & Fanti, C. 1991, MNRAS, 250, 215
- Aldcroft et al. (2003) Aldcroft, T. L., Siemiginowska, A., Elvis, M., Mathur, S., Nicastro, F., & Murray, S. S. 2003, ApJ, 597, 751
- Antonucci (1984) Antonucci, R. R. J. 1984, ApJ, 278, 499
- Antonucci & Miller (1985) Antonucci, R. R. J. & Miller, J. S. 1985, ApJ, 297, 621
- Barmby et al. (2006) Barmby, P., Alonso-Herrero, A., Donley, J. L., Egami, E., Fazio, G. G., Georgakakis, A., Huang, J.-S., Laird, E. S., Miyazaki, S., Nandra, K., Park, S. Q., Pérez-González, P. G., Rieke, G. H., Rigby, J. R., & Willner, S. P. 2006, ApJ, 642, 126
- Barthel et al. (2012) Barthel, P., Haas, M., Leipski, C., & Wilkes, B. 2012, ApJ, 757, L26
- Barthel (1989) Barthel, P. D. 1989, ApJ, 336, 606
- Barthel et al. (1984) Barthel, P. D., Miley, G. K., Schilizzi, R. T., & Preuss, E. 1984, A&A, 140, 399
- Bassani et al. (2006) Bassani, L., Molina, M., Malizia, A., Stephen, J. B., Bird, A. J., Bazzano, A., Bélanger, G., Dean, A. J., De Rosa, A., Laurent, P., Lebrun, F., Ubertini, P., & Walter, R. 2006, ApJ, 636, L65
- Belsole et al. (2006) Belsole, E., Worrall, D. M., & Hardcastle, M. J. 2006, MNRAS, 366, 339
- Belsole et al. (2004) Belsole, E., Worrall, D. M., Hardcastle, M. J., Birkinshaw, M., & Lawrence, C. R. 2004, MNRAS, 352, 924
- Best et al. (1998) Best, P. N., Carilli, C. L., Garrington, S. T., Longair, M. S., & Rottgering, H. J. A. 1998, MNRAS, 299, 357
- Best et al. (1997) Best, P. N., Longair, M. S., & Roettgering, J. H. A. 1997, MNRAS, 292, 758
- Best et al. (2000) Best, P. N., Röttgering, H. J. A., & Longair, M. S. 2000, MNRAS, 311, 23
- Bridle et al. (1994) Bridle, A. H., Hough, D. H., Lonsdale, C. J., Burns, J. O., & Laing, R. A. 1994, AJ, 108, 766
- Brotherton et al. (1998) Brotherton, M. S., Wills, B. J., Dey, A., van Breugel, W., & Antonucci, R. 1998, ApJ, 501, 110
- Burlon et al. (2011) Burlon, D., Ajello, M., Greiner, J., Comastri, A., Merloni, A., & Gehrels, N. 2011, ApJ, 728, 58
- Cappi et al. (2006) Cappi, M., Panessa, F., Bassani, L., Dadina, M., Di Cocco, G., Comastri, A., della Ceca, R., Filippenko, A. V., Gianotti, F., Ho, L. C., Malaguti, G., Mulchaey, J. S., Palumbo, G. G. C., Piconcelli, E., Sargent, W. L. W., Stephen, J., Trifoglio, M., & Weaver, K. A. 2006, A&A, 446, 459
- Chiaberge et al. (2002) Chiaberge, M., Capetti, A., & Celotti, A. 2002, A&A, 394, 791
- Cleary et al. (2007) Cleary, K., Lawrence, C. R., Marshall, J. A., Hao, L., & Meier, D. 2007, ApJ, 660, 117
- Cutri et al. (2002) Cutri, R. M., Nelson, B. O., Francis, P. J., & Smith, P. S. 2002, in Astronomical Society of the Pacific Conference Series, Vol. 284, IAU Colloq. 184: AGN Surveys, ed. R. F. Green, E. Y. Khachikian, & D. B. Sanders, 127
- Daddi et al. (2007) Daddi, E., Dickinson, M., Morrison, G., Chary, R., Cimatti, A., Elbaz, D., Frayer, D., Renzini, A., Pope, A., Alexander, D. M., Bauer, F. E., Giavalisco, M., Huynh, M., Kurk, J., & Mignoli, M. 2007, ApJ, 670, 156
- Davis et al. (2007) Davis, M., Guhathakurta, P., Konidaris, N. P., Newman, J. A., Ashby, M. L. N., Biggs, A. D., Barmby, P., Bundy, K., Chapman, S. C., Coil, A. L., Conselice, C. J., Cooper, M. C., Croton, D. J., Eisenhardt, P. R. M., Ellis, R. S., Faber, S. M., Fang, T., Fazio, G. G., Georgakakis, A., Gerke, B. F., Goss, W. M., Gwyn, S., Harker, J., Hopkins, A. M., Huang, J.-S., Ivison, R. J., Kassin, S. A., Kirby, E. N., Koekemoer, A. M., Koo, D. C., Laird, E. S., Le Floc’h, E., Lin, L., Lotz, J. M., Marshall, P. J., Martin, D. C., Metevier, A. J., Moustakas, L. A., Nandra, K., Noeske, K. G., Papovich, C., Phillips, A. C., Rich, R. M., Rieke, G. H., Rigopoulou, D., Salim, S., Schiminovich, D., Simard, L., Smail, I., Small, T. A., Weiner, B. J., Willmer, C. N. A., Willner, S. P., Wilson, G., Wright, E. L., & Yan, R. 2007, ApJ, 660, L1
- Deo et al. (2009) Deo, R. P., Richards, G. T., Crenshaw, D. M., & Kraemer, S. B. 2009, ApJ, 705, 14
- Deo et al. (2011) Deo, R. P., Richards, G. T., Nikutta, R., Elitzur, M., Gallagher, S. C., Ivezić, Ž., & Hines, D. 2011, ApJ, 729, 108
- Dicken et al. (2009) Dicken, D., Tadhunter, C., Axon, D., Morganti, R., Inskip, K. J., Holt, J., González Delgado, R., & Groves, B. 2009, ApJ, 694, 268
- Dickey & Lockman (1990) Dickey, J. M. & Lockman, F. J. 1990, ARA&A, 28, 215
- Donley et al. (2012) Donley, J. L., Koekemoer, A. M., Brusa, M., Capak, P., Cardamone, C. N., Civano, F., Ilbert, O., Impey, C. D., Kartaltepe, J. S., Miyaji, T., Salvato, M., Sanders, D. B., Trump, J. R., & Zamorani, G. 2012, ApJ, 748, 142
- Donley et al. (2005) Donley, J. L., Rieke, G. H., Rigby, J. R., & Pérez-González, P. G. 2005, ApJ, 634, 169
- Dwelly & Page (2006) Dwelly, T. & Page, M. J. 2006, MNRAS, 372, 1755
- Eisenhardt et al. (2004) Eisenhardt, P. R., Stern, D., Brodwin, M., Fazio, G. G., Rieke, G. H., Rieke, M. J., Werner, M. W., Wright, E. L., Allen, L. E., Arendt, R. G., Ashby, M. L. N., Barmby, P., Forrest, W. J., Hora, J. L., Huang, J.-S., Huchra, J., Pahre, M. A., Pipher, J. L., Reach, W. T., Smith, H. A., Stauffer, J. R., Wang, Z., Willner, S. P., Brown, M. J. I., Dey, A., Jannuzi, B. T., & Tiede, G. P. 2004, ApJS, 154, 48
- Elvis (2000) Elvis, M. 2000, ApJ, 545, 63
- Elvis et al. (1981) Elvis, M., Schreier, E. J., Tonry, J., Davis, M., & Huchra, J. P. 1981, ApJ, 246, 20
- Erlund et al. (2006) Erlund, M. C., Fabian, A. C., Blundell, K. M., Celotti, A., & Crawford, C. S. 2006, MNRAS, 371, 29
- Evans et al. (2006) Evans, D. A., Worrall, D. M., Hardcastle, M. J., Kraft, R. P., & Birkinshaw, M. 2006, ApJ, 642, 96
- Fabbiano et al. (1984) Fabbiano, G., Trinchieri, G., Elvis, M., Miller, L., & Longair, M. 1984, ApJ, 277, 115
- Fabian et al. (2003a) Fabian, A. C., Celotti, A., & Johnstone, R. M. 2003a, MNRAS, 338, L7
- Fabian et al. (2001) Fabian, A. C., Crawford, C. S., Ettori, S., & Sanders, J. S. 2001, MNRAS, 322, L11
- Fabian et al. (2003b) Fabian, A. C., Sanders, J. S., Crawford, C. S., & Ettori, S. 2003b, MNRAS, 341, 729
- Falcke et al. (1995) Falcke, H., Gopal-Krishna, & Biermann, P. L. 1995, A&A, 298, 395
- Fanaroff & Riley (1974) Fanaroff, B. L. & Riley, J. M. 1974, MNRAS, 167, 31P
- Fanti et al. (1985) Fanti, C., Fanti, R., Parma, P., Schilizzi, R. T., & van Breugel, W. J. M. 1985, A&A, 143, 292
- Fanti et al. (1989) Fanti, C., Fanti, R., Parma, P., Venturi, T., Schilizzi, R. T., Nan Rendong, Spencer, R. E., Muxlow, T. W. B., & van Breugel, W. 1989, A&A, 217, 44
- Fernini et al. (1993) Fernini, I., Burns, J. O., Bridle, A. H., & Perley, R. A. 1993, AJ, 105, 1690
- Fernini et al. (1997) Fernini, I., Burns, J. O., & Perley, R. A. 1997, AJ, 114, 2292
- Fiore et al. (2009) Fiore, F., Puccetti, S., Brusa, M., Salvato, M., Zamorani, G., Aldcroft, T., Aussel, H., Brunner, H., Capak, P., Cappelluti, N., Civano, F., Comastri, A., Elvis, M., Feruglio, C., Finoguenov, A., Fruscione, A., Gilli, R., Hasinger, G., Koekemoer, A., Kartaltepe, J., Ilbert, O., Impey, C., Le Floc’h, E., Lilly, S., Mainieri, V., Martinez-Sansigre, A., McCracken, H. J., Menci, N., Merloni, A., Miyaji, T., Sanders, D. B., Sargent, M., Schinnerer, E., Scoville, N., Silverman, J., Smolcic, V., Steffen, A., Santini, P., Taniguchi, Y., Thompson, D., Trump, J. R., Vignali, C., Urry, M., & Yan, L. 2009, ApJ, 693, 447
- Fiore et al. (2012) Fiore, F., Puccetti, S., Grazian, A., Menci, N., Shankar, F., Santini, P., Piconcelli, E., Koekemoer, A. M., Fontana, A., Boutsia, K., Castellano, M., Lamastra, A., Malacaria, C., Feruglio, C., Mathur, S., Miller, N., & Pannella, M. 2012, A&A, 537, A16
- Foley & Barthel (1990) Foley, A. R. & Barthel, P. D. 1990, A&A, 228, 17
- Gambill et al. (2003) Gambill, J. K., Sambruna, R. M., Chartas, G., Cheung, C. C., Maraschi, L., Tavecchio, F., Urry, C. M., & Pesce, J. E. 2003, A&A, 401, 505
- Gaskell et al. (2004) Gaskell, C. M., Goosmann, R. W., Antonucci, R. R. J., & Whysong, D. H. 2004, ApJ, 616, 147
- Georgantopoulos et al. (2011) Georgantopoulos, I., Dasyra, K. M., Rovilos, E., Pope, A., Wu, Y., Dickinson, M., Comastri, A., Gilli, R., Elbaz, D., Armus, L., & Akylas, A. 2011, A&A, 531, A116
- Georgantopoulos & Georgakakis (2005) Georgantopoulos, I. & Georgakakis, A. 2005, MNRAS, 358, 131
- Ghisellini & Celotti (2001) Ghisellini, G. & Celotti, A. 2001, A&A, 379, L1
- Giavalisco et al. (2004) Giavalisco, M., Ferguson, H. C., Koekemoer, A. M., Dickinson, M., Alexander, D. M., Bauer, F. E., Bergeron, J., Biagetti, C., Brandt, W. N., Casertano, S., Cesarsky, C., Chatzichristou, E., Conselice, C., Cristiani, S., Da Costa, L., Dahlen, T., de Mello, D., Eisenhardt, P., Erben, T., Fall, S. M., Fassnacht, C., Fosbury, R., Fruchter, A., Gardner, J. P., Grogin, N., Hook, R. N., Hornschemeier, A. E., Idzi, R., Jogee, S., Kretchmer, C., Laidler, V., Lee, K. S., Livio, M., Lucas, R., Madau, P., Mobasher, B., Moustakas, L. A., Nonino, M., Padovani, P., Papovich, C., Park, Y., Ravindranath, S., Renzini, A., Richardson, M., Riess, A., Rosati, P., Schirmer, M., Schreier, E., Somerville, R. S., Spinrad, H., Stern, D., Stiavelli, M., Strolger, L., Urry, C. M., Vandame, B., Williams, R., & Wolf, C. 2004, ApJ, 600, L93
- Gilli et al. (2007) Gilli, R., Comastri, A., & Hasinger, G. 2007, A&A, 463, 79
- Gilli et al. (2010) Gilli, R., Comastri, A., Vignali, C., Ranalli, P., & Iwasawa, K. 2010, X-ray Astronomy 2009; Present Status, Multi-Wavelength Approach and Future Perspectives, 1248, 359
- Goulding et al. (2012) Goulding, A. D., Alexander, D. M., Bauer, F. E., Forman, W. R., Hickox, R. C., Jones, C., Mullaney, J. R., & Trichas, M. 2012, ApJ, 755, 5
- Grimes et al. (2004) Grimes, J. A., Rawlings, S., & Willott, C. J. 2004, MNRAS, 349, 503
- Grimes et al. (2005) —. 2005, MNRAS, 359, 1345
- Grogin et al. (2011) Grogin, N. A., Kocevski, D. D., Faber, S. M., Ferguson, H. C., Koekemoer, A. M., Riess, A. G., Acquaviva, V., Alexander, D. M., Almaini, O., Ashby, M. L. N., Barden, M., Bell, E. F., Bournaud, F., Brown, T. M., Caputi, K. I., Casertano, S., Cassata, P., Castellano, M., Challis, P., Chary, R.-R., Cheung, E., Cirasuolo, M., Conselice, C. J., Roshan Cooray, A., Croton, D. J., Daddi, E., Dahlen, T., Davé, R., de Mello, D. F., Dekel, A., Dickinson, M., Dolch, T., Donley, J. L., Dunlop, J. S., Dutton, A. A., Elbaz, D., Fazio, G. G., Filippenko, A. V., Finkelstein, S. L., Fontana, A., Gardner, J. P., Garnavich, P. M., Gawiser, E., Giavalisco, M., Grazian, A., Guo, Y., Hathi, N. P., Häussler, B., Hopkins, P. F., Huang, J.-S., Huang, K.-H., Jha, S. W., Kartaltepe, J. S., Kirshner, R. P., Koo, D. C., Lai, K., Lee, K.-S., Li, W., Lotz, J. M., Lucas, R. A., Madau, P., McCarthy, P. J., McGrath, E. J., McIntosh, D. H., McLure, R. J., Mobasher, B., Moustakas, L. A., Mozena, M., Nandra, K., Newman, J. A., Niemi, S.-M., Noeske, K. G., Papovich, C. J., Pentericci, L., Pope, A., Primack, J. R., Rajan, A., Ravindranath, S., Reddy, N. A., Renzini, A., Rix, H.-W., Robaina, A. R., Rodney, S. A., Rosario, D. J., Rosati, P., Salimbeni, S., Scarlata, C., Siana, B., Simard, L., Smidt, J., Somerville, R. S., Spinrad, H., Straughn, A. N., Strolger, L.-G., Telford, O., Teplitz, H. I., Trump, J. R., van der Wel, A., Villforth, C., Wechsler, R. H., Weiner, B. J., Wiklind, T., Wild, V., Wilson, G., Wuyts, S., Yan, H.-J., & Yun, M. S. 2011, ApJS, 197, 35
- Haas et al. (2004) Haas, M., Müller, S. A. H., Bertoldi, F., Chini, R., Egner, S., Freudling, W., Klaas, U., Krause, O., Lemke, D., Meisenheimer, K., Siebenmorgen, R., & van Bemmel, I. 2004, A&A, 424, 531
- Haas et al. (2005) Haas, M., Siebenmorgen, R., Schulz, B., Krügel, E., & Chini, R. 2005, A&A, 442, L39
- Haas et al. (2008) Haas, M., Willner, S. P., Heymann, F., Ashby, M. L. N., Fazio, G. G., Wilkes, B. J., Chini, R., & Siebenmorgen, R. 2008, ApJ, 688, 122
- Hardcastle et al. (2009) Hardcastle, M. J., Evans, D. A., & Croston, J. H. 2009, MNRAS, 396, 1929
- Hardcastle et al. (2004) Hardcastle, M. J., Harris, D. E., Worrall, D. M., & Birkinshaw, M. 2004, ApJ, 612, 729
- Hardcastle & Worrall (1999) Hardcastle, M. J. & Worrall, D. M. 1999, MNRAS, 309, 969
- Harris & Krawczynski (2006) Harris, D. E. & Krawczynski, H. 2006, ARA&A, 44, 463
- Hasinger (2008) Hasinger, G. 2008, A&A, 490, 905
- Hes et al. (1993) Hes, R., Barthel, P. D., & Fosbury, R. A. E. 1993, Nature, 362, 326
- Hickox et al. (2007) Hickox, R. C., Jones, C., Forman, W. R., Murray, S. S., Brodwin, M., Brown, M. J. I., Eisenhardt, P. R., Stern, D., Kochanek, C. S., Eisenstein, D., Cool, R. J., Jannuzi, B. T., Dey, A., Brand, K., Gorjian, V., & Caldwell, N. 2007, ApJ, 671, 1365
- Hine & Longair (1979) Hine, R. G. & Longair, M. S. 1979, MNRAS, 188, 111
- Hirst et al. (2003) Hirst, P., Jackson, N., & Rawlings, S. 2003, MNRAS, 346, 1009
- Hopkins et al. (2006) Hopkins, P. F., Hernquist, L., Cox, T. J., Di Matteo, T., Robertson, B., & Springel, V. 2006, ApJS, 163, 1
- Hopkins et al. (2009) Hopkins, P. F., Hickox, R., Quataert, E., & Hernquist, L. 2009, MNRAS, 398, 333
- Huchra & Burg (1992) Huchra, J. & Burg, R. 1992, ApJ, 393, 90
- Iwasawa et al. (2012) Iwasawa, K., Gilli, R., Vignali, C., Comastri, A., Brandt, W. N., Ranalli, P., Vito, F., Cappelluti, N., Carrera, F. J., Falocco, S., Georgantopoulos, I., Mainieri, V., & Paolillo, M. 2012, A&A, 546, A84
- Jackson & Browne (1990) Jackson, N. & Browne, I. W. A. 1990, Nature, 343, 43
- Jackson & Rawlings (1997) Jackson, N. & Rawlings, S. 1997, MNRAS, 286, 241
- Juneau et al. (2011) Juneau, S., Dickinson, M., Alexander, D. M., & Salim, S. 2011, ApJ, 736, 104
- Just et al. (2007) Just, D. W., Brandt, W. N., Shemmer, O., Steffen, A. T., Schneider, D. P., Chartas, G., & Garmire, G. P. 2007, ApJ, 665, 1004
- Kim et al. (2007) Kim, M., Kim, D.-W., Wilkes, B. J., Green, P. J., Kim, E., Anderson, C. S., Barkhouse, W. A., Evans, N. R., Ivezić, Ž., Karovska, M., Kashyap, V. L., Lee, M. G., Maksym, P., Mossman, A. E., Silverman, J. D., & Tananbaum, H. D. 2007, ApJS, 169, 401
- Konigl & Kartje (1994) Konigl, A. & Kartje, J. F. 1994, ApJ, 434, 446
- Krolik & Begelman (1988) Krolik, J. H. & Begelman, M. C. 1988, ApJ, 329, 702
- Kuraszkiewicz et al. (2009a) Kuraszkiewicz, J., Wilkes, B. J., Schmidt, G., Ghosh, H., Smith, P. S., Cutri, R., Hines, D., Huff, E. M., McDowell, J. C., & Nelson, B. 2009a, ApJ, 692, 1143
- Kuraszkiewicz et al. (2009b) Kuraszkiewicz, J., Wilkes, B. J., Schmidt, G., Smith, P. S., Cutri, R., & Czerny, B. 2009b, ApJ, 692, 1180
- La Franca et al. (2005) La Franca, F., Fiore, F., Comastri, A., Perola, G. C., Sacchi, N., Brusa, M., Cocchia, F., Feruglio, C., Matt, G., Vignali, C., Carangelo, N., Ciliegi, P., Lamastra, A., Maiolino, R., Mignoli, M., Molendi, S., & Puccetti, S. 2005, ApJ, 635, 864
- Laing et al. (1983) Laing, R. A., Riley, J. M., & Longair, M. S. 1983, MNRAS, 204, 151
- Larson et al. (2011) Larson, D., Dunkley, J., Hinshaw, G., Komatsu, E., Nolta, M. R., Bennett, C. L., Gold, B., Halpern, M., Hill, R. S., Jarosik, N., Kogut, A., Limon, M., Meyer, S. S., Odegard, N., Page, L., Smith, K. M., Spergel, D. N., Tucker, G. S., Weiland, J. L., Wollack, E., & Wright, E. L. 2011, ApJS, 192, 16
- Laskar et al. (2010) Laskar, T., Fabian, A. C., Blundell, K. M., & Erlund, M. C. 2010, MNRAS, 401, 1500
- Law-Green et al. (1995) Law-Green, J. D. B., Leahy, J. P., Alexander, P., Allington-Smith, J. R., van Breugel, W. J. M., Eales, S. A., Rawlings, S. G., & Spinrad, H. 1995, MNRAS, 274, 939
- Lawrence (1991) Lawrence, A. 1991, MNRAS, 252, 586
- Lawrence & Elvis (1982) Lawrence, A. & Elvis, M. 1982, ApJ, 256, 410
- Lawrence & Elvis (2010) —. 2010, ApJ, 714, 561
- Leipski et al. (2010) Leipski, C., Haas, M., Willner, S. P., Ashby, M. L. N., Wilkes, B. J., Fazio, G. G., Antonucci, R., Barthel, P., Chini, R., Siebenmorgen, R., Ogle, P., & Heymann, F. 2010, ApJ, 717, 766
- Liu et al. (1992) Liu, R., Pooley, G., & Riley, J. M. 1992, MNRAS, 257, 545
- Longair (1975) Longair, M. S. 1975, MNRAS, 173, 309
- Lonsdale & Barthel (1984) Lonsdale, C. J. & Barthel, P. D. 1984, A&A, 135, 45
- Lonsdale et al. (1993) Lonsdale, C. J., Barthel, P. D., & Miley, G. K. 1993, ApJS, 87, 63
- Lonsdale et al. (2003) Lonsdale, C. J., Smith, H. E., Rowan-Robinson, M., Surace, J., Shupe, D., Xu, C., Oliver, S., Padgett, D., Fang, F., Conrow, T., Franceschini, A., Gautier, N., Griffin, M., Hacking, P., Masci, F., Morrison, G., O’Linger, J., Owen, F., Pérez-Fournon, I., Pierre, M., Puetter, R., Stacey, G., Castro, S., Polletta, M. d. C., Farrah, D., Jarrett, T., Frayer, D., Siana, B., Babbedge, T., Dye, S., Fox, M., Gonzalez-Solares, E., Salaman, M., Berta, S., Condon, J. J., Dole, H., & Serjeant, S. 2003, PASP, 115, 897
- Ludke et al. (1998) Ludke, E., Garrington, S. T., Spencer, R. E., Akujor, C. E., Muxlow, T. W. B., Sanghera, H. S., & Fanti, C. 1998, MNRAS, 299, 467
- Maiolino et al. (2001) Maiolino, R., Marconi, A., Salvati, M., Risaliti, G., Severgnini, P., Oliva, E., La Franca, F., & Vanzi, L. 2001, A&A, 365, 28
- Maiolino & Rieke (1995) Maiolino, R. & Rieke, G. H. 1995, ApJ, 454, 95
- Mantovani et al. (1992) Mantovani, F., Junor, W., Fanti, R., Padrielli, L., Browne, I. W. A., & Muxlow, T. W. B. 1992, MNRAS, 257, 353
- Martínez-Sansigre et al. (2005) Martínez-Sansigre, A., Rawlings, S., Lacy, M., Fadda, D., Marleau, F. R., Simpson, C., Willott, C. J., & Jarvis, M. J. 2005, Nature, 436, 666
- Matt et al. (2000) Matt, G., Fabian, A. C., Guainazzi, M., Iwasawa, K., Bassani, L., & Malaguti, G. 2000, MNRAS, 318, 173
- Matt et al. (1997) Matt, G., Guainazzi, M., Frontera, F., Bassani, L., Brandt, W. N., Fabian, A. C., Fiore, F., Haardt, F., Iwasawa, K., Maiolino, R., Malaguti, G., Marconi, A., Matteuzzi, A., Molendi, S., Perola, G. C., Piraino, S., & Piro, L. 1997, A&A, 325, L13
- Monier & Halpern (1987) Monier, R. & Halpern, J. P. 1987, ApJ, 315, L17
- Mulchaey et al. (1994) Mulchaey, J. S., Koratkar, A., Ward, M. J., Wilson, A. S., Whittle, M., Antonucci, R. R. J., Kinney, A. L., & Hurt, T. 1994, ApJ, 436, 586
- Murray & Chiang (1995) Murray, N. & Chiang, J. 1995, ApJ, 454, L105
- Mushotzky et al. (1993) Mushotzky, R. F., Done, C., & Pounds, K. A. 1993, ARA&A, 31, 717
- Nenkova et al. (2008) Nenkova, M., Sirocky, M. M., Nikutta, R., Ivezić, Ž., & Elitzur, M. 2008, ApJ, 685, 160
- O’Dea (1998) O’Dea, C. P. 1998, PASP, 110, 493
- Ogle et al. (2006) Ogle, P., Whysong, D., & Antonucci, R. 2006, ApJ, 647, 161
- Ogle et al. (2003) Ogle, P. M., Brookings, T., Canizares, C. R., Lee, J. C., & Marshall, H. L. 2003, A&A, 402, 849
- Oliver et al. (2012) Oliver, S. J., Bock, J., Altieri, B., Amblard, A., Arumugam, V., Aussel, H., Babbedge, T., Beelen, A., Béthermin, M., Blain, A., Boselli, A., Bridge, C., Brisbin, D., Buat, V., Burgarella, D., Castro-Rodríguez, N., Cava, A., Chanial, P., Cirasuolo, M., Clements, D. L., Conley, A., Conversi, L., Cooray, A., Dowell, C. D., Dubois, E. N., Dwek, E., Dye, S., Eales, S., Elbaz, D., Farrah, D., Feltre, A., Ferrero, P., Fiolet, N., Fox, M., Franceschini, A., Gear, W., Giovannoli, E., Glenn, J., Gong, Y., González Solares, E. A., Griffin, M., Halpern, M., Harwit, M., Hatziminaoglou, E., Heinis, S., Hurley, P., Hwang, H. S., Hyde, A., Ibar, E., Ilbert, O., Isaak, K., Ivison, R. J., Lagache, G., Le Floc’h, E., Levenson, L., Faro, B. L., Lu, N., Madden, S., Maffei, B., Magdis, G., Mainetti, G., Marchetti, L., Marsden, G., Marshall, J., Mortier, A. M. J., Nguyen, H. T., O’Halloran, B., Omont, A., Page, M. J., Panuzzo, P., Papageorgiou, A., Patel, H., Pearson, C. P., Pérez-Fournon, I., Pohlen, M., Rawlings, J. I., Raymond, G., Rigopoulou, D., Riguccini, L., Rizzo, D., Rodighiero, G., Roseboom, I. G., Rowan-Robinson, M., Sánchez Portal, M., Schulz, B., Scott, D., Seymour, N., Shupe, D. L., Smith, A. J., Stevens, J. A., Symeonidis, M., Trichas, M., Tugwell, K. E., Vaccari, M., Valtchanov, I., Vieira, J. D., Viero, M., Vigroux, L., Wang, L., Ward, R., Wardlow, J., Wright, G., Xu, C. K., & Zemcov, M. 2012, MNRAS, 424, 1614
- Orr & Browne (1982) Orr, M. J. L. & Browne, I. W. A. 1982, MNRAS, 200, 1067
- Panessa et al. (2006) Panessa, F., Bassani, L., Cappi, M., Dadina, M., Barcons, X., Carrera, F. J., Ho, L. C., & Iwasawa, K. 2006, A&A, 455, 173
- Park et al. (2006) Park, T., Kashyap, V. L., Siemiginowska, A., van Dyk, D. A., Zezas, A., Heinke, C., & Wargelin, B. J. 2006, ApJ, 652, 610
- Polletta et al. (2008) Polletta, M., Weedman, D., Hönig, S., Lonsdale, C. J., Smith, H. E., & Houck, J. 2008, ApJ, 675, 960
- Polletta et al. (2006) Polletta, M. d. C., Wilkes, B. J., Siana, B., Lonsdale, C. J., Kilgard, R., Smith, H. E., Kim, D., Owen, F., Efstathiou, A., Jarrett, T., Stacey, G., Franceschini, A., Rowan-Robinson, M., Babbedge, T. S. R., Berta, S., Fang, F., Farrah, D., González-Solares, E., Morrison, G., Surace, J. A., & Shupe, D. L. 2006, ApJ, 642, 673
- Pounds & Vaughan (2006) Pounds, K. & Vaughan, S. 2006, MNRAS, 368, 707
- Pounds et al. (2005) Pounds, K. A., Wilkes, B. J., & Page, K. L. 2005, MNRAS, 362, 784
- Ptak et al. (2006) Ptak, A., Zakamska, N. L., Strauss, M. A., Krolik, J. H., Heckman, T. M., Schneider, D. P., & Brinkmann, J. 2006, ApJ, 637, 147
- Rawlings et al. (1996) Rawlings, S., Lacy, M., Leahy, J. P., Dunlop, J. S., Garrington, S. T., & Ludke, E. 1996, MNRAS, 279, L13
- Risaliti et al. (1999) Risaliti, G., Maiolino, R., & Salvati, M. 1999, ApJ, 522, 157
- Salvati et al. (2008) Salvati, M., Risaliti, G., Véron, P., & Woltjer, L. 2008, A&A, 478, 121
- Sanders et al. (1988) Sanders, D. B., Soifer, B. T., Elias, J. H., Madore, B. F., Matthews, K., Neugebauer, G., & Scoville, N. Z. 1988, ApJ, 325, 74
- Sazonov et al. (2012) Sazonov, S., Willner, S. P., Goulding, A. D., Hickox, R. C., Gorjian, V., Werner, M. W., Churazov, E., Krivonos, R., Revnivtsev, M., Sunyaev, R., Jones, C., Murray, S. S., Vikhlinin, A., Fabian, A. C., & Forman, W. R. 2012, ApJ, 757, 181
- Scoville et al. (2007) Scoville, N., Aussel, H., Brusa, M., Capak, P., Carollo, C. M., Elvis, M., Giavalisco, M., Guzzo, L., Hasinger, G., Impey, C., Kneib, J.-P., LeFevre, O., Lilly, S. J., Mobasher, B., Renzini, A., Rich, R. M., Sanders, D. B., Schinnerer, E., Schminovich, D., Shopbell, P., Taniguchi, Y., & Tyson, N. D. 2007, ApJS, 172, 1
- Seward (2000) Seward, F. D. X-Ray Astronomy, ed. A. N. Cox, 183
- Shi et al. (2006) Shi, Y., Rieke, G. H., Hines, D. C., Gorjian, V., Werner, M. W., Cleary, K., Low, F. J., Smith, P. S., & Bouwman, J. 2006, ApJ, 653, 127
- Shi et al. (2005) Shi, Y., Rieke, G. H., Hines, D. C., Neugebauer, G., Blaylock, M., Rigby, J., Egami, E., Gordon, K. D., & Alonso-Herrero, A. 2005, ApJ, 629, 88
- Siemiginowska et al. (2010) Siemiginowska, A., Burke, D. J., Aldcroft, T. L., Worrall, D. M., Allen, S., Bechtold, J., Clarke, T., & Cheung, C. C. 2010, ApJ, 722, 102
- Siemiginowska et al. (2005) Siemiginowska, A., Cheung, C. C., LaMassa, S., Burke, D. J., Aldcroft, T. L., Bechtold, J., Elvis, M., & Worrall, D. M. 2005, ApJ, 632, 110
- Siemiginowska et al. (2008) Siemiginowska, A., LaMassa, S., Aldcroft, T. L., Bechtold, J., & Elvis, M. 2008, ApJ, 684, 811
- Simpson (2005) Simpson, C. 2005, MNRAS, 360, 565
- Singal (1993) Singal, A. K. 1993, MNRAS, 262, L27
- Spencer et al. (1991) Spencer, R. E., Schilizzi, R. T., Fanti, C., Fanti, R., Parma, P., van Breugel, W. J. M., Venturi, T., Muxlow, T. W. B., & Rendong, N. 1991, MNRAS, 250, 225
- Tadhunter et al. (2007) Tadhunter, C., Dicken, D., Holt, J., Inskip, K., Morganti, R., Axon, D., Buchanan, C., González Delgado, R., Barthel, P., & van Bemmel, I. 2007, ApJ, 661, L13
- Tengstrand et al. (2009) Tengstrand, O., Guainazzi, M., Siemiginowska, A., Fonseca Bonilla, N., Labiano, A., Worrall, D. M., Grandi, P., & Piconcelli, E. 2009, A&A, 501, 89
- Tozzi et al. (2006) Tozzi, P., Gilli, R., Mainieri, V., Norman, C., Risaliti, G., Rosati, P., Bergeron, J., Borgani, S., Giacconi, R., Hasinger, G., Nonino, M., Streblyanska, A., Szokoly, G., Wang, J. X., & Zheng, W. 2006, A&A, 451, 457
- Treister et al. (2008) Treister, E., Krolik, J. H., & Dullemond, C. 2008, ApJ, 679, 140
- Treister & Urry (2006) Treister, E. & Urry, C. M. 2006, ApJ, 652, L79
- Trump et al. (2009) Trump, J. R., Impey, C. D., Taniguchi, Y., Brusa, M., Civano, F., Elvis, M., Gabor, J. M., Jahnke, K., Kelly, B. C., Koekemoer, A. M., Nagao, T., Salvato, M., Shioya, Y., Capak, P., Huchra, J. P., Kartaltepe, J. S., Lanzuisi, G., McCarthy, P. J., Maineri, V., & Scoville, N. Z. 2009, ApJ, 706, 797
- Whysong & Antonucci (2004) Whysong, D. & Antonucci, R. 2004, ApJ, 602, 116
- Wilkes & Elvis (1987) Wilkes, B. J. & Elvis, M. 1987, ApJ, 323, 243
- Wilkes et al. (2012) Wilkes, B. J., Lal, D. V., Worrall, D. M., Birkinshaw, M., Haas, M., Willner, S. P., Antonucci, R., Ashby, M. L. N., Avara, M., Barthel, P., Chini, R., Fazio, G. G., Hardcastle, M., Lawrence, C., Leipski, C., Ogle, P., & Schulz, B. 2012, ApJ, 745, 84
- Wilkes et al. (2005) Wilkes, B. J., Pounds, K. A., Schmidt, G. D., Smith, P. S., Cutri, R. M., Ghosh, H., Nelson, B., & Hines, D. C. 2005, ApJ, 634, 183
- Wilkes et al. (2002) Wilkes, B. J., Schmidt, G. D., Cutri, R. M., Ghosh, H., Hines, D. C., Nelson, B., & Smith, P. S. 2002, ApJ, 564, L65
- Willott et al. (2000) Willott, C. J., Rawlings, S., Blundell, K. M., & Lacy, M. 2000, MNRAS, 316, 449
- Wilman & Fabian (1999) Wilman, R. J. & Fabian, A. C. 1999, MNRAS, 309, 862
- Worrall (2009) Worrall, D. M. 2009, A&A Rev., 17, 1
- Worrall & Birkinshaw (1994) Worrall, D. M. & Birkinshaw, M. 1994, ApJ, 427, 134
- Worrall et al. (1994) Worrall, D. M., Lawrence, C. R., Pearson, T. J., & Readhead, A. C. S. 1994, ApJ, 420, L17
- Worrall & Wilkes (1990) Worrall, D. M. & Wilkes, B. J. 1990, ApJ, 360, 396
- Zakamska et al. (2008) Zakamska, N. L., Gómez, L., Strauss, M. A., & Krolik, J. H. 2008, AJ, 136, 1607
- Zamorani et al. (1981) Zamorani, G., Henry, J. P., Maccacaro, T., Tananbaum, H., Soltan, A., Avni, Y., Liebert, J., Stocke, J., Strittmatter, P. A., Weymann, R. J., Smith, M. G., & Condon, J. J. 1981, ApJ, 245, 357
- Zirm et al. (2003) Zirm, A. W., Dickinson, M., & Dey, A. 2003, ApJ, 585, 90
| Name | OBSID | Date Obs. | RA | Dec. | z | Exp. time | Source | Galactic | Ref. | F(5 GHz) | log | log L | Ref. |
|---|---|---|---|---|---|---|---|---|---|---|---|---|---|
| UT | J2000.0 | J2000 | ks | Type | X-ray | Jy (tot) | erg s-1 (tot) | Radio | |||||
| 3CRR 009 | 1595 (catalog ADS/Sa.CXO#Obs/1595) | 2001-06-10 | 00:20:25.2 | +15:40:55 | 2.009 | 19.88 | QSO | 4.16 | 1 | 0.546 | -2.04 | 44.91 | 14 |
| 3CRR 013 | 9241 (catalog ADS/Sa.CXO#Obs/9241) | 2008-06-01 | 00:34:14.5 | +39:24:17 | 1.351 | 19.53 | NLRG | 6.39 | 0.397 | -3.04 | 44.35 | 15 | |
| 3CRR 014 | 9242 (catalog ADS/Sa.CXO#Obs/9242) | 2008-05-29 | 00:36:06.5 | +18:37:59 | 1.469 | 3.00 | QSO | 4.12 | 0.606 | -1.75 | 44.62 | 16 | |
| 3CRR 043 | 9324 (catalog ADS/Sa.CXO#Obs/9324) | 2008-06-17 | 01:29:59.8 | +23:38:20 | 1.459 | 3.04 | QSO/CSS | 7.13 | 1.082 | -1.22 | 44.87 | 17 | |
| 3CRR 065 | 9243 (catalog ADS/Sa.CXO#Obs/9243) | 2008-06-30 | 02:23:43.2 | +40:00:52 | 1.176 | 20.91 | NLRG | 6.12 | 0.765 | -3.17 | 44.48 | 15 | |
| 3CRR 068.1 | 9244 (catalog ADS/Sa.CXO#Obs/9244) | 2008-02-10 | 02:32:28.9 | +34:23:47 | 1.238 | 3.05 | QSO | 6.02 | 0.824 | -2.87 | 44.57 | 18 | |
| 3CRR 068.2 | 9245 (catalog ADS/Sa.CXO#Obs/9245) | 2008-03-06 | 02:34:23.8 | +31:34:17 | 1.575 | 19.88 | NLRG | 7.78 | 0.179 | -2.63 | 44.17 | 15 | |
| 3CRR 181 | 9246 (catalog ADS/Sa.CXO#Obs/9246) | 2009-02-12 | 07:28:10.3 | +14:37:36 | 1.382 | 3.02 | QSO | 6.83 | 0.655 | -2.03 | 44.59 | 19 | |
| 3CRR 186 | 3098 (catalog ADS/Sa.CXO#Obs/3098) | 2002-05-16 | 07:44:17.4 | +37:53:17 | 1.067 | 34.44 | QSO/CSS | 5.64 | 2 | 0.377 | -1.38 | 44.07 | 17 |
| 3CRR 190 | 9247 (catalog ADS/Sa.CXO#Obs/9247) | 2007-12-31 | 08:01:33.5 | +14:14:42 | 1.195 | 3.06 | QSO/CSS | 2.65 | 0.814 | -1.01 | 44.53 | 17 | |
| 3CRR 191 | 5626 (catalog ADS/Sa.CXO#Obs/5626) | 2004-12-12 | 08:04:47.9 | +10:15:23 | 1.956 | 19.77 | QSO | 2.44 | 3 | 0.457 | -0.99 | 44.81 | 20 |
| 3CRR 204 | 9248 (catalog ADS/Sa.CXO#Obs/9248) | 2008-01-13 | 08:37:44.9 | +65:13:35 | 1.112 | 3.05 | QSO | 4.27 | 0.338 | -1.06 | 44.07 | 14 | |
| 3CRR 205 | 9249 (catalog ADS/Sa.CXO#Obs/9249) | 2008-01-26 | 08:39:06.4 | +57:54:17 | 1.534 | 96.72 | QSO | 4.51 | 5 | 0.665 | -1.51 | 44.71 | 21 |
| 3CRR 208 | 9250 (catalog ADS/Sa.CXO#Obs/9250) | 2008-01-08 | 08:53:08.8 | +13:52:55 | 1.110 | 3.01 | QSO | 3.59 | 0.536 | -0.98 | 44.26 | 14 | |
| 3CRR 212 | 434 (catalog ADS/Sa.CXO#Obs/434) | 2000-10-26 | 08:58:41.5 | +14:09:44 | 1.048 | 18.05 | QSO | 3.63 | 4 | 0.884 | -0.69 | 44.42 | 22 |
| 3CRR 239 | 0306370701 | 2005-04-24 | 10:11:45.4 | +46:28:20 | 1.781 | 14 | NLRG | 0.90 | 5 | 0.328 | -2.82 | 44.56 | 15 |
| 3CRR 241 | 9251 (catalog ADS/Sa.CXO#Obs/9251) | 2008-03-13 | 10:21:54.5 | +21:59:30 | 1.617 | 18.93 | NLRG/CSS | 2.02 | 5 | 0.338 | -2.05 | 44.47 | 23 |
| 3CRR 245 | 2136 (catalog ADS/Sa.CXO#Obs/2136) | 2001-02-12 | 10:42:44.6 | +12:03:31 | 1.029 | 10.40 | QSO | 2.87 | 3 | 1.38 | +0.29 | 44.59 | 16 |
| 3CRR 252 | 9252 (catalog ADS/Sa.CXO#Obs/9252) | 2008-03-11 | 11:11:33.0 | +35:40:42 | 1.100 | 19.45 | NLRG | 1.73 | 0.318 | -2.46 | 44.03 | 18 | |
| 3CRR 266 | 9253 (catalog ADS/Sa.CXO#Obs/9253) | 2008-02-16 | 11:45:43.4 | +49:46:08 | 1.275 | 18.23 | NLRG | 1.80 | 0.318 | -3.27 | 44.19 | 15 | |
| 3CRR 267 | 9254 (catalog ADS/Sa.CXO#Obs/9254) | 2008-07-07 | 11:49:56.5 | +12:47:19 | 1.140 | 19.18 | NLRG | 2.90 | 0.586 | -2.29 | 44.33 | 15 | |
| 3CRR 268.4 | 9325 (catalog ADS/Sa.CXO#Obs/9325) | 2009-02-23 | 12:09:13.6 | +43:39:21 | 1.398 | 3.02 | QSO | 1.30 | 0.596 | -1.04 | 44.56 | 24 | |
| 3CRR 270.1 | 9255 (catalog ADS/Sa.CXO#Obs/9255) | 2008-02-16 | 12:20:33.9 | +33:43:12 | 1.532 | 9.67 | QSO | 1.29 | 6 | 0.864 | -0.55 | 44.82 | 16 |
| 3CRR 287 | 3103 (catalog ADS/Sa.CXO#Obs/3103) | 2002-01-06 | 13:30:37.7 | +25:09:11 | 1.055 | 39.93 | QSO/CSS | 1.08 | 2 | 3.237 | 44.99 | 25 | |
| 3CRR 294 | 3207 (catalog ADS/Sa.CXO#Obs/3207) | 2002-02-27 | 14:06:44.0 | +34:11:25 | 1.779 | 123.63 | NLRG | 1.21 | 7 | 0.278 | -2.72 | 44.49 | 24 |
| 3CRR 318 | 9256 (catalog ADS/Sa.CXO#Obs/9256) | 2008-04-05 | 15:20:5.4 | +20:16:06 | 1.574 | 9.78 | QSO/CSS | 4.01 | 5 | 0.745 | -0.86 | 44.79 | 26 |
| 3CRR 322 | 0028540301 | 2002-05-17 | 15:35:01.2 | +55:36:53 | 1.681 | 10.0/6.512 | NLRG | 1.34 | 8 | 0.457 | -3.18 | 44.64 | 27 |
| 3CRR 324 | 326 (catalog ADS/Sa.CXO#Obs/326) | 2000-06-25 | 15:49:48.9 | +21:25:38 | 1.206 | 42.15 | NLRG | 4.31 | 9 | 0.606 | -3.64 | 44.41 | 28 |
| 3CRR 325 | 4818 (catalog ADS/Sa.CXO#Obs/4818) | 2005-04-17 | 15:49:58.4 | +62:41:22 | 1.135 | 28.66 | QSO | 1.65 | 10 | 0.824 | -2.53 | 44.48 | 18 |
| 3CRR 356 | 9257 (catalog ADS/Sa.CXO#Obs/9257) | 2008-01-20 | 17:24:19.0 | +50:57:40 | 1.079 | 19.87 | NLRG | 2.76 | 0.377 | -2.53 | 44.08 | 29 | |
| 4C 16.49 | 9262 (catalog ADS/Sa.CXO#Obs/9262) | 2008-01-21 | 17:34:42.6 | +16:00:31 | 1.880 | 3.0 | QSO | 6.64 | 0.320 | -1.28 | 44.61 | 32 | |
| 4C 13.66 | 9263 (catalog ADS/Sa.CXO#Obs/9263) | 2008-02-05 | 18:01:38.9 | +13:51:24 | 1.450 | 19.90 | NLRG/CSS | 11.15 | 0.340 | -2.23 | 44.36 | 31 | |
| 3CRR 368 | 9258 (catalog ADS/Sa.CXO#Obs/9258) | 2008-06-01 | 18:05:6.3 | +11:01:33 | 1.131 | 19.90 | NLRG | 9.03 | 0.209 | -3.00 | 43.88 | 28 | |
| 3CRR 432 | 5624 (catalog ADS/Sa.CXO#Obs/5624) | 2005-01-07 | 21:22:46.2 | +17:04:38 | 1.785 | 19.78 | QSO | 7.34 | 5,11 | 0.308 | -1.60 | 44.54 | 14 |
| 3CRR 437 | 9259 (catalog ADS/Sa.CXO#Obs/9259) | 2008-01-07 | 21:47:25.1 | +15:20:37 | 1.480 | 19.88 | NLRG | 7.16 | 0.874 | -3.86 | 44.79 | 15 | |
| 3CRR 454.0 | 0306370201 | 2005-05-25 | 22:51:34.7 | +18:48:40 | 1.757 | 16 | QSO/CSS | 5.90 | 5 | 0.784 | -0.47 | 44.93 | 17 |
| 3CRR 469.1 | 9260 (catalog ADS/Sa.CXO#Obs/9260) | 2009-05-18 | 23:55:23.3 | +79:55:20 | 1.336 | 20.18 | NLRG | 13.74 | 13 | 0.407 | -2.19 | 44.35 | 30 |
| 3CRR 470 | 9261 (catalog ADS/Sa.CXO#Obs/9261) | 2008-03-03 | 23:58:35.3 | +44:04:39 | 1.653 | 19.91 | NLRG | 9.46 | 0.546 | -2.43 | 44.70 | 15 |
Notes:
1 Fabian et al. (2003a),
2 Siemiginowska et al. (2008),
3 Gambill et al. (2003),
4 Aldcroft et al. (2003),
5 Salvati et al. (2008) (XMM-Newton data),
6 Wilkes et al. (2012),
7 Fabian et al. (2001, 2003b),
8 Belsole et al. (2004) (XMM-Newton data, extended emission only),
9 Hardcastle et al. (2004),
10 Hardcastle et al. (2009) (used earlier, incorrect redshift of 0.86),
11 Erlund et al. (2006),
12 XMM-Newton exposures in MOS/pn, after screening for periods of high background
13 Laskar et al. (2010) (XMM-Newton data),
14 Bridle et al. (1994),
15 Best et al. (1997),
16 Akujor et al. (1994),
17 Ludke et al. (1998),
18 Fernini et al. (1997),
19 Mantovani et al. (1992),
20 Akujor & Garrington (1995),
21 Lonsdale & Barthel (1984),
22 Akujor et al. (1991),
23 Fanti et al. (1985),
24 Liu et al. (1992),
25 Fanti et al. (1989),
26 Spencer et al. (1991),
27 Law-Green et al. (1995),
28 Best et al. (1998),
29 Fernini et al. (1993),
30 Longair (1975),
31 Rawlings et al. (1996),
32 Lonsdale et al. (1993)
| Name | Type2 | Net Cts | Bkgrd. Cts | f(1 keV)4 | F(0.3-8 keV)4 | log L(0.3-8 keV)5 | HR6 | |||
|---|---|---|---|---|---|---|---|---|---|---|
| (0.3-8 keV) | (0.3-8 keV) | cm-2 | erg s-1 | |||||||
| 3C 009 | Q | 805.828.4 | 1.190.08 | 0.9 | 1.9 | 26.20.9 | ||||
| 0.8 | 1.740.08 | 44.9 | 27.41.6 | |||||||
| 3C 013 | N/CT | 15.3 4.0 | 0.680.06 | 0.3 | 1.9 | 0.40.2 | ||||
| 3C 014 | Q | 238.915.5 | 0.140.03 | 0.6 | 1.9 | 73.03.9 | ||||
| 3C 043 | Q/C | 170.813.1 | 0.160.03 | 0.5 | 1.9 | 47.73.2 | ||||
| 3C 065 | N | 205.214.4 | 0.810.06 | 0.6 | 1.9 | 25.10.3 | ||||
| 3C 068.1 | Q | 43.7 6.6 | 0.290.04 | 0.4 | 1.9 | 131.81.6 | ||||
| 3C 068.2 | N/CT | 8.2 3.0 | 0.770.06 | 0.2 | 1.9 | 0.210.16 | ||||
| 3C 181 | Q | 188.813.8 | 0.160.03 | 0.7 | 1.9 | 47.34.2 | ||||
| 3C 1867 | Q/C | 1984.444.6 | 4.650.15 | 1.3 | 1.9 | 39.01.0 | ||||
| 1.2 | ||||||||||
| 3C 190 | Q/C | 172.813.2 | 0.160.03 | 0.9 | 1.9 | 45.23.6 | ||||
| 3C 191 | Q | 824.228.7 | 0.760.06 | 0.8 | 1.9 | 28.41.1 | ||||
| 0.7 | 1.700.08 | 29.61.9 | ||||||||
| 3C 204 | Q | 358.819.0 | 0.200.03 | 0.6 | 1.9 | 92.65.2 | ||||
| 3C 2058 | Q | 1006.531.7 | 0.510.05 | 1.0 | 1.9 | 90.82.5 | ||||
| 0.6 | 91.44.8 | |||||||||
| 3C 208 | Q | 280.816.8 | 0.200.03 | 0.8 | 1.9 | 69.65.0 | ||||
| 3C 212 | Q | 3944.162.8 | 0.920.07 | 0.8 | 1.9 | 182.51.9 | ||||
| 0.6 | 1.680.04 | 183.53.4 | ||||||||
| 3C 2399 | N | |||||||||
| 3C 241 | N/C | 147.212.2 | 0.760.06 | 0.7 | 1.9 | 12.60.4 | ||||
| 3C 245 | Q | 2067.445.5 | 0.650.07 | 1.4 | 1.4 | 130.32.6 | ||||
| 1.0 | 141.45.8 | |||||||||
| 3C 252 | N | 89.6 9.5 | 1.450.09 | 1.1 | 1.9 | 11.90.2 | ||||
| 3C 266 | N/CT | 19.2 4.5 | 0.770.06 | 0.3 | 1.9 | 0.360.23 | ||||
| 3C 267 | N | 167.213.0 | 0.820.06 | 1.3 | 1.9 | 22.00.4 | ||||
| 3C 268.4 | Q | 291.817.1 | 0.180.03 | 1.2 | 1.9 | 78.65.0 | ||||
| 3C 270.1 | Q | 734.627.1 | 0.450.05 | 1.2 | 1.9 | 53.22.5 | ||||
| 1.1 | 57.64.3 | |||||||||
| 3C 287 | Q/C | 3862.062.2 | 2.010.14 | 0.6 | 1.9 | 66.31.2 | ||||
| 0.6 | 66.61.7 | |||||||||
| 3C 29410 | N/CT | 202.914.4 | 3.080.13 | 3.6 | 1.9 | 0.340.06 | ||||
| 3C 318 | Q/C | 267.516.4 | 0.500.05 | 0.5 | 1.9 | 21.41.6 | ||||
| 3C 32211 | N | 17.66.5 | 12.43.5 | |||||||
| 3C 32412 | N/CT | 45.2 6.9 | 2.800.12 | 0.4 | 1.9 | 0.490.11 | ||||
| 3C 325 | Q | 360.119.0 | 0.920.07 | 0.8 | 1.9 | 24.60.3 | ||||
| 3C 356 | N/CT | 26.1 5.2 | 0.870.07 | 0.5 | 1.9 | 0.520.24 | ||||
| 4C 16.49 | Q | 183.813.6 | 0.220.03 | 0.7 | 1.9 | 46.94.0 | ||||
| 4C 13.66 | N/C/CT | 20.0 4.6 | 0.980.07 | 0.7 | 1.9 | 0.610.23 | ||||
| 3C 36812 | N/CT | 17.1 4.2 | 0.860.07 | 0.1 | 1.9 | 0.530.24 | ||||
| 3C 432 | Q | 771.227.8 | 0.760.06 | 0.8 | 1.9 | 30.70.9 | ||||
| 0.8 | 30.61.7 | |||||||||
| 3C 437 | N/CT | 9.8 3.3 | 0.840.06 | 0.4 | 1.9 | 0.190.17 | ||||
| 3C 454.09 | Q/C | 0.13 | ||||||||
| 3C 469.1 | N | 80.9 9.1 | 1.120.08 | 0.3 | 1.9 | 18.00.2 | ||||
| 3C 470 | N | 55.2 7.5 | 0.850.07 | 0.2 | 1.9 | 16.00.2 |
Note. — 1) X-ray data were fit with a power law () + Galactic absorption, plus intrinsic equivalent hydrogen column density (). Generally no constraints could be placed on (int) when the net counts were .
2) Source Classification: Q = quasar; N = Narrow Line Radio Galaxy (NLRG); C = Compact Steep Spectrum (CSS) source; CT = Compton Thick candidate
4) Flux densities (in units of pht cm-2 skeV-1) and fluxes (in units of erg cm-2 s-1) are quoted with 1 errors and based on the best fit spectral model. Fits to all NLRGs with 50cts required intrinsic () absorption. Upper limits to (int) are quoted at 3.
5) L(0.3-8keV) is determined in the rest frame including a correction for any significant (int)
6) Hardness ratios are calculated using BEHR (Park et al., 2006)
7) Detailed spectral fits for this source and its surrounding cluster are presented in Siemiginowska et al. (2005, 2010)
8) The X-ray spectrum is flat, , this results in an apparent (int) for the fit.
9) Equivalent Chandra luminosity and HR were derived based on published XMM-Newton spectral fits which reported no counts or flux (Salvati et al., 2008; Siemiginowska et al., 2010).
10) A single power law does not provide a good fit to the data. A detailed spectral fit (Fabian et al., 2003b) yields = cm-2, dominated by a reflection component. This source is not included as a CT candidate in Section 5.1.
11) The upper limit was determined directly from the XMM-Newton dataset using an on-source circle of radius 8”. Due to the weak detection of extended emission aligned with the lobes, the counts are treated as an upper limit to any true core emission.
12) Hardness ratios are significantly different using a smaller circle (1” radius): 3C 324: ; 3C 368:
| Name | (int)1 |
|---|---|
| cm-2 | |
| 3C 13 | 1.8 |
| 3C 68.2 | 2.0 |
| 3C 266 | 1.8 |
| 3C 294 | 1.4 |
| 3C 324 | 1.8 |
| 3C 356 | 1.9 |
| 3C 368 | 1.9 |
| 3C 437 | 2.0 |
| 4C 13.66 | 1.4 |
Note. — 1: Uncertainty is , accounting for 1z2, 1.52.2.