GASPS - a Herschel survey of gas and dust in Protoplanetary Disks: Summary and Initial Statistics
Abstract
We describe a large-scale far-infrared line and continuum survey of protoplanetary disk through to young debris disk systems carried out using the PACS instrument on the Herschel Space Observatory. This Open Time Key Program, known as GASPS (Gas Survey of Protoplanetary Systems), targeted 250 young stars in narrow wavelength regions covering the [OI] fine structure line at 63, the brightest far-infrared line in such objects. A subset of the brightest targets were also surveyed in [OI] 145, [CII] at 157, as well as several transitions of H2O and high-excitation CO lines at selected wavelengths between 78 and 180. Additionally, GASPS included continuum photometry at 70, 100 and 160, around the peak of the dust emission. The targets were SED Class II-III T Tauri stars and debris disks from 7 nearby young associations, along with a comparable sample of isolated Herbig AeBe stars. The aim was to study the global gas and dust content in a wide sample of circumstellar disks, combining the results with models in a systematic way. In this overview paper we review the scientific aims, target selection and observing strategy. We summarise some of the initial results, showing line identifications, listing the detections, and giving a first statistical study of line detectability.
The [OI] line at 63 was the brightest line seen in almost all objects, by a factor of . Overall [OI]63 detection rates were 49%, with 100% of HAeBe stars and 43% of T Tauri stars detected. A comparison with published disk dust masses (derived mainly from sub-mm continuum, assuming standard values of the mm mass opacity) shows a dust mass threshold for [OI]63 detection of . Normalising to a distance of 140pc, 84% of objects with dust masses can be detected in this line in the present survey, along with 32% of those of mass , and only a very small number of unusual objects with lower masses. This is consistent with models with a moderate UV excess and disk flaring. For a given disk mass, [OI] detectability is lower for M stars compared with earlier spectral types. Both the continuum and line emission was, in most systems, spatially and spectrally unresolved and centred on the star, suggesting emission in most cases was from the disk. Approximately 10 objects showed resolved emission, most likely from outflows.
In the GASPS sample, [OI] detection rates in T Tauri associations in the 0.3-4Myr age range were 50%. For each association in the 5-20Myr age range, 2 stars remain detectable in [OI]63, and no systems were detected in associations with age 20Myr. Comparing with the total number of young stars in each association, and assuming a ISM-like gas/dust ratio, this indicates that 18% of stars retain a gas-rich disk of total mass for 1-4Myr, 1-7% keep such disks for 5-10Myr, but none are detected beyond 10-20Myr.
The brightest [OI] objects from GASPS were also observed in [OI]145, [CII]157 and CO J=18-17, with detection rates of 20-40%. Detection of the [CII] line was not correlated with disk mass, suggesting it arises more commonly from a compact remnant envelope.
1 Introduction
One of the most significant astronomical discoveries of the past decade has been the realisation that roughly 20% of main-sequence FGK stars harbour planets (Fischer & Valenti, 2005; Borucki et al., 2011). Moreover, at least 16% of FGK main-sequence stars are found to have a debris disk more massive than the dust in our own Solar System, indicating an unseen population of colliding planetesimals (Trilling et al., 2008; Wyatt, 2008). These two independent results imply that the planet and planetesimal formation process is common and robust, and can lead to a wide diversity of systems. However, it is not clear how young gas-rich disks - where planet formation is either still occuring or has recently completed - evolve into mature planetary and/or debris disk systems.
Both debris disks and main sequence planetary systems are gas-poor. Debris systems, composed of grains in a collisional cascade, have dust masses of , although the mass of planetesimals - thought to be the starting point of the cascade - may be or more (Wyatt & Dent, 2002). In most cases, no molecular gas is detected (Dent et al., 1995); however, in a very few nearby young debris systems such as Pic, a small mass of mostly atomic gas is seen (Lagrange et al., 1998; Olofsson et al., 2001; Roberge et al., 2006). Possible gas formation mechanisms in such systems are secondary release during grain-grain collisions (Thébault & Augereau, 2005), photodesorption from dust grains (Chen et al., 2007), or sublimation from comets (Zuckerman & Song, 2012).
By contrast, the material around young, pre-main-sequence (but optically-visible) stars is gas-rich. Such so-called protoplanetary disks are found towards 10% of stars aged 5 Myr, and at least 80% of stars aged Myr (Haisch et al., 2001). Similar in size to debris disks, their dust masses are typically . The assumption normally made is that 99% of the disk mass is gas, the same as that of the natant interstellar cloud, leading to these disks being described as ‘primordial’. Their total masses would then be similar to that of the minimum mass Solar Nebula (Williams & Cieza, 2011). In the even younger, so-called ‘protostellar’ stage (typically Myr), disk masses may be still larger, approaching that of the protostar itself. Systems at this phase are usually optically obscured, as the remnant cloud and infalling envelope have not yet dispersed.
Dissipation of the primordial disk gas limits the timescale for giant planet formation, affects the dynamics of planetary bodies of all sizes during their formation, and determines the final architecture and constitution of planetary systems. No planet formation will take place without gas to damp the particle velocities. The methods for removal of the gas and dust components are generally different. Photoevaporation is thought to be important in gas dissipation (Gorti & Hollenbach, 2004, 2009), and bipolar outflow jets may also play a role. Molecular species will also be depleted in regions exposed to the photodestructive effects of UV (Kamp & Sammar, 2004). Selective removal of the dust can be caused by the interaction with a planet (Rice et al., 2006), ice or refractory grain sublimation (Thi et al., 2005), or by grain growth and settling (Dullemond & Dominik, 2005). As noted by these authors, these effects can be very rapid, occuring on timescales yrs - significantly shorter than the disk ages.
Statistical studies show that the presence of Jupiter-mass planets in mature systems is strongly influenced by stellar metallicity, mass, and binary companions (Fischer & Valenti, 2005; Johnson et al., 2007). But do the stellar characteristics also affect disks? Age clearly affects the fraction of stars with primordial disks (Haisch et al., 2001) and, on a longer timescale, debris disks (Carpenter et al., 2009). Disks may be affected by binary companions in debris systems (Trilling et al., 2007) but not substantially by stellar metallicity in debris or protoplanetary systems (Greaves et al., 2006; D’Orazi et al., 2011; Maldonado et al., 2012). And although there appears to be no direct correlation between debris disks and planets (Bryden et al., 2009), there are clearly some systems which have both, and where the planet creates a gap or affects the disk shape (Kalas et al., 2008; Thalmann et al., 2010; Hughes et al., 2011). At present, there is no clear observational evidence that primordial disk lifetimes are significantly affected by the stellar mass (Boissier et al., 2011; Ercolano et al., 2011).
To study disk evolution and look for general trends, many large and unbiased dust continuum surveys have been carried out, in the near-infrared (Kenyon & Hartmann, 1995; Haisch et al., 2001), the mid to far-infrared (most complete out to a wavelength of 70 in the Spitzer projects FEPS (Hillenbrand et al., 2008) and c2d (Evans et al., 2009)), and in the sub-mm (Andrews & Williams, 2005). They indicate primordial disk lifetimes of a few Myr, but there is a broad distribution of dust mass at any particular age, with notable outliers. For example, although the fraction of disk-bearing stars in the 1Myr-old Taurus star-forming region is as high as 75%, a significant minority of its stars have no detectable dust excess (Luhman et al., 2010).
Dust emission is ostensibly easy to interpret, as the normally optically-thin sub-mm continuum can be used to directly estimate the dust mass, , by employing a mass opacity, and emissivity power law, . Typical values adopted in the literature are and (Andrews & Williams, 2005). However, depends on the grain size distribution (D’Alessio et al., 2006), and most of the solid body mass may be in large grains contributing little to the observed flux (Wyatt & Dent, 2002; Krivov et al., 2008). One option is to define a dust mass which only includes solid material smaller than 1mm (Thi et al., 2010); this is reasonably consistent with the standard literature value of . Deriving the total disk mass requires an assumption of the gas:dust ratio; normally the interstellar medium value of 100 is used, but it is unclear whether this value is maintained in disks (and it is certainly not valid for debris-dominated systems). Throughout most of this current work, we have quoted disk masses in terms of the dust mass, , allowing comparisons to be made independently of the gas/dust ratio.
Although gas dominates the mass (at least for protoplanetary disks), emission lines are generally more difficult than the continuum to both observe and interpret. The bulk of the gas is in H2 which has no dipolar moment. The observed intensity is affected by abundance variations due to complex chemistry, molecular photodissociation, or freezeout in the cool disk midplane, as well as high optical depths and uncertain excitation processes. Unlike the continuum, a more limited number of gas surveys have been carried out. Mid-IR studies of H2O show emission from the inner 10AU in many T Tauri but few HAeBe stars (Pontoppidan et al., 2010). Spitzer surveys of [NeII] at 12.8 show warm gas in many systems, thought to arise from winds from the disk surface at radii up to 10AU (Lahuis et al., 2007; Pascucci & Sterzik, 2009). At sub-mm wavelengths, limited surveys of low-J rotational lines of CO have been carried out, both with single-dish telescopes (Zuckerman et al., 1995; Dent et al., 2005), and with interferometers (Öberg et al., 2010). Most of this emission arises from 30-300AU radii. In the far-IR, scans of a few bright embedded Class 0 YSOs (e.g. L1448-mm) and massive young stars (e.g. Orion-KL) with the long-wavelength spectrometer (LWS) on ISO showed rich spectra, including fine structure lines of [OI] and [CII], and many transitions of H2O and CO (Benedettini et al., 2002; van Dishoeck, 2004). Class I YSOs also show similar lines, albeit fainter than the Class 0s. Among less embedded systems, the bright ‘prototypical’ Class I-II object T Tauri111There is some discussion as to whether T Tauri should actually be classified as a Class I YSO with a massive envelope: typically, the prototypical object in a class actually turns out to be rather unusual! also has many FIR lines (Spinoglio et al., 2000). However, more typical optically-visible Class II-III objects were not detected in FIR lines due to the relatively low sensitivity and large beams.
Both gas and dust observations suffer from problems in interpretation, and both are needed for the best understanding of disks. The motivation for GASPS was to conduct a relatively large, systematic study of gas and dust in the far-infrared, utilising the sensitivity improvements available with the Herschel Space Observatory222Herschel is an ESA space observatory with science instruments provided by European-led Principal Investigator consortia and with important participation from NASA.. The survey covers a broad sample of optically-visible young systems, from Class II gas-rich protoplanetary disks, through to Class III objects and gas-poor debris disks. It focusses on the brightest lines and the FIR peak of the continuum emission, and is complemented by data at other wavelengths. In this paper, we describe the survey and observing techniques (2), discuss the target selection criteria and give the complete target list (3 and Table A). 4 summarises the origins of FIR line emission in these objects, and outlines the modeling used by GASPS. In 5, we give an overview of the results, with the lines detected and the detection statistics.
2 The GASPS survey
GASPS (Gas Survey of Protoplanetary Systems) uses the Photodetector Array Camera & Spectrophotometer (PACS) (Poglitsch et al., 2010) on the Herschel spacecraft (Pilbratt et al., 2010) to study a predefined set of the brightest lines and dust continuum in the far-infrared from a relatively large sample of targets. The aim was to allow the detection of gas in systems with a disk mass limit similar to, and possibly lower than, existing sub-mm dust surveys. The wavelength coverage of the spectroscopic observations was tailored to include the [OI] 3P1-3P2 and 3P0-3P1 lines at 63 and 145, [CII] 2P3/2-2P1/2 at 157, several H2O lines, particularly those at 78 and 180, along with adjacent transitions of CO and OH observable without incurring a significant penalty on the total required time. In addition, GASPS provides accurate far-infrared photometry at 70 and 160 and, in most cases, 100333FIR fluxes for the brighter objects are available from IRAS, ISO or Spitzer, although in many cases the fluxes at are unreliable because of the large beams and confusion levels involved - particularly in star forming regions. . The project was awarded 400 hours of time to survey up to 250 young systems (in several cases, multiple systems were covered in the same observation), and observations were taken at various times between Dec 2010 and July 2012. The spectrometer was used with up to 4 settings per target, each of which covered a relatively small wavelength range (typically ) simultaneously in two PACS grating orders. Most objects were observed in the setting covering the [OI]63 line, with a subset of the brighter ones observed in the other settings, resulting in a two-phase survey strategy (see §2.1.3).
To help maintain the unbiased nature of the survey, targets were chosen with a wide range of spectral type, disk dust mass, age and other stellar parameters (see §3). They were located in 7 well-studied young clusters and associations, with a distance range of 40 - 200 pc (with the majority around 150 pc). Assuming typical disk sizes of 100-300AU (Williams & Cieza, 2011) and with the angular resolution of Herschel/PACS of 5 arcsec at the shortest wavelength, line and continuum emission from the disk itself is unlikely to be spatially resolved. With the highest spectral resolution of PACS (88 km s-1 at 63), disk emission will also not be spectrally resolved (the Keplerian rotation velocity of most of the disk mass is 10-50 km s-1). However, non-disk components such as outflow jets or ambient cloud emission may be resolved (see §4). In most cases, all we have is a single measurement of the line flux on each target, yielding highly degenerate solutions to the underlying disk physics and chemistry. In the absence of resolution, a survey covering a wide range of target parameters is required, along with detailed modeling and data from other wavelengths.
2.1 Observational technique and survey strategy
2.1.1 PACS Spectroscopy
The PACS instrument (Poglitsch et al., 2010) offers resolutions of 1500-3400 (200-88 km s-1) and the ability to observe most of the 60-200 wavelength range. In spectroscopic mode, PACS provides an IFU with a 55 array of spaxels, and a pixel size of 9.2 arcsec. By comparison the instrumental PSF ranges from 4.5 arcsec (FWHM) at 63 up to 13 arcsec at 180. For the GASPS project, spectral observations were taken using line-scan or range-scan modes, whereby the grating is scanned over a small wavelength range, taking data from all detector pixels simultaneously. Wavelengths around the central region of the spectra are observed by all of the 16 detector pixels to minimise flat-fielding problems due to inter-pixel variations. Line-scan observations have small wavelength coverage, and are designed to cover a single spectrally-unresolved line and immediately adjacent continuum with the full sensitivity. Range-scan observations have an arbitrary wavelength coverage and for GASPS were set up to include several close lines of interest by scanning up to 2. Table 1 shows the settings of the four wavelength scans A through D. Each has a primary line targetted in one of the grating orders; the secondary simultaneous grating order (given in brackets) was used to observe other useful lines (the full list of lines detected during the course of the survey is given in 5.1). For a few individual targets, integration times longer that given in Table 1 were used for followup of marginal detections. Note that with the array spectral scanning technique, not all wavelengths are being observed by a detector at all times, so the noise level increases towards the spectrum edges. However, the rms values in the scan centre in Table 1 are in good agreement with predictions. The observed sensitivity at 63 is equivalent to a line luminosity sensitivity limit of D L⊙, where D is the source distance in pc.
| Grating | Primary | Primary | Grating | Time1 | Predicted | Observed | Notes |
|---|---|---|---|---|---|---|---|
| setting | line | () | orders | (s) | rms2 | rms2 | |
| A | [OI]63.2 | 63.08-63.29 | 3 (1) | 1760 | 4.6 | 2.5-3 | LineScan |
| B | [CII]157.7 | 157.10-158.90 | 1 (2) | 1500 | 1.3 | 0.8-1.4 | RangeScan |
| C | H2O 180 | 178.90-181.00 | 1 (2) | 2000 | 1.7 | 2.0 | RangeScan |
| D | [OI]145.5 | 144.00-146.10 | 1 (2) | 1630 | 1.4 | 1.6 | RangeScan |
| Phot | (Blue) | 60-85 | 3 | 180 | 2.3 | 2.6-3.0 | |
| Phot | (Green) | 85-130 | 3 | 180 | 2.7 | 2.6-3.0 | |
| Phot | (Red) | 130-210 | 1 | 360 | 3.6 | 4.7-9.0 | (background) |
(1) Approximate times for most targets in the main survey, not including overheads.
(2) Note that noise rms levels are given in units of for the spectroscopic observations, and in mJy for the continuum photometry.
Observations were performed in chop-nod mode with a small throw (1.5 arcmin), primarily to remove telescope and background variations. This chops out smooth background emission from around the source, but equally it may result in confusion from chopping onto extended emission. In some targets, this could be seen in the [CII] line (§4.5).
2.1.2 PACS Photometry
Photometric data were obtained using the fast scanning mode of the PACS imaging photometer, operating at central wavelengths of 70 and 160 simultaneously (and repeated at 100 and 160 in most objects). This technique scans the telescope over the source, using relatively short scan lengths of 3.5 arcmin, and small (4 arcsec) orthogonal steps between each scan. Two scans were performed, at 70 and 110 degrees to the array, to improve the final image fidelity and avoid striping effects in the scan direction. The photometer array field-of-view is 3.51.75 arcmin and, although the resultant image does not have constant signal:noise over the field, the noise level in the central arcsec region varied by less than 20%. The technique was found to be more sensitive than the chop-nod method and in some cases, several objects could be covered in the same field. It also enabled searches for faint companions in the radius range 1500-7000 AU. The required sensitivity for the photometric observations was better than 5mJy rms at 100 and 160, and a factor of lower at 70. Although the FIR continuum flux from disks is dependent on the stellar luminosity and mean disk temperature as well as the dust mass (and may be optically thick), disks of dust mass have IRAS 60 fluxes of typically 1Jy at the fiducial distance of 150 pc. So the survey should detect dust in systems 1-2 orders of magnitude fainter than this. The noise level of the observations was generally close to the original prediction (see Table 1), although in some cases it was limited by galactic background emission at 160.
Although the spectroscopic data could in principle be used to give narrowband continuum fluxes from the line-free parts of the spectra (albeit with a factor of 30 less sensitivity than the full photometry), it was found that the photometric accuracy of these data was lower than the broad-band photometry, and generally they were not used for SED fitting.
2.1.3 Phased survey strategy and data reduction
The spectroscopic observations were carried out in one or more of the wavelength settings in Table 1. Phase I of the project consisted of [OI]63 observations of most targets using grating setting A, concatenated observations of the brightest of targets in settings B-D (in order to reduce spacecraft slew overheads), plus photometry444Some bright targets were dropped from the photometric list, as suitable data was available from other Herschel surveys, e.g. some of the Taurus and ChaII objects were covered by the Goult Belt Survey.. Note that not all objects from the initial survey list were observed in the lines; based on early survey results, a number of targets were dropped as they were deemed too faint in continuum to have likely emission in any line. In addition a few Taurus objects were dropped from both continuum and line observing based on updated re-classification as field stars (Luhman et al., 2009). Phase II of the project consisted of flexible followup of the brightest [OI] targets using grating settings B, C and/or D, as well as some deeper observations of a few individual sources.
During the course of the survey, GASPS photometric and spectroscopic data were reduced using prevailing versions of the standard Herschel data processing pipeline, HIPE (Ott, 2010). This provides calibrated FITS images and datacubes; further photometry and spectroscopic extraction were performed with packages such as STARLINK Gaia. However, the released version of HIPE evolved during the course of the mission and different versions were used to reduce GASPS datasets in different publications, ranging from v2.3 in early data (Meeus et al., 2010) to v7.0 (Riviere-Marichalar et al., 2012a) and v9.0 (Howard et al., submitted). Later HIPE releases generally have improved calibration as well as better flat-fielding, and the complete GASPS survey is to be re-reduced using a single mature version before being made publicly available as a systematically-calibrated dataset. The current work makes use of data extracted from the Herschel science archive during 2012, but the detection statistics presented here are unlikely to change significantly in the final data release.
3 Target selection
GASPS targets were selected from the 7 well-known nearby young star formation regions and associations listed in Table 2 and described in §3.1. The complete target list, with system parameters from the literature, is given in Table A. For completeness, we list all the initial targets in this table, although some were not observed in spectral lines in the final survey (see above). The criteria used to select the targets were:
-
•
Age range 0.3 to 30 Myr. As discussed by several authors (e.g. Hartmann et al. (2001)), stellar ages are uncertain - particularly for Myr - and in these cases it may be better to take the ensemble age for a cluster rather than ages of individual stars. Systems of age 0.3 Myr were considered more likely to include non-disk emission components such as remnant ambient material, infalling envelopes, or energetic outflows (see §4). Those older than 30Myr were expected to have very little circumstellar gas.
-
•
Optically visible stars. This means mostly SED Class II, III, Transition Objects or debris disks. Targets have optical extinctions less than . We avoided embedded objects (i.e. Class 0 - I), because of potential confusion from extended surrounding gas.
-
•
Disk dust masses555Values of were mostly based on published mm wavelength continuum observations, with estimates based on shorter wavelength data in some cases. mostly in the range . Also included were a number of coeval stars with Class III SEDs, or upper limits for of , where the lack of continuum excesses in the IR or sub-mm suggested negligible warm or cool dust. Some of these still had gas accretion signatures and were included as they potentially could be associated with moderate masses of gas. In addition a number of debris disks in the young associations were also observed, with as low as .
-
•
Stellar spectral type A0 through M5. A similar range of stellar spectral types was chosen in each region where possible, although to increase the numbers of early spectral type objects, we also identified a sample of isolated well-studied Herbig AeBe stars with a similar age spread to that of the clusters. The resulting stellar mass range was , based on published HR diagrams.
-
•
Nearby regions, with distances of 180 pc for low-mass and 200 pc for HAeBe stars.
-
•
Low confusion level (from Herschel Confusion Noise Estimator). Confusion noise was 100mJy at 100. This meant that several dense star-forming regions such as Ophiuchus were excluded from the survey.
-
•
Extensive photometric and, in many cases, spectroscopic datasets available at other wavelengths.
-
•
A range of accretion rates (based initially on H equivalent width, EW), X-ray luminosity, and binary separation.
| Group | Distance | Age | Disk fraction1 | GASPS | Notes/Main population |
|---|---|---|---|---|---|
| (pc) | (Myr) | % | targets | ||
| Taurus | 140 | 0.3-4 | 90 | 106 | Class I-III T Tauri stars |
| Cha II | 178 | 2-3 | 75 | 19 | Class II T Tauri stars |
| Cha | 97 | 5-9 | 56 | 17 | T Tauri and debris disks |
| TW Hya | 30-70 | 8-10 | 30 | 13 | T Tauri and debris disks |
| Upper Sco | 145 | 5/11 | 20 | 44 | Class II-III T Tauri stars. |
| Pic | 10-50 | 10-20 | 37 | 18 | Debris disks |
| Tuc Hor | 20-60 | 30 | 26 | 16 | Debris disks |
| HAeBe stars | 20-200 | 0.5-30 | 100 | 24 | Includes debris disks |
(1) Note: disk fractions are based on published photometric excesses. They are the fraction of stars with any measured disk, so include mostly debris disks in the older associations and protoplanetary disks in the younger star forming regions.
3.1 Individual associations
3.1.1 Taurus
The Taurus star formation complex lies at 140 pc with a depth along the line of sight of 20pc (Torres et al., 2009). Taurus contains mostly low-mass stars with an age range of up to 10Myr (Palla & Stahler, 2002; Güdel et al., 2010). Stars in this region have been extensively studied at many wavelengths, and the census of Class 0-II YSOs is essentially complete, with a significant fraction of the Class III YSOs also known (Rebull et al., 2010). Stellar parameters in Table A are from Kenyon & Hartmann (1995) and Kenyon et al. (1998), updated where appropriate by values in Furlan et al. (2006), Güdel et al. (2007) and Rebull et al. (2010), and with disk masses from Andrews & Williams (2005) and Currie & Sicilia-Aguilar (2011).
3.1.2 Cha II
Chamaeleon II is a nearby (178 pc; Whittet et al. (1997)) star forming region included in the Spitzer Legacy cores-to-disks program (Evans et al., 2009) and the Gould Belt key program (André et al., 2010). It contains a lightly clustered distribution of low mass YSOs in a range of evolutionary states with spectral types K–M and ages estimated from protostellar evolutionary tracks of 42 Myr (Spezzi et al., 2008). The GASPS subsample consists of 19 targets from Cha II, generally with infrared colors of Class II objects and/or H equivalent widths indicative of gas accretion. Although there exists no deep sub-mm survey to give disk mass estimates (the survey of Young et al. (2005) only detected DK Cha and possibly IRAS12500-7658, with a dust mass limit on the other objects of ), Alcalá et al. (2008) have estimated masses based on SED fits to far-IR data, and so we give these values (using their D01 models) in Table A. However, it should be noted that these entail higher uncertainties compared with estimates from the sub-mm. Spectral types are from Spezzi et al. (2008) (who cite Hartigan (1993) for SpT), binarity is discussed in Alcalá et al. (2008) and Lx comes from the ROSAT survey of Alcalá et al. (2000).
3.1.3 Upper Sco
The mean cluster age and distance of Upper Sco was estimated as 5 Myr and 145pc by de Zeeuw et al. (1999) although more recent estimates suggest it may be as old as 11Myr (Pecaut et al., 2012), which is consistent with the rather low disk fraction observed. The 8-70 SED has been used to identify disks as Class II, Class III or debris (Carpenter et al., 2009) and these classifications are given in Table A. The disk masses and system parameters are from the sub-mm observations of Mathews et al. (2012) and references therein.
3.1.4 Cha
This is a compact grouping of 19 stars, first identified as a young association through X-ray observations (Mamajek et al., 1999). One of the reasons for interest in this cluster is its’ age, at an estimated 8 Myr, and relatively close distance (97 pc). The disk fraction, based on Spitzer observations at 24 and 70 (Gautier et al., 2008), is 56%, which is relatively large for the age of the association (c.f. Haisch et al. (2001)). A number of the stars are active accretors, and at least two are identified as Class II T Tauri stars (Sicilia-Aguilar et al., 2009). In Table A, spectral types, H EW, and the presence of an infrared excess are based on Sicilia-Aguilar et al. (2009), and information on binarity is from Bouwman et al. (2006). X-ray luminosities are taken from Mamajek et al. (1999) and López-Santiago et al. (2010), and disk mass estimates are mostly based on FIR measurements (Currie & Sicilia-Aguilar, 2011).
3.1.5 TW Hya association
First recognised as a group of nearby young stars by Kastner et al. (1997), the number of members in the TW Hya association (TWA) is now at least 25 (Webb et al., 1999; Mamajek, 2005). It is the closest association with accreting T Tauri stars, and includes two classical T Tauri stars (TW Hya itself, and Hen 3-600), and two bright debris disks (HD 98800, a hierarchical multiple system, and HR4796A). Low et al. (2005) used Spitzer to measure 24 and 70 excesses around TWA members and found these four systems have a 24 excess a factor of 100 larger than the other members. However, several of the other stars also have evidence of dust disks, from weak excesses at longer wavelengths. The age of this system is confirmed at Myr (Barrado Y Navascués, 2006). Parameters in Table A are taken from de la Reza & Pinzón (2004) and Scholz et al. (2007), with disk masses mostly from Matthews et al. (2007). Note that TWA member HR4796A (TWA11) is listed under the HAeBe stars as A-12.
3.1.6 Pic
The moving group associated with Pic was identified by Barrado y Navascués et al. (1999), and membership extended by Zuckerman et al. (2001) and others (see Torres et al. (2008) for a summary). With a derived mean age of 12Myr, and range in distance of 10-50 pc, many of its’ members have been extensively studied over a wide range of wavelengths, including 24 and 70 with Spitzer (Rebull et al., 2008), as well as the submm (Nilsson et al., 2009). The disk fraction is (Rebull et al., 2008), and includes a number of debris disks in addition to Pic itself666 Pic was observed as part of the Herschel GT program ‘Stellar Disk Evolution’ (P.I. G.Olofsson).. Data in Table A are mostly from the above references. Detailed results from GASPS, including model fits to the photometry, have been presented for HD 181327, one of the brightest debris disks in this group, and HD 172555 (Lebreton et al., 2012; Riviere-Marichalar et al., 2012b).
3.1.7 Tuc Hor
This stellar association was first recognised by Zuckerman & Webb (2000) and Torres et al. (2000), who derived an age of 20-40 Myr and distance range of 20-60 pc. No N-band excesses were seen around any stars in Tuc Hor (Mamajek et al., 2004), however, a Spitzer study at 24 and 70 (Smith et al., 2006) showed 5/21 stars with a measurable excess at 70. Zuckerman et al. (2011) subsequently extended the search and found several more stars with IR excesses. All such systems in Tuc Hor are thought to be debris disks, and this is the oldest association in GASPS. The photometric data have been presented in Donaldson et al. (2012).
3.1.8 Herbig Ae Be stars
The survey includes 25 IR-excess stars of spectral types late B to F, improving the statistics at the higher end of the stellar mass range (around 2-4)777Note that the HAe star AB Aur is listed under the Taurus subsample as T-101 in Table A.. This sample also includes some A-type stars with excesses where the classification is less clear: the peculiar Be star 51 Oph (Thi et al., 2005), and 5 systems which may be classified as debris or HAe (including 49 Cet, where the age was recently revised to 40Myr (Zuckerman & Song, 2012)). Like the lower-mass counterparts, the program HAeBe stars are biased toward isolated systems which have published IR excesses and ancilliary data (particularly UV spectra, resolved coronagraphic images and/or millimeter interferometry). HD 97048 - one of the brightest targets in our sample - had prior evidence from ISO of [OI] and possibly [CII] emission (Lorenzetti et al., 1999). The HAe sample includes several disks with large gaps and/or cavities, as well as 2-3 systems with jets. Unlike the T Tauri stars, which are represented in sufficient number to permit statistical evaluation of association ages, the HAe stars represent extremes in stellar and disk properties, and have more uncertain ages except where there are common proper motion late-type companions. Stellar parameters in Table A are mostly taken from Montesinos et al. (2009) and Meeus et al. (2012), with disk masses from Acke et al. (2004) and Sandell et al. (2011). Note that the SED classifications in the Table are different to the T Tauri class, and are based on the mid-IR slope as suggested by Meeus et al. (2001): group I has an SED rising to longer wavelengths in the mid-IR, and group II has a falling SED. Results from the GASPS HAeBe subsample have been presented in Meeus et al. (2012).
3.2 Ancilliary data
Many of the GASPS targets are well-known systems, with photometry in optical through to mid-IR (including Spitzer fluxes at wavelengths as long as 70), and sub-mm (mostly 850). In addition, H or Br line strengths are published for many targets. Derived parameters such as stellar spectral type, Teff, disk dust mass and SED Class are also mostly available, and the most recent published estimates are given in Table A. As part of the GASPS project, we have endeavoured to obtain such data in cases where it is missing, and to make the target sample uniform both in data and in derived parameters. One additional issue is that much of the published photometry is not contemporaneous; in some cases, photometric points in the optical and NIR have been taken 20 years apart. For time-variable objects, SED fitting under these circumstances may be significantly affected, and more recent optical and near-IR photometry is being obtained for a number of the targets in order to improve the reliability of SED fits.
4 Origins of far infrared lines from young stars
At far-infrared wavelengths, common species such as C, O and N have several prominent fine-structure transitions. [OI] lines at 63 and 145 and the [CII] line at 157 are important cloud coolants, on a galactic scale (Stacey et al., 1991), in photodissociation regions (Hollenbach et al., 1991), and in circumstellar disks (Kamp et al., 2003; Gorti & Hollenbach, 2004). In star formation regions, both models and observations indicate that [OI]63 is the single brightest emission line in the FIR/sub-mm. Abundant molecules such as CO and H2O also have numerous rotational lines throughout the FIR with energy levels of a few hundred K, and can trace the ‘warm’ gas components. Other FIR-emitting species such as OH are photodissociation products of H2O, and are therefore predicted to be abundant (Najita et al., 2010). Around individual young stars, FIR lines can arise from several different regions. For example, CO and OH emission from young highly luminous HAeBe stars was thought to arise from dense regions of size (Giannini et al., 1999), but it was unclear whether these were disks or remnant envelopes. Lines are also seen from high-velocity jets and low-velocity photoevaporating disk winds, and the relative contributions of disk, outflow, disk wind, and envelope will depend on the SED class, stellar radiation field, disk structure, mass loss rate and the environment.
The GASPS project involves both in-depth studies of individual targets using multi-wavelength data, as well as a statistical analysis of the full FIR sample. Interpretation of the results generally requires detailed comparison with models and in the following sections, we outline methods of estimating the contributions to the FIR line emission, focussing on Class II-III YSOs, which form the bulk of our targets.
4.1 Disks
Fine structure atomic line emission arises from the surface of disks at AV1 over a wide range of radii, where the stellar UV or X-ray photons ionise the exposed gas to produce a mainly atomic extended disk atmosphere (Meijerink et al., 2008; Gorti & Hollenbach,, 2008; Woitke et al., 2009a). [OI]63 is predicted to be the brightest line from disks at any wavelength, with line luminosities as high as L⊙ from T Tauri systems (Gorti & Hollenbach,, 2008). It becomes optically thick relatively easily, and traces the mean gas temperature on the disk surface rather than the mass directly. FIR molecular lines such as CO and H2O also arise from the warm heated surface of dense disks (Woitke et al., 2009b). However, molecular photodissociation in more tenuous debris disk systems may mean the atomic fine structure lines will dominate the FIR (Kamp et al., 2003; Zagorovsky et al., 2010). Line fluxes depend strongly on the disk structure (for example, a flared disk has a larger exposed surface area, resulting in brighter lines - Jonkheid et al. (2004)), the radiation field from the central star, as well as the details of chemistry and gas/dust ratio in the disk atmosphere. In the following we summarise the methods used for modeling the emission.
4.1.1 Disk modeling
MCFOST and ProDiMo are the two main codes used in GASPS to model the protoplanetary disk structure and appearance. MCFOST is a three-dimensional Monte Carlo continuum and line radiative transfer code (Pinte et al., 2006, 2009). The parametrized input disk density distributions can accomodate structures such as holes, gaps and dust settling. The calculation of the dust temperature and radiation field takes into account non-isotropic scattering, absorption and re-emission based on the local dust properties. The code uses a large variety of grain size distributions and compositions, e.g. porous grains and icy grains. SEDs, thermal and scattered light images, visibilities as well as line emission are derived by a Monte-Carlo method and ray-tracing of the final physical disk structure. ProDiMo is a two-dimensional thermo-chemical disk code that calculates the vertical hydrostatic equilibrium, gas phase (e.g. neutral-neutral, ion-molecule, photochemistry, X-ray chemistry) and gas-grain chemistry (ad- and desorption processes), 2D continuum radiative transfer (with isotropic scattering), detailed gas heating/cooling processes (including X-rays) using 2-directional escape probability, and spatial decoupling of gas and dust (e.g. settling) (Woitke et al., 2009a; Kamp et al., 2010; Aresu et al., 2011; Woitke et al., 2011). The observables derived from the resulting chemo-physical disk structure include SEDs, line fluxes, profiles and images. For optically thin cases such as debris disks, we also use GRaTer, a ray-tracing code incorporating a large variety of grain compositions which fits SEDs, images and interferometric visibilities using parametrized optically thin disk models (Augereau et al., 1999).
For modeling individual sources, grids of MCFOST or GRaTer models were run over a broad parameter space to identify the best fitting dust model, based on SEDs, images and interferometric data when available. MCFOST results were passed to ProDiMo for detailed gas modeling. Examples of this approach are Meeus et al. (2010) and Thi et al. (2010) and for a debris disk, Lebreton et al. (2012). Another approach employs a genetic algorithm minimisation strategy with the ProDiMo models to find local minima in the parameter space constrained by observations. Examples are found in Tilling et al. (2012) and Woitke et al. (2011).
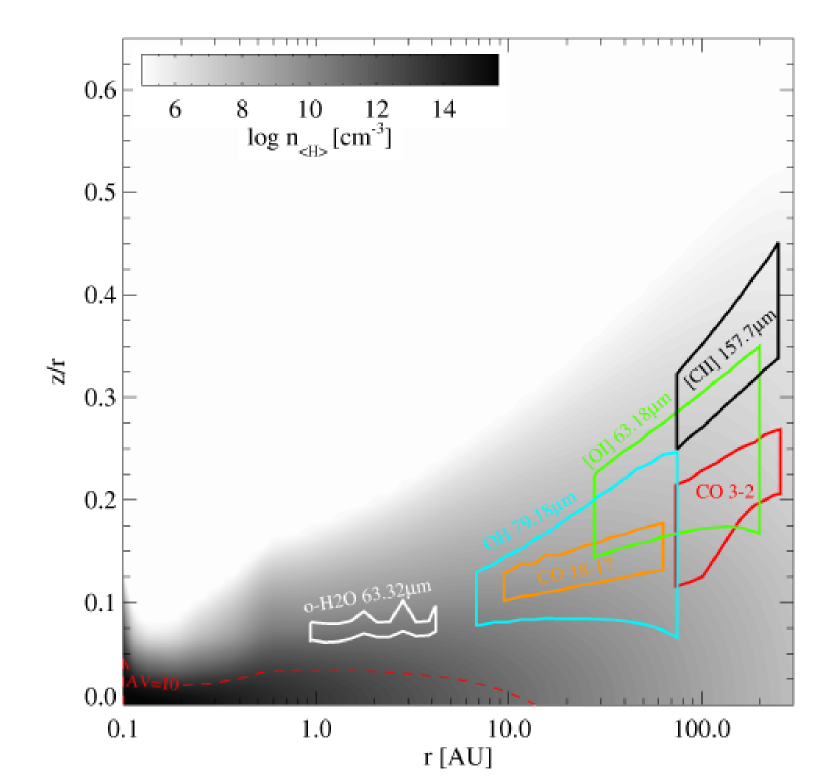
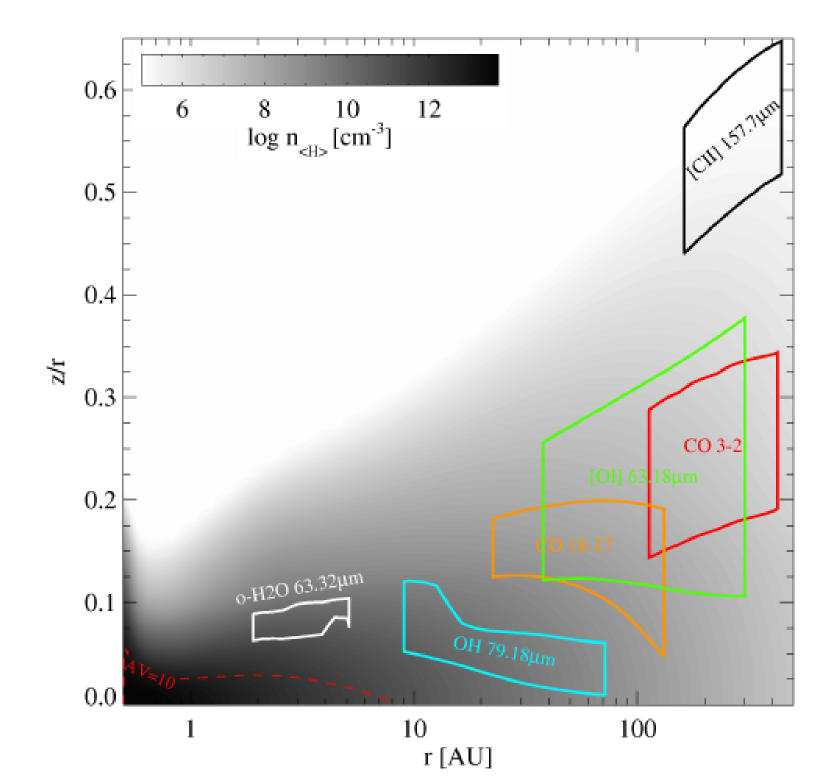
In Figure 1 we use ProDiMo to illustrate the regions where most FIR line emission is expected to arise in T Tauri and HAeBe disks, using the model parameters given in Table 3. Note that these are relatively massive disks - towards the high end of the range of the GASPS sample. For these models we have proscribed the disk vertical struture by the scale height and flaring index. The results indicate that the [OI] lines are seen mostly from the disk surface at 20–200AU radius around a T Tauri star, and a factor of 1.5 further out in the more luminous HAeBe star. The [CII] line comes from the tenuous outer atmosphere at radii 100AU, whereas high-J CO emission (e.g. the J=18-17 line at 144.78) is predicted to arise only from within a few tens of AU for T Tauri disks. The model predicts emission from the 63.3 line of H2O mostly from within a few AU.
| Parameter | T Tauri | HAeBe | Notes |
|---|---|---|---|
| SpT | K4 | A3 | |
| M∗(M⊙) | 1.4 | 2.2 | |
| Teff (K) | 4500 | 8600 | |
| L∗ (L⊙) | 2.0 | 32.0 | |
| T (Myr) | 2.3 | 4.6 | Age |
| fUV | 0.01 | 0 | Additional UV fraction, LUV/L∗ |
| LX (erg/s) | 1030 | 0 | Additional X-ray luminosity |
| Rin (AU) | 0.1 | 0.5 | Set by the grain sublimation radius |
| Rout (AU) | 300 | 500 | Outer disk radius |
| (M⊙) | Disk dust mass | ||
| g/d | 100 | 100 | gas/dust mass ratio |
| 1.0 | 1.0 | Surface density power law exponent | |
| amin/amax () | 0.05/1000 | 0.05/1000 | min/max grain size |
| p | 3.5 | 3.5 | grain size power law |
| fPAH | 0.01 | 0.01 | PAH mass fraction |
| H0 (AU) | 10 | 10 | scale height at 100AU radius |
| 1.1 | 1.1 | disk flaring index |
4.1.2 Model grids
To support a broader statistical analysis of the GASPS data, we have produced a grid of models covering a wide parameter space (Woitke et al., 2010)888The grid was calculated on the FOSTINO computer cluster financed by ANR and operated by SCCI at OSUG.. Stellar masses between 0.5 and 2.5 M⊙ and pre-main sequence evolutionary tracks at 1, 3, 10 and 100 Myr are used to define , and hence L∗. The UV excess, , is treated as a power-law that is added on top of the photospheric spectrum in the wavelength range 912 to 2500 Å. Dust masses range from to M⊙, and the gas/dust mass ratio runs from (10 ISM) to 0.1 (0.001ISM). Geometries include young flaring disks, flat evolved systems, as well as ‘transition’ disks with inner holes up to 100 times the sublimation radius. The grid also contains models with a settled dust distribution, where larger grains have a smaller vertical scale height than smaller ones. The observables calculated from these models include SEDs and integrated line fluxes.
Woitke et al. (2010) show that the fine structure line fluxes of [OI] and [CII] depend strongly on the stellar UV excess and disk flaring. Using the entire grid of parameter space (not folding in the likelihood of these disks occuring in nature) about 70% of the high-mass models (dust mass, M⊙) with a strong UV excess were predicted to be detected in [OI] 63 m line by GASPS, and 55% detected in [CII]157. Without a UV excess, the percentage drops to 30% (14% for [CII]). An initial statistical comparison between the early GASPS line fluxes and the grid (Pinte et al., 2010) shows that some of the disks around low-mass stars () do require additional heating from a moderate UV excess (with ) or X-rays (which were not included in this first grid). However, results from T Tauri disk modeling with stellar X-rays indicate that the [OI] 63 m line flux is only affected by X-ray heating for erg/s (Aresu et al., 2011).
Although most gas emission lines sample a thin, warm surface layer (see Figure 1), combining the FIR data with results from other wavelengths (e.g. the [OI]63µm/CO(2-1) ratio) and with physically-plausible models does allow us to break model degeneracies, giving approximate estimates for gas parameters independent of the dust (Kamp et al., 2011). But it is clear that the reliability of derived values such as the gas mass relies on the accuracy of the models.
4.2 Outflow jets
Highly embedded Class 0-I YSOs are known to have prominent outflows, and early observations using the KAO as well as more recent observations with Herschel/PACS show bright FIR lines around Herbig-Haro objects and high-velocity CO outflow lobes (Cohen et al., 1988; van Kempen et al., 2010). As well as fine structure lines such as [OI]63, many CO and H2O transitions are readily detectable from Class 0-I objects (Lorenzetti et al., 2000; Molinari et al., 2000; van Dishoeck, 2004; Goicoechea et al., 2012). The stars are young (0.1 Myr), optically obscured, embedded in an envelope, and located near dense cloud cores. Their dense environments and high outflow luminosities suggest that the FIR line emission is dominated by outflow shocks (Molinari et al., 2000; Nisini et al., 2000, 2002; Franklin et al., 2008). These shocks also affect molecular abundances, for example, releasing H2O from grains and increasing its gas-phase abundance to as much as - comparable with that of CO (Benedettini et al., 2002). In most cases the FIR lines dominant the shock cooling, and line fluxes may be used to estimate the outflow luminosity (Hollenbach et al., 1985; Nisini et al., 2002; Podio et al., 2012).
Evolved, isolated objects such as optically-visible Class II-III T Tauri stars have mass accretion rates at least 1-2 orders of magnitude lower than Class I objects (Hartmann et al., 1998; Arce & Sargent, 2006), which are themselves an order of magnitude lower than the Class 0 objects (Bontemps et al., 1996; Podio et al., 2012). Class II are pure disk systems, and are generally isolated with no dense ambient gas. Consequently we assume the fraction of outflow luminosity deposited in shocks near the star, , is given by the geometric fraction of the initially broad wind intercepted by the disk. So , where H0 is the scale height (in AU) at 100AU radius. In the same way as embedded objects, the jet mass loss rate can be estimated from the [OI]63 luminosity, by:
where is the fraction of FIR line luminosity in the [OI]63 line, the outflow jet velocity, and the ambient shock velocity (Nisini et al., 2002). For embedded objects the dominant emission is from the integrated CO and H2O lines, thought to be from C shocks, and Goicoechea et al. (2012) finds in the Class 0 YSO Serpens SMM1. In fast dissociative J shocks, [OI]63 emission may dominate the luminosity, and is found to be 0.5 or greater (Podio et al., 2012). Assuming a jet velocity of 100 (Podio et al., 2012), (Nisini et al., 2002), with (Table 3), then the GASPS sensitivity (§2.1.1) may allow the detection of outflow mass loss rates of M⊙/yr for stars at a distance of 140pc. However, if C shocks dominate, the contribution to the [OI] line from the jet may be lower. In Table A, we have indicated the stars with published mass loss rates greater than this value (Hartigan et al., 1995).
Although most are isolated disks, a few of the GASPS targets are somewhat embedded Class II objects and have extended optical jets; for these we may expect some outflow contribution to the FIR lines. The spatial resolution of PACS is modest, but can help investigate this contribution, resolving jets on scales of 1000 AU. For spatially-unresolved outflows the situation is less clear. However, shocked outflow emission may be broadened to 200 km s-1 or velocity-shifted by more than a few tens of km s-1, similar to the high-velocity component seen in optical lines in a few high-accretion objects (Hartigan et al., 1995; Acke et al., 2005). In these cases, the PACS spectral resolution of 88 km s-1 at may also be used to help discriminate between outflow and disk.
4.3 Remnant envelope gas
Low-density PDRs in the remnant envelope gas centred on the stars may contribute to the [CII] flux from some objects, as the [CII]157 critical density is only . To mitigate this, targets were selected to be SED Class II-III with low AV, i.e. optically-visible stars where the envelope mass is at least 1 or 2 orders of magnitude less than the disk mass (Fuente et al., 2002; Arce & Sargent, 2006). The [OI]63 critical density is 100 times higher than [CII], and the mean envelope density is small compared to the disk, so the envelope contribution to the total [OI] flux should be small.
4.4 Disk winds
A photoevaporative UV-driven wind (Pascucci & Sterzik, 2009) will serve to extend the scale height of a disk atmosphere, and may enhance FIR emission lines. The effect of this on the [OI]63 flux is under investigation.
4.5 Extended ambient gas
Observations of star-forming clouds in FIR fine structure lines using the LWS on ISO showed bright emission in regions containing luminous Herbig AeBe and FU Ori stars (Lorenzetti et al., 1999, 2000; Creech-Eakman et al., 2002). The [CII] emission in many of these objects was spatially extended, and commonly the line fluxes at reference positions many arcminutes from the stars were as bright as the on-source position. In these cases, the dominant [CII] source was thought to be extended low-density PDRs, with optical depths of 1-2m (Hollenbach & Tielens, 1997). The GASPS targets were chosen to avoid the densest clouds, and we used the Herschel Confusion Noise Estimator (HCNE) to estimate the continuum confusion noise () for all targets. From this we estimate a [CII] confusion noise level by adopting a ratio of IFW m-2/mJy, found for large-scale Galactic clouds by Shibai et al. (1991). During the course of the survey, 10 objects having a relatively high continuum confusion level (mJy) were observed in [CII] (8 of which were in the Taurus cloud). Based on the HNCE, the predicted [CII] confusion level for these was . An examination of the initial data shows no extended [CII] over the PACS footprint in 9 of these objects, with an rms level of . Either the confusion level is lower than predictions from the HCNE, or the [CII] emission is smooth over the PACS IFU field (arcmin) and emission is being chopped out. One high background confusion source (HD 163296) had evidence of extended [CII] at a level of in the PACS field of view and in the chopped reference beam. From the HCNE, this object has the highest value of in the GASPS sample (85 mJy), which would predict, based on the above ratio, a [CII] confusion noise of , consistent with the observations.
The 100 larger critical density of [OI]63 compared with [CII] implies that extended [OI] emission from diffuse ambient gas is expected to be negligible (Liseau et al., 2006). ISO found that the 63 line flux is mostly higher towards highly luminous YSOs than off-source.
4.5.1 Line-of-sight absorption
As well as emission, dense clouds may have significant optical depth and be self-absorbed in the [OI] line. However, estimates suggest the line optical depth may not become significant until (Liseau et al., 2006; Abel et al., 2007). Moreover the linewidths of the cool line-of-sight clouds are 1 km s-1, small by comparison with the 5-20 km s-1 widths predicted for Keplerian disk emission. Combined with the extinction limit of in the GASPS survey means this effect should be small in most cases.
5 First results
Results from some subsets of the GASPS study have been presented in previous papers. A summary of the ‘science demonstration’ observations of a small number of targets was given in Mathews et al. (2010), and a comparison of these data with a broad grid of disk models was shown by Pinte et al. (2010). More detailed comparisons of the line and continuum data with individual tailored models were carried out based on the detections of [OI]63 in the T Tauri star TW Hya (Thi et al., 2010) and the HAeBe stars HD 169142 (Meeus et al., 2010) and HD 163296 (Tilling et al., 2012) . The T Tauri star ET Cha was detected in both [OI]63 and FIR continuum, and modeling indicates the disk is unusually compact (Woitke et al., 2011). CH+ was detected in one of the brightest targets - the HAeBe system HD 100546 (Thi et al., 2011). An emission line of H2O at 63.3 found in a number of the T Tauri stars indicates warm (500K) H2O, possibly from the inner few AU of the disks (Riviere-Marichalar et al., 2012a). In most of the older gas-poor systems the lines were not detected, however, the far-IR photometry has been used to improve the SEDs and dust modeling (Donaldson et al., 2012; Lebreton et al., 2012).
In the following sections we summarise some of the overall results from GASPS, including identification of the lines found in the survey, and an initial comparison of the spectra of different types of objects (§5.1). In Table A (column 12) we indicate which of the four primary lines ([OI]63, [CII]157, CO J=18-17 and H2O) were observed and detected in the targets. For these purposes, a detection is regarded as 3- above the noise. In §5.2 we give the overall line detection statistics from the survey, and discuss the [OI]63 and [CII] emission characteristics in §5.3 and 5.4. Finally in §5.5, we show the effects of other system parameters on the line detection statistics. It should be noted that these data are mostly based on results from early versions of the reduction pipeline HIPE, consequently the flux calibration and flat-fielding is not finalised and some detections are subject to re-analysis. Final values of the fully-calibrated fluxes and detailed flux correlations will be given in subsequent papers.
5.1 Summary of lines detected
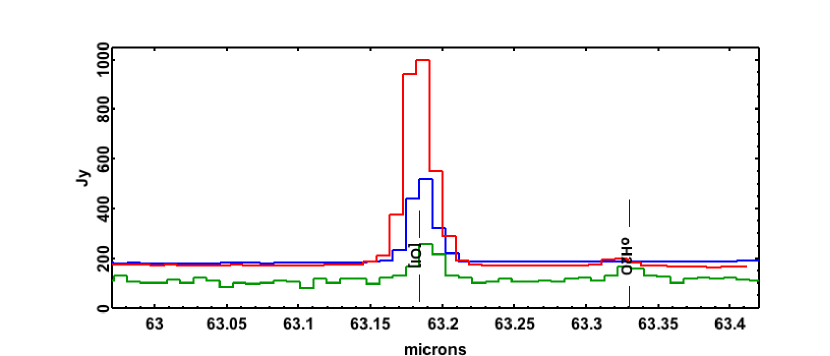
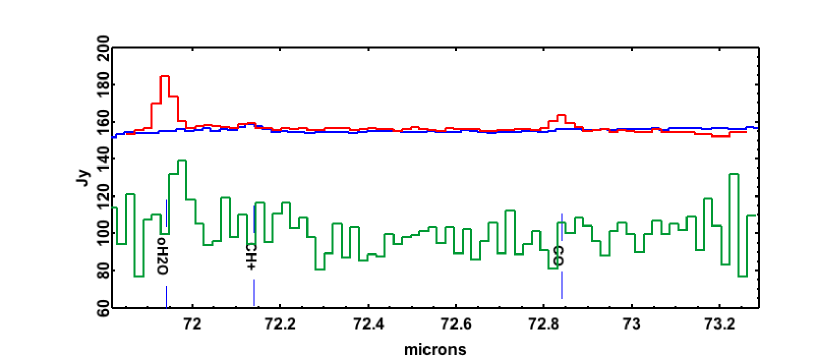
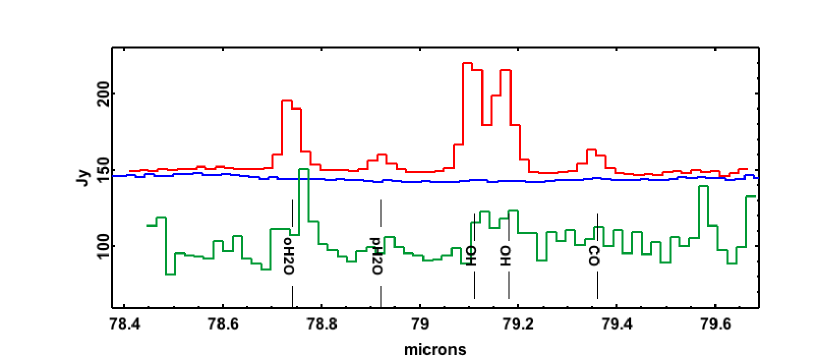
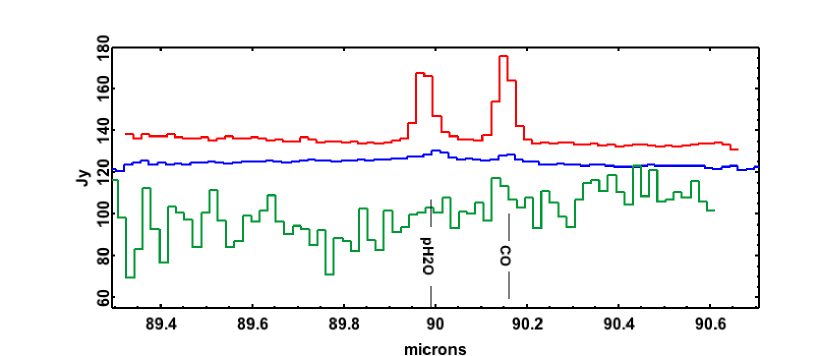
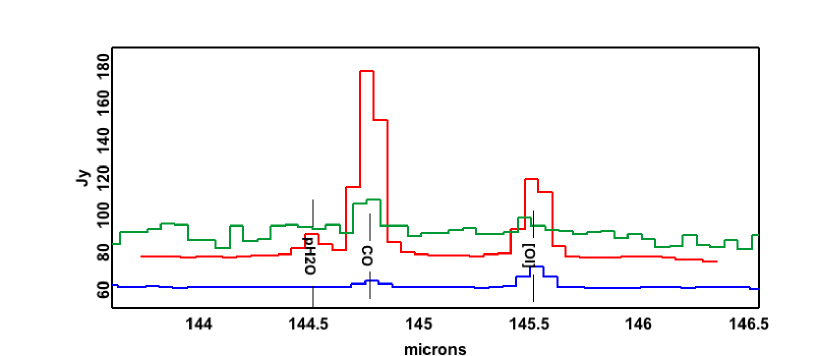
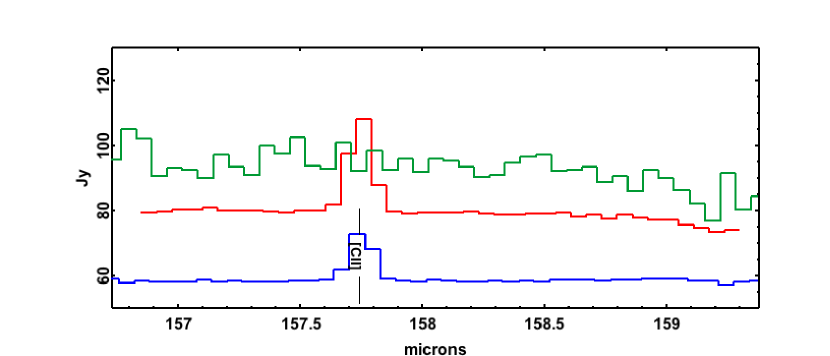
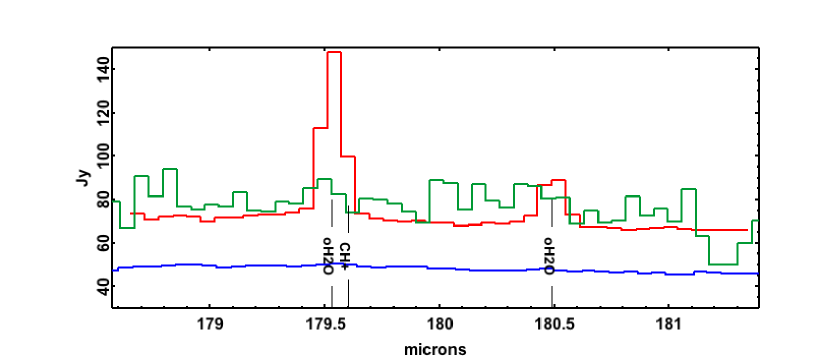
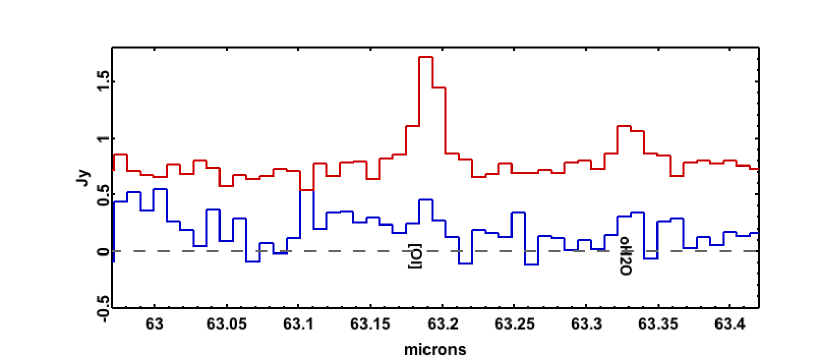
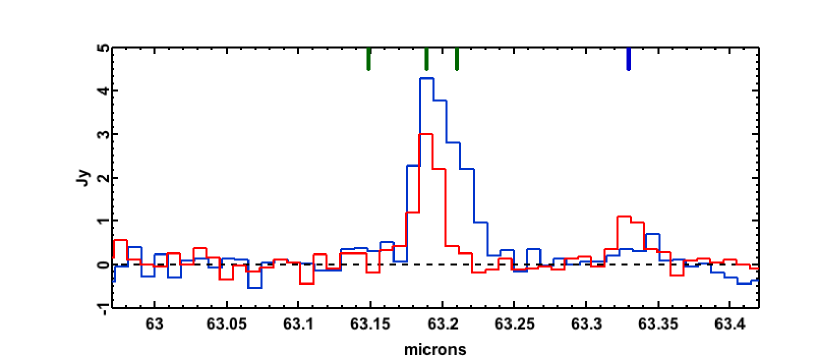
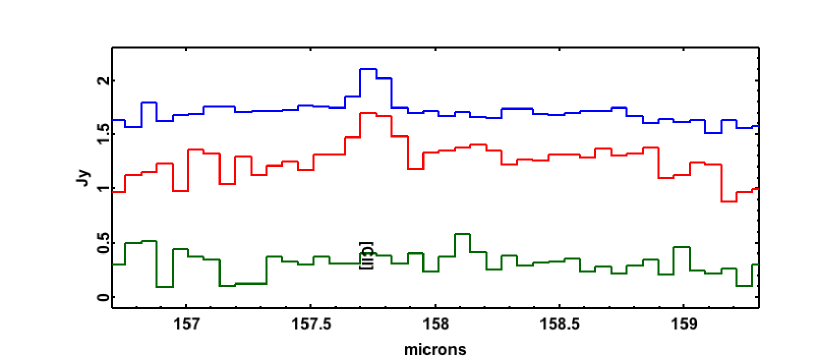
To illustrate and compare the lines detected in the richer GASPS targets, spectra from the central spaxel in three objects from the survey are shown in Figures 2-5 (note that the spectra are scaled to enable comparison in these figures). T Tau (Podio et al., 2012) (shown in red) is a K0V star with a massive disk, compact outflow, some surrounding reflection nebula and possibly a PDR. FIR lines may arise from a mixture of these components, although the molecular transitions seen in the ISO LWS spectra were attributed mainly to shock emission (Spinoglio et al., 2000). HD 100546 (Meeus et al., 2012) (shown in blue) is a young Herbig AeBe star with a bright disk but without a prominent outflow, but which also has a rich FIR spectrum. AA Tau (in green) is perhaps a more typical isolated T Tauri star, with a luminosity of , weak outflow and a relatively massive disk. In Table 4 we identify all the lines observed in these three objects.
Both T Tau and HD 100546 have similar strengths in the fine-structure atomic lines. AA Tau is 200 times weaker, but is detected in [OI] with a comparable line/continuum ratio to the others. However, it shows no evidence of [CII]. In HD 100546, molecular transitions have a line/continuum ratio which is considerably lower than both T Tau and AA Tau. The PACS data cover four transitions of CO: J=18-17, 29-28, 33-32 and 36-35. T Tau shows emission in all four CO lines, and comparison with the CO rotational diagram of Spinoglio et al. (2000) shows that the 3 highest transitions are new detections, requiring an additional hot gas component (K) to account for the emission. AA Tau is detected only in the two lower-level CO lines, most likely because of sensitivity limits.
The OH doublet around 79 is detected in all three sources (Fig. 3). Several H2O lines with upper energy levels from 115-1300K are seen towards both T Tau and AA Tau, and in AA Tau, H2O is the only line detected, other than [OI]63, CO and OH. By contrast, HD100546 has no clear evidence of H2O emission, although other lines (atomic species, OH and CH+) are relatively bright. The highest energy level H2O transition covered by GASPS is the ortho 818 - 707 line at 63.3 (Figure 2); this was detected in T Tau, AA Tau and several other T Tauri stars (Riviere-Marichalar et al., 2012a). Finally, both HD 100546 and T Tauri show clear CH+ emission at 72.14, with possible blends of CH+ and H2O around 90.0 and 179.5; this species was also identified at several other wavelengths in HD 100546 (Thi et al., 2011).
| Wavelength | Line ID | Transition | Eupper | HD100546 | T Tau | AA Tau |
|---|---|---|---|---|---|---|
| () | (K) | |||||
| 63.18 | [OI] | 3P1-3P2 | 228 | X | X | X |
| 63.33 | o-H2O | 818 - 707 | 1293 | … | X | X |
| 71.94 | o-H2O | 707 - 616 | 685 | … | X | X |
| 72.14 | CH+ | J=5-4 | 600 | X | … | … |
| 72.84 | CO | J=36-35 | 3700 | … | X | … |
| 78.74 | o-H2O | 423 - 312 | 432 | … | X | X |
| 78.92 | p-H2O | 615 - 524 | 396 | … | X | … |
| 79.11/79.18 | OH | 1/2 - 3/2 hfs | 182 | X | X | X |
| 79.36 | CO | J=33-32 | 3092 | X | X | … |
| 89.99 | p-H2O | 322 - 211 | 297 | (blend with CH+) | X | … |
| 90.02 | CH+ | J=4-3 | 297 | X | … | … |
| 90.16 | CO | J=29-28 | 2400 | X | X | X |
| 144.52 | p-H2O | 413 - 322 | 396 | … | X | … |
| 144.78 | CO | J=18-17 | 945 | X | X | X |
| 145.52 | [OI] | 3P0 - 3P1 | 326 | X | X | … |
| 157.74 | [CII] | 2P3/2 - 2P1/2 | 91 | X | X | … |
| 158.31 | p-H2O | 331 - 404 | 410 | … | … | … |
| 179.53 | o-H2O | 212 - 101 | 115 | (blend with CH+) | X | … |
| 179.6 | CH+ | J=2-1 | 114 | X | … | … |
| 180.49 | o-H2O | 221 - 212 | 194 | … | X | … |
5.2 Primary line detection statistics
Column 12 of Table A shows whether each of the four primary species ([OI]63, [CII]157, CO J=18-17 and H2O 63.3) were detected in the GASPS targets. Based on this, the overall detection statistics are given in Table 5. As noted above, observations of the range-scan observations were normally only performed if a target was already found or expected to be detected in [OI]63, so the detection rates of [OI]145, [CII] and CO in this table are biased towards those with known [OI]63 emission. Of targets observed in multiple lines, only one remained undetected in [OI]63 yet shows emission in one of the other lines. Based on this result and our modeling, it is thought unlikely that a significant number of the [OI]-unobserved objects would show emission in these other lines. The H2O rates are the fraction of targets seen at 63.3, which was observed as part of the [OI]63 line-scan observations. The CO rates are the fraction of targets detected in the brightest line covered by GASPS (CO J=18-17).
The main similarities and differences between line emission from the two types of objects are:
-
1.
Of the sample of 164 objects observed in spectroscopy at 63, approximately 49% were detected in [OI].
-
2.
A biased subset of the brighter objects from (1) were observed in [OI]145, [CII]157 and CO J=18-17, and the detection rates in this subset were 25-40% in each of these lines. Assuming that [OI]63 is always the easiest to detect (see above), then an unbiased sample of all 164 targets from (1) would have had a detection rate of 14% in these other lines.
-
3.
All HAeBe stars were detected in [OI]63 - a significantly higher detection rate than T Tauri systems. (Note that the statistics of HAeBe stars in Table 5 include 5 known A-star debris disks).
-
4.
The [OI]145 detection rate is a factor of 2 higher in the T Tauri stars observed compared with HAeBe systems. This may reflect a higher [OI] 63/145 line ratio in HAeBe disks.
-
5.
The [CII] detection rate is similar (26%) in both T Tauri and HAeBe stars. If this is envelope material (see §5.4), it indicates that compact envelopes of atomic gas can be maintained around both high and low-luminosity stars. Note, however, that in some cases the [CII] emission may be confused by ambient gas.
-
6.
One (possibly two) HAeBe stars were detected in H2O. Although in the small number regime, the H2O detection rate is formally similar to that of T Tauri systems. However, considering the HAeBe’s are relatively bright in continuum compared with the T Tauri sample, this suggests that, on average, HAeBe systems are weaker in H2O compared with T Tauri systems.
-
7.
The fraction of objects with detectable warm CO (based on the J=18-17 transition) is similar (40%) in disks around both types of stars.
| [OI]63 | [OI]145 | [CII]157 | H2O(63) | CO 18-17 | |
|---|---|---|---|---|---|
| Total | 80/164 | 24/61 | 19/72 | 12/164 | 24/58 |
| HAeBe stars1 | 20/25 | 5/23 | 6/25 | 2/25 | 10/24 |
| T Tauri stars2 | 60/139 | 19/38 | 13/47 | 10/139 | 14/34 |
(1) Includes 5 young A stars classed as debris disks.
(2) This includes all stars observed which were not part of the HAeBe group.
5.3 [OI] line emission
As is clear from the example spectra, [OI]63 is normally several times brighter than any of the other FIR lines observed by GASPS, with an overall detection rate in the survey of 49%. In most cases, it is the best tracer (in the far-IR) of whether gas is present. This is true for almost all GASPS sources. To help understand the origin of the emission we can look at the data in more detail.
Most objects were unresolved in both line and continuum emission. An example is AA Tau (Figure 6), where the ratio of flux in the centre to average of adjacent spaxels is 20. This is consistent with an unresolved source, where we would expect the adjacent pixel average to be a few % of the centre, given an inter-spaxel spacing of 9.4 arcsec, a PSF Gaussian equivalent width of 5.4 arcsec at 63, the asymmetric sidelobes from PACS of a few percent, and taking into account possible pointing uncertainties of a few arcsec in some datasets (PACS User Manual, 2011). This lack of extended emission indicates a line emitting region of radius .
For a number of individual unresolved objects with low accretion rates and no evidence of outflow we have assumed a disk origin, and combined the [OI] fluxes with data at other wavelengths to estimate disk properties. Initial ProDiMo models of the relatively large disk in TW Hya (several 100AU radius) indicate a gas mass of a few with gas:dust ratio a factor of 10 lower than the ISM value (Thi et al., 2010), although some models suggest the gas mass an order of magnitude larger, with a more ISM-like gas:dust ratio (Gorti et al., 2011). ET Cha, by contrast, has a compact disk of modeled radius of only 10AU, a low dust mass of a few and gas mass of a few (Woitke et al., 2011), suggesting either the gas/dust ratio is enhanced or there may be another contribution to the line flux. The HAeBe stars HD 169142 and HD 163296 both show emission consistent with disks and ISM-like values of the gas/dust ratio (Meeus et al., 2010; Tilling et al., 2012).
5.3.1 Spatially and spectrally resolved [OI]63 emission: outflow jets.
Although most objects in GASPS remain unresolved by PACS, five targets (identified in Table A) in Taurus were found to have clearly extended [OI]63 emission along known optical jets (Podio et al., 2012). Two of these also have broad line profiles in the centre. Figure 7 compares the spectrum of one example (RW Aur) with the unresolved line from AA Tau (in red), revealing a prominent red-shifted wing in RW Aur extending as much as +200 km s-1 from the stellar velocity. By contrast, AA Tau has emission centred at the stellar velocity, with a fitted linewidth of 93 km s-1 (FWHM) - similar to the measured PACS resolution of 88 km s-1 at this wavelength (see PACS User Manual). The optical [OI] 6300Å line from RW Aur is known to originate from highly-excited gas in a jet of length a few arcsec (Melnikov et al., 2009), and the line profile is dominated by three components (marked in Figure 7), two at high velocities (+100 and -190 km s-1) and one at the stellar velocity (Hartigan et al., 1995). The brighter red-shifted optical component corresponds with the [OI]63 wing, suggesting this is also from the shocked outflow gas (see §4.2). However, the FIR line profile is dominated by emission centred approximately on the star, whereas this velocity component in the optical line is relatively weak (Hartigan et al., 1995). This low-velocity gas may be from the disk or disk wind (see above).
In the GASPS data we have also identified five other objects with evidence of either broadened lines or spatially-extended [OI]63 emission: HL Tau and XZ Tau (in the same PACS field), DO Tau, UZ Tau and DK Cha (for the latter source, see van Kempen et al. (2010)). All targets resolved in [OI] are identified in Table A by the note ‘ext.OI’, and it is likely that [OI] emission is dominated by outflow gas in these cases.
5.3.2 Objects with uncertain origin of [OI]63
In addition to the 10 resolved objects above, a further 17 objects (noted as ‘jet’ sources in Table A) were identified as having published evidence of a high-velocity jet or outflow by Kenyon et al. (2008), Podio et al. (2012) and Howard et al. (submitted). These are sources with a jet imaged in optical lines, a high velocity molecular outflow, or a broad (50 km s-1), typically blue-shifted, emission line profile in [O I] 6300Å (see e.g. Hartigan et al. (1995)). Three of these were HAeBe stars (HD 163296, MWC480 and HD 100546), leaving 14 T Tauri ’jet’ sources. As noted in §4.2, the survey sensitivity should allow us to detect [OI]63 emission from outflows shocks with mass loss rates M⊙/yr. Estimates from Hartigan et al. (1995) suggest that 4 of the jet sources in the Taurus sample have mass loss rates exceeding this limit (indicated in Table A by the note ’high ’). However, their [OI]63 emission is neither spatially nor spectrally extended in the PACS data. This suggests that the outflow shock contribution may be small compared with the low-velocity gas, and the origin of the unresolved [OI]63 emission in these remaining ’jet’ sources is not clear from the PACS data alone.
5.4 [CII] emission
The detection rate of [CII]157 in the survey was relatively low. For example, neither of the disks around AA Tau and HD 135344 were seen, yet both of these are among the most massive disks in the survey (total masses of ), with relatively rich spectra at other wavelengths. Woitke et al. (2010) predicted that the [CII] disk detection rate for Herschel/GASPS, assuming a wide range of grid parameters, should be 10 – 55%, and would be highly dependent on the UV excess (§4.1.2). Table 5 indicates a detection rate at the low end of this range: the brightest 44% of [OI]-detected objects were targetted for [CII] and of those, only 26% were detected in [CII]. This might indicate that the low-UV models are more applicable to the sample. However, this is not supported by the [OI] detection rates, which are more consistent with moderate UV excesses (§5.5.1). Further investigation of this discrepancy is warranted.
A few objects showed extended [CII], or evidence of emission from the chop reference position, but in general problems from such confusion were limited (§2.1.4). There were, however, clear cases of both high and low-mass objects with [CII] emission centred on the star, examples being UY Aur and HD 100546. Figure 8 compares the spectra of UY Aur from the central spaxel with the middle ring of 8 and the outer 16 spaxels in the PACS IFU. Both line and continuum are centrally peaked, with average fluxes consistent with the instrumental PSF (11 FWHM) at 157. However, published coronograph images shows that these objects also have scattered light extending over 5-10arcsec (Hioki et al., 2007; Ardila et al., 2007) with a complex scattering morphology. This is larger than typical disk sizes and suggests emission may be from a compact envelope. The origin of the [CII] line in these objects and whether it arises from the disk, compact envelope or unresolved outflow is underway. But it suggests that the [CII] detection rate from the disks themselves might be even lower than indicated in Table 5.
5.5 Effect of system parameters on line detectability
The GASPS target list (Table A) comprises a rich sample of Class II-III objects in the 0.3-30 Myr age range, and the survey detects [OI]63 from half of the targets observed. In the following, we investigate preliminary trends in line detectability vs. other directly-observed parameters. Results from GASPS papers on the individual associations (both published and in preparation) are combined to look at overall detection statistics. A minimum detection limit is 3 and, although these were not all reduced with the same version of HIPE, the criteria for detection/non-detection is considered robust in this study. A more detailed investigation of correlations of line fluxes using systematically-calibrated data obtained from the same software version is left for a later paper.
5.5.1 Disk dust mass and [OI] detections
The probability of [OI] detection in the GASPS survey is a strong function of the disk dust mass, . This is illustrated in Figure 9, as a histogram of the detection rates as a function of distance-normalised dust mass, , where is the distance in pc. In this figure, we normalised the mass to an equivalent object giving the same flux at the distance of Taurus. We almost always detect the [OI]63 line when reaches a threshold of : 8410% of targets were detected above this mass (where the uncertainty is the statistical error). This is comparable with the mass detection limit of sub-mm continuum surveys (e.g. Andrews & Williams (2005)), assuming a standard mass opacity, . Assuming also an ISM-like gas/dust ratio can be used for all disks, this implies a total mass detection threshold for [OI]63 of . If the gas:dust ratio is more typically 10 lower (as has been suggested for TW Hya), then the [OI] observations are detecting disks with total masses . As noted in §5.3.1, some [OI]63 emission can be from outflows; on the plot we indicate in yellow the targets with spatially or spectrally-resolved [OI]. Additional targets (shown in green shading) are those with published evidence of a high-velocity jet, although the contribution of this to the [OI]63 emission flux is unclear (see §5.3.2).
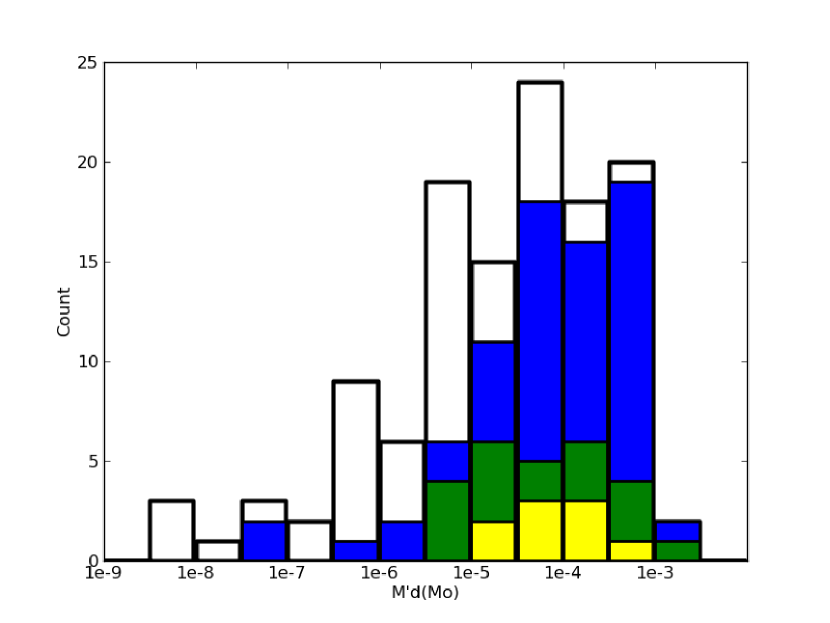
The 84% detection rate for systems of drops to 3212% for . Woitke et al. (2010) constructed a large grid of disk models covering a parameter space similar to the that of the GASPS sample, and predicted overall [OI]63 detection rates of 51-70% for disks with dust masses of in systems with a high UV excess, and 17-30% for this mass range in the case of low UV. Restricting the model grid of citetWoit10 to systems with , we find that the observed 84% detection rate is achieved for moderate UV excesses () and disk flaring (). This suggests these ranges are typical of most systems in the survey.
There are some notable exceptions to the mass detection threshold, where we detected [OI] in systems with :
-
•
HD 172555, an unusual warm debris system with no evidence of molecular gas in mm lines, but with some indication that [OI] may be secondary gas released in collisions (Riviere-Marichalar et al., 2012b).
-
•
ET Cha, an apparently compact disk in the relatively old Cha association (Woitke et al., 2011).
-
•
J130521.6-773810, although the classification of this target in ChaII is uncertain.
-
•
51 Oph, a warm compact disk with notable hot and compact molecular gas component (Thi et al., submitted).
-
•
HD141569, a diffuse disk with spiral structure around a HAeBe star (Clampin et al., 2003).
The number of disks with published dust masses as low as is relatively small (only 10 in GASPS have measured values), and further mm-wavelength measurements of such disks would be interesting to improve the statistics. At the opposite extreme, three relatively massive disks () have no evidence of [OI]63: GO Tau, V836 Tau and TWA03. Woitke et al. (2010) indicate that disks of this mass which have low flaring () can have [OI]63 fluxes too low to be detected by GASPS.
5.5.2 Dependence on spectral type
It is already clear from Table 5 that [OI]63 is significantly easier to detect around HAeBe stars than T Tauri stars. Is this simply because HAeBe disks in the sample are more massive and the detection threshold is more commonly reached? Figure 10 shows the distribution of normalised disk dust masses () in GASPS as a function of stellar Teff. Systems detected in [OI] and [CII] are indicated by the filled black and red symbols respectively. This shows that both early and late-type stars have a similar range of disk dust masses in this sample. As noted above, the [OI] detection rate is high for disks with , and Figure 10 shows that this is independent of Teff for TK. However, approximately half of the low-luminosity stars (T, or M type) with in the range to were not detected. Clearly the spectral type has some effect on the [OI] line emission threshold for the lowest-luminosity stars.
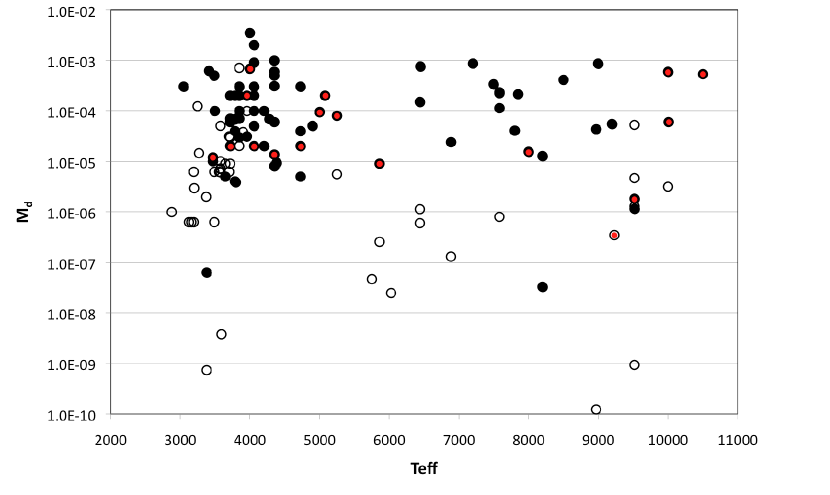
In the case of the [CII]157 line, the detectability in Figure 10 seems to be independent of the spectral type and disk mass, with [CII] detections (shown as filled red symbols) broadly distributed over the – Teff parameter space. Unlike [OI], there is no clear threshold with disk mass, or an increase in detection rate among HAeBe stars. If most [CII] arises from a compact envelope rather than the disk, this suggests that such gas may be retained around these stars independent of the mass of the inner disk or stellar type.
5.5.3 Other observational parameters: binarity, H and X-ray luminosity
The histograms in Figure 11 and 12 show the detection statistics for targets searched in [OI]63 with published X-ray luminosity, H equivalent width (EW) and binary separation. The numbers of targets with [OI] detections are shaded. Those which have additional extended [OI]63 emission from a jet are shaded yellow. Figure 11a shows that line emission is detected in systems covering the full range of X-ray luminosity in the survey, with no clear trend of increased detectability for higher X-ray fluxes. The H EW used in Figure 11b is linked with the accretion rate, although later-type K stars may have significant chromospheric contribution and the accretion luminosity may be lower than Figure 11b might suggest. But there is a trend of increasing [OI] detection probability for higher accretion rates: including all stars observed, the detection fraction is 70% for EWÅ (or 67% excluding the stars with extended jet emission) compared with only 29% for those with lower EW. A systematic derivation of accretion luminosity and line flux over the whole survey would be interesting to study further correlations between the [OI]63 flux and accretion rates.
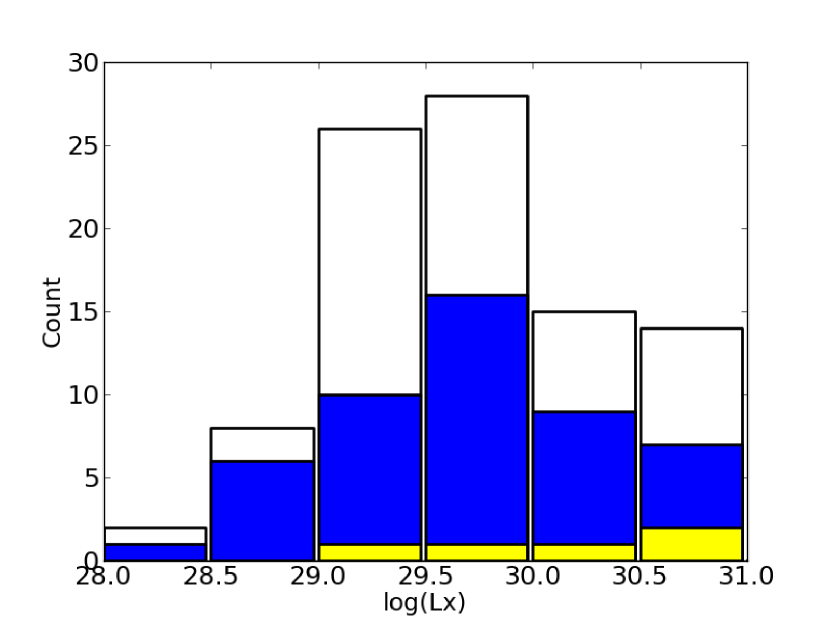
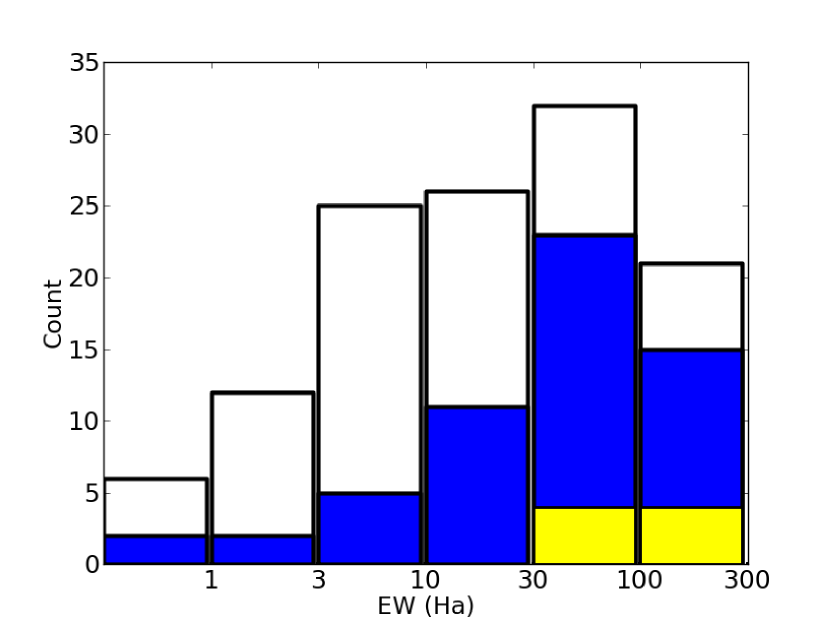
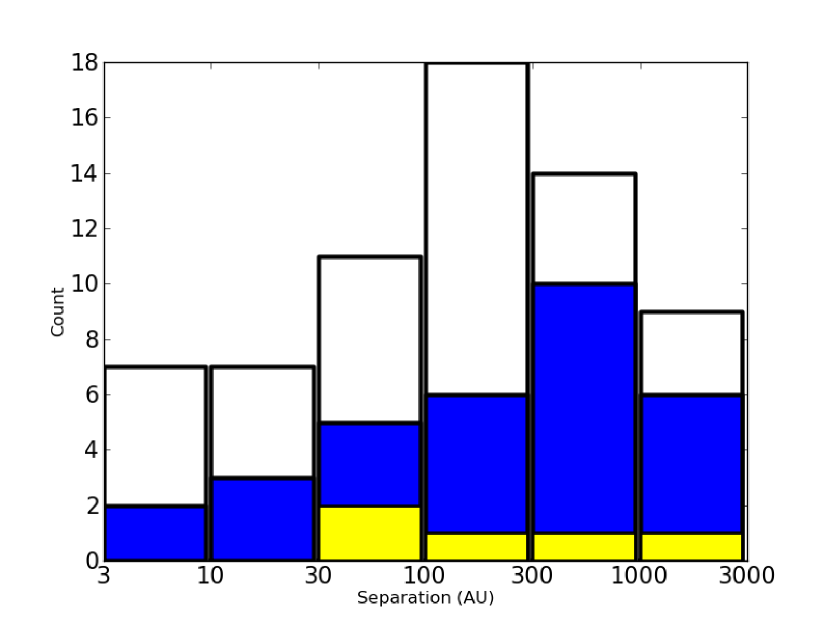
Figure 12 illustrates the [OI] detection rates distributed over binary separation. For hierarchical multiples we have used the separation of the widest component within the PACS beam. There is marginal evidence for a drop in detection rates in multiples of separation 300AU, from 64% for the wider binaries to 40% for the closer systems (with statistical errors of 10%). By comparison, the [OI] detection fraction of single stars in the sample was 47%. This would suggest that most [OI] emission arises from radii of 300AU - similar to the [OI]-emitting region suggested by the models in Figure 1. By comparison, samples of T Tauri stars observed in mm dust indicate that Md typically drops by a factor of 5 for binary separations of 300AU (Harris et al., 2012).
5.5.4 Detection rates in different associations and dependence on age
In Table 6 we give the [OI]63 detection rates for the different associations observed in GASPS, for targets with and without published dust masses (with masses based on continuum photometry, although only two disks were detected which had no published estimates). As noted above, the required dust mass () for [OI]63 to be detected at a distance of 140pc is , or a total (gas+dust) mass of assuming an ISM gas/dust ratio. The detection rates are somewhat dependent on spectral type (M stars have a higher disk mass threshold for detection - see Figure 10), binarity (lower for separations 300AU), and accretion rates (more for HÅ). However, if we use [OI]63 detections as a proxy for 1 disks at the fiducial 140pc distance, it is possible to compare the detection rates in different associations, modulo the distances and assuming we are sampling most of the brighter detectable disks. Each of the three intermediate-age (5-10Myr) associations ( Cha, TWA and upper Sco) has 2-3 such disks. TWA is significantly closer, and only one of these would be detected by GASPS if moved to the fiducial distance of 140pc. The total number of stars in the upper Sco group is 200 (Carpenter et al., 2009), with 20-50 in the two other associations in this age range (Torres et al., 2008), giving a gas-detected disk fraction of 1-7% at 5-10Myr. For the older systems, there are 2 unusual [OI]-emitting disks in the 10-20Myr Pic moving group but neither would have been detected at 140pc, and no disks were detected in [OI] in the 30-Myr old Tuc Hor association. Each of these contains 40 stars (Torres et al., 2008). For the two younger groups, the detection rate in GASPS was 50%, however, the total number of stars is estimated to be 250 in Taurus and 48 in Cha II (Rebull et al., 2010; Alcalá et al., 2008), giving massive disk fractions of 18 and 17% respectively. For the HAeBe stars in the sample (excluding debris disks), the derived ages are mostly in the range 2-10Myr (Montesinos et al., 2009; Meeus et al., 2012), and the [OI] fraction is 100%, much higher than the equivalent-aged FGKM star. While not a statistically-complete sample of AeBe stars in this age range, it suggests either that these more luminous stars are more commonly able to retain disks, or that their ages are overestimated. Overall, for T Tauri stars the fraction with Jupiter-mass, gas-rich disks is 18% at ages of 0.3-4Myr, 1-7% at 5-10Myr, and none are detected beyond 10Myr age. It is unclear why some particular stars can retain these gas-rich disks for up to 10Myr, and whether planets formed in such long-lived disks would be different from those around other stars.
| Md | No Md1 | Total | ||||
|---|---|---|---|---|---|---|
| Association | Detected | Observed | Detected | Observed | Detected | Observed |
| Taurus | 44 | 56 | 1 | 17 | 45 | 73 |
| Cha II | 7 | 17 | 1 | 2 | 8 | 19 |
| Cha | 2 | 7 | 0 | 6 | 2 | 13 |
| TW Hya | 3 | 5 | 0 | 3 | 3 | 8 |
| Upper Sco | 2 | 7 | 0 | 12 | 2 | 19 |
| Pic | 1 | 4 | 0 | 1 | 22 | 6 |
| Tuc Hor | 0 | 2 | 0 | 0 | 0 | 2 |
| HAeBe stars | 20 | 253 | 0 | 0 | 20 | 20 |
(1) No disk masses were available from the literature.
(2) Includes detection of Pic itself (Brandeker et al., 2011).
(3) 5 non-detected systems are those classed as possible debris disks.
6 Conclusions
In this paper we describe the GASPS far-infrared survey of gas and dust in young stellar systems. This Herschel Key Project observed selected lines and continuum with the PACS instrument, targetting 250 young SED-Class II-III systems, Herbig AeBe stars and young debris disks. The far-IR line emission can arise from the hot surface of gas disks around 30-300AU, high-velocity jet shocks, disk winds and/or compact remnant envelopes. We outline the models used to predict disk line strengths and their dependence on disk parameters, and look at the possible emission from these other mechanisms, in particularly from extended outflow jets in a few objects. The master list of targets with basic system parameters is presented, and we also indicate in this list which objects have detections in the primary GASPS lines.
The FIR lines are identified and we show preliminary line detection statistics, referring to the published papers which analyse individual sources and associations in more detail. Rich spectra were seen in a number of sources, including fine-structure atomic lines of [OI] at 63 and 145, and [CII] at 157, as well as molecules including high-J transitions of CO, H2O, OH and CH+. In most systems [OI]63 was the brightest line, by a factor of 10, and is associated in most cases with disk emission. Line and continuum emission was, in all but 10 systems, both spatially and spectrally unresolved and centred on the star. For the extended sources, emission is thought to arise from jet shocks, along with a disk contribution. The [CII]157 line was significantly weaker than [OI], resulting in a relatively low detection rate. However, in a small number of objects unresolved emission was found centred on the star, and may arise from a compact remnant envelope.
49% of all targets observed were detected in [OI]63, with an 84% detection rate for those having disk dust masses of . Comparison with statistics from a grid of model implies that most systems have moderate UV excesses and disk flaring. Assuming an ISM gas:dust ratio of 100 and typical mm-wavelength mass opacity, this represents an [OI] detection threshold for the total disk mass of . Going against this trend, we find five unusually low disk mass systems with [OI]63 emission, and a few high-mass systems which remained undetected. The [OI]63 detection rates were independent of X-ray luminosity, but there was evidence of a decreased rate in binaries of separation 300AU, in stars with H EW 30Å, and for M-type stars. Based on [OI]63 line detections, the results show that 18% of stars in each association can retain gas-rich disks of minimum mass for up to 4Myr, a few % of stars keep these disks for 5-10Myr, but none are detected beyond 10-20Myr.
7 Acknowledgments
We wish to acknowledge the Herschel Helpdesk for their timely and useful responses. The Grenoble group thanks ANR (contracts BLAN-0221, 0504-01 and 0505-01), European Commission’s 7th Framework Program (contract PERG06-GA-2009-256513), CNES, and PNPS of CNRS/INSU, France for support. PW, IK, and WFT acknowledge funding from the EU FP7-2011 under Grant Agreement nr. 284405. WFT acknowledges a Scottish University Physics Alliance fellowship (2006-2009). PACS has been developed by a consortium of institutes led by MPE (Germany) and including UVIE (Austria); KU Leuven, CSL, IMEC (Belgium); CEA, LAM (France); MPIA (Germany); INAF-IFSI/OAA/OAP/OAT, LENS, SISSA (Italy); IAC (Spain). This development has been supported by the funding agencies BMVIT (Austria), ESA-PRODEX (Belgium), CEA/CNES (France), DLR (Germany), ASI/INAF (Italy), and CICYT/MCYT (Spain).
Facilities: Herschel.
References
- Abel et al. (2007) Abel, N. P., Sarma, A. P., Troland, T. H., & Ferland, G. J. 2007, ApJ, 662, 1024
- Acke et al. (2004) Acke, B., van den Ancker, M. E., Dullemond, C. P., van Boekel, R., & Waters, L. B. F. M. 2004, A&A, 422, 621
- Acke et al. (2005) Acke, B., van den Ancker, M. E., & Dullemond, C. P. 2005, A&A, 436, 209
- Alcalá et al. (2008) Alcalá, J. M., Spezzi, L., Chapman, N., et al. 2008, ApJ, 676, 427
- Alcalá et al. (2000) Alcalá, J. M., Covino, E., Sterzik, M. F., et al. 2000, A&A, 355, 629
- André et al. (2010) André, P., Men’shchikov, A., Bontemps, S., et al. 2010, A&A, 518, L102
- Andrews & Williams (2005) Andrews, S.M. & Williams, J.P. 2005 ApJ, 631, 1134
- Arce & Sargent (2006) Arce, H. G., & Sargent, A. I. 2006, ApJ, 646, 1070
- Ardila et al. (2007) Ardila, D. R., Golimowski, D. A., Krist, J. E., et al. 2007, ApJ, 665, 512
- Aresu et al. (2011) Aresu, G., Kamp, I., Meijerink, R., et al. 2011, A&A, 526, A163
- Augereau et al. (1999) Augereau, J. C., Lagrange, A. M., Mouillet, D., Papaloizou, J. C. B., & Grorod, P. A. 1999, A&A, 348, 557
- Barrado y Navascués et al. (1999) Barrado y Navascués, D., Stauffer, J. R., Song, I., & Caillault, J.-P. 1999, ApJ, 520, L123
- Barrado Y Navascués (2006) Barrado Y Navascués, D. 2006, A&A, 459, 511
- Benedettini et al. (2002) Benedettini, M., Viti, S., Giannini, T., Nisini, B., Goldsmith, P. F., Saraceno, P. 2002 A&A, 395, 657
- Boissier et al. (2011) Boissier, J., Alonso-Albi, T., Fuente, A., et al. 2011, A&A, 531, A50
- Bontemps et al. (1996) Bontemps, S., Andre, P., Terebey, S., Cabrit, S., 1996, A&A, 311, 858
- Borucki et al. (2011) Borucki, W. J., Koch, D. G., Basri, G., et al. 2011, ApJ, 736, 19
- Bouwman et al. (2006) Bouwman, J., Lawson, W. A., Dominik, C., Feigelson, E. D., Henning, T., Tielens, A. G. G. M., & Waters, L. B. F. M. 2006, ApJ, 653, L57
- Brandeker et al. (2011) Brandeker, A., ”Stellar Disk Evolution”, H. G. K., & Olofsson, P. 2011, AAS/Division for Extreme Solar Systems Abstracts, 2, 3802
- Bryden et al. (2009) Bryden, G., et al. 2009, ApJ, 705, 1226
- Carpenter et al. (2009) Carpenter, J. M., et al. 2009, ApJS, 181, 197
- Chapillon et al. (2008) Chapillon, E., Guilloteau, S., Dutrey, A., & Piétu, V. 2008, A&A, 488, 565
- Chen et al. (2007) Chen, C. H., Li, A., Bohac, C., et al. 2007, ApJ, 666, 466
- Clampin et al. (2003) Clampin, M., Krist, J. E., Ardila, D. R., et al. 2003, AJ, 126, 385
- Cohen et al. (1988) Cohen, M., Hollenbach, D. J., Haas, M.R., Erickson, E. F., 1988 ApJ, 329, 836
- Collins et al. (2009) Collins, K. A., Grady, C. A., Hamaguchi, K., et al. 2009, ApJ, 697, 557
- Creech-Eakman et al. (2002) Creech-Eakman, M. J., Chiang, E. I., Joung, R. M. K., Blake, G. A., van Dishoeck, E. F., 2002 A&A, 385, 546
- Currie & Sicilia-Aguilar (2011) Currie, T., & Sicilia-Aguilar, A. 2011, ApJ, 732, 24
- D’Alessio et al. (2006) D’Alessio, P., Calvet, N., Hartmann, L., Franco-Hernández, R., & Servín, H. 2006, ApJ, 638, 314
- D’Orazi et al. (2011) D’Orazi, V., Biazzo, K., & Randich, S. 2011, A&A, 526, A103
- de la Reza & Pinzón (2004) de la Reza, R., & Pinzón, G. 2004, AJ, 128, 1812
- de Zeeuw et al. (1999) de Zeeuw, P. T., Hoogerwerf, R., de Bruijne, J. H. J., Brown, A. G. A., & Blaauw, A. 1999, AJ, 117, 354
- Dent et al. (1995) Dent, W. R. F., Greaves, J. S., Mannings, V., Coulson, I. M., & Walther, D. M. 1995, MNRAS, 277, L25
- Dent et al. (2005) Dent, W. R. F., Greaves, J. S., & Coulson, I. M. 2005, MNRAS, 359, 663
- Donaldson et al. (2012) Donaldson, J. K., Roberge, A., Chen, C. H., et al. 2012, ApJ, 753, 147
- Dullemond & Dominik (2005) Dullemond, C.P. & Dominik, C., 2005, A&A, 434, 971
- Ercolano et al. (2011) Ercolano, B., Bastian, N., Spezzi, L., & Owen, J. 2011, MNRAS, 416, 439
- Evans et al. (2009) Evans, N. J., et al. 2009, ApJS, 181, 321
- Feigelson et al. (2003) Feigelson, E. D., Lawson, W. A., & Garmire, G. P. 2003, ApJ, 599, 1207
- Fischer & Valenti (2005) Fischer, D. & Valenti, J., 2005, ApJ, 622, 1102
- Franklin et al. (2008) Franklin, J., Snell, R. L., Kaufman, M. J., Melnick, G. J., Neufeld, D. A., Hollenbach, D. J., Bergin, E. A., 2008, ApJ, 674, 1015
- Fuente et al. (2002) Fuente, A., Martın-Pintado, J., Bachiller, R., Rodrıguez-Franco, A., & Palla, F. 2002, A&A, 387, 977
- Furlan et al. (2006) Furlan, E., Hartmann, L., Calvet, N., et al. 2006, ApJS, 165, 568
- Gautier et al. (2008) Gautier, T. N., III, Rebull, L. M., Stapelfeldt, K. R., & Mainzer, A. 2008, ApJ, 683, 813
- Giannini et al. (1999) Giannini et al., 1999, A&A, 346, 617
- Goicoechea et al. (2012) Goicoechea, J. R., Cernicharo, J., Karska, A., et al. 2012, A&A, 548, A77
- Gorti & Hollenbach (2004) Gorti, U. & Hollenbach, D., 2004 ApJ, 613, 424
- Gorti & Hollenbach, (2008) Gorti, U. & Hollenbach, D., 2008 ApJ, 683, 287
- Gorti & Hollenbach (2009) Gorti, U., & Hollenbach, D. 2009, ApJ, 690, 1539
- Gorti et al. (2011) Gorti, U., Hollenbach, D., Najita, J., & Pascucci, I. 2011, ApJ, 735, 90
- Grady et al. (2005) Grady, C.A., Woodgate,B., Heap, S.R., Bowers, C., Nuth, J.A., Herczeg, G.J., Hill, H.G.M., 2005, ApJ, 620, 470
- Grady et al. (2007) Grady, C. A., Schneider, G., Hamaguchi, K., et al. 2007, ApJ, 665, 1391
- Greaves et al. (2006) Greaves, J. S., Fischer, D. A., & Wyatt, M. C. 2006, MNRAS, 366, 283
- Güdel et al. (2007) Güdel, M., Briggs, K. R., Arzner, K., et al. 2007, A&A, 468, 353
- Güdel et al. (2010) Güdel, M., Lahuis, F., Briggs, K. R., et al. 2010, A&A, 519, A113
- Günther & Schmitt (2009) Günther, H. M., & Schmitt, J. H. M. M. 2009, A&A, 494, 1041
- Haisch et al. (2001) Haisch, K. E., Jr., Lada, E. A., & Lada, C. J. 2001, ApJ, 553, L153
- Harris et al. (2012) Harris, R. J., Andrews, S. M., Wilner, D. J., & Kraus, A. L. 2012, ApJ, 751, 115
- Hartigan et al. (1995) Hartigan, P., Edwards, S., & Ghandour, L. 1995, ApJ, 452, 736
- Hartmann et al. (1998) Hartmann, L., Calvet, N., Gullbring, E., & D’Alessio, P. 1998, ApJ, 495, 385
- Hartmann et al. (2001) Hartmann, L., 2001, AJ, 121, 1030
- Hillenbrand et al. (2008) Hillenbrand, L. A., Carpenter, J. M., Kim, J. S., et al. 2008, ApJ, 677, 630
- Hioki et al. (2007) Hioki, T., Itoh, Y., Oasa, Y., et al. 2007, AJ, 134, 880
- Hollenbach et al. (1985) Hollenbach, D., 1985, Icarus, 61, 36
- Hollenbach et al. (1991) Hollenbach, D.J., Takahashi, T., Tielens, A.G.G.M., 1991, ApJ, 377, 192
- Hollenbach & Tielens (1997) Hollenbach, D. J., & Tielens, A. G. G. M. 1997, ARA&A, 35, 179
- Hughes et al. (2008) Hughes, A. M., Wilner, D. J., Kamp, I., & Hogerheijde, M. R. 2008, ApJ, 681, 626
- Hughes et al. (2011) Hughes, A. M., Wilner, D. J., Andrews, S. M., et al. 2011, ApJ, 740, 38
- Johnson et al. (2007) Johnson, J. A., Butler, R. P., Marcy, G. W., Fischer, D. A., Vogt, S. S., Wright, J. T., & Peek, K. M. G. 2007, ApJ, 670, 833
- Jonkheid et al. (2004) Jonkheid, B., Faas, F. G. A., van Zadelhoff, G.-J., van Dishoeck, E. F. 2004, A&A, 428, 511
- Kalas et al. (2008) Kalas, P., Graham, J. R., Chiang, E., et al. 2008, Science, 322, 1345
- Kamp et al. (2003) Kamp, I., van Zadelhoff, G-J., van Dishoeck, E.F., Stark, R., 2003, A&A, 397, 1129
- Kamp & Sammar (2004) Kamp, I., & Sammar, F., 2004, A&A, 427, 561
- Kamp et al. (2010) Kamp, I., Tilling, I., Woitke, P., Thi, W.-F., & Hogerheijde, M. 2010, A&A, 510, A18
- Kamp et al. (2011) Kamp, I., Woitke, P., Pinte, C., et al. 2011, A&A, 532, A85
- Kastner et al. (1997) Kastner, J. H., Zuckerman, B., Weintraub, D. A., & Forveille, T. 1997, Science, 277, 67
- Kenyon & Hartmann (1995) Kenyon, S., & Hartmann, L., 1995, ApJS, 101, 117
- Kenyon et al. (1998) Kenyon, S. J., Brown, D. I., Tout, C. A., & Berlind, P. 1998, AJ, 115, 2491
- Kenyon et al. (2008) Kenyon, S. J., Gómez, M., & Whitney, B. A. 2008, Handbook of Star Forming Regions, Volume I, 405
- Krivov et al. (2008) Krivov, A. V., Müller, S., Löhne, T., & Mutschke, H. 2008, ApJ, 687, 608
- Lahuis et al. (2007) Lahuis, F., van Dishoeck, E. F., Blake, G. A., Evans, N. J., II, Kessler-Silacci, J. E., & Pontoppidan, K. M. 2007, ApJ, 665, 492
- Lagrange et al. (1998) Lagrange, A.-M., Beust, H., Mouillet, D., et al. 1998, A&A, 330, 1091
- Lebreton et al. (2012) Lebreton, J., Augereau, J.-C., Thi, W.-F., et al. 2012, A&A, 539, A17
- Liseau et al. (2006) Liseau, R., Justtanont, K., & Tielens, A. G. G. M. 2006, A&A, 446, 561
- López-Santiago et al. (2010) López-Santiago, J., Albacete Colombo, J. F., & López-García, M. A. 2010, A&A, 524, A97
- Lorenzetti et al. (1999) Lorenzetti, D., Tommasi, E., Giannini, T., et al. 1999, A&A, 346, 604
- Lorenzetti et al. (2000) Lorenzetti, D., Giannini, T., Nisini, B., et al. 2000, A&A, 357, 1035
- Low et al. (2005) Low, F. J., Smith, P. S., Werner, M., Chen, C., Krause, V., Jura, M., & Hines, D. C. 2005, ApJ, 631, 1170
- Luhman et al. (2009) Luhman, K. L., Mamajek, E. E., Allen, P. R., & Cruz, K. L. 2009, ApJ, 703, 399
- Luhman et al. (2010) Luhman, K. L., Allen, P. R., Espaillat, C., Hartmann, L., & Calvet, N. 2010, ApJS, 186, 111
- Maldonado et al. (2012) Maldonado, J., Eiroa, C., Villaver, E., Montesinos, B., & Mora, A. 2012, A&A, 541, A40
- Mamajek et al. (2004) Mamajek, E. E., Meyer, M. R., Hinz, P. M., Hoffmann, W. F., Cohen, M., & Hora, J. L. 2004, ApJ, 612, 496
- Mamajek (2005) Mamajek, E. E. 2005, ApJ, 634, 1385
- Mamajek et al. (1999) Mamajek, E.E., Lawson, W.A., Feigelson, E.D., 1999 ApJ, 516, L77
- Maness et al. (2008) Maness, H. L., Fitzgerald, M. P., Paladini, R., et al. 2008, ApJ, 686, L25
- Mathews et al. (2010) Mathews, G. S., Dent, W. R. F., Williams, J. P., et al. 2010, A&A, 518, L127
- Mathews et al. (2012) Mathews, G. S., Williams, J. P., Ménard, F., et al. 2012, ApJ, 745, 23
- Matthews et al. (2007) Matthews, B. C., Kalas, P. G., & Wyatt, M. C. 2007, ApJ, 663, 1103
- Meijerink et al. (2008) Meijerink, R., Glassgold, A.E., & Najita, J.R., 2008, ApJ, 676, 518
- Meeus et al. (2001) Meeus, G., Waters, L. B. F. M., Bouwman, J., et al. 2001, A&A, 365, 476
- Meeus et al. (2010) Meeus, G., Pinte, C., Woitke, P., et al. 2010, A&A, 518, L124
- Meeus et al. (2012) Meeus, G., Montesinos, B., Mendigutía, I., et al. 2012, A&A, 544, A78
- Melnikov et al. (2009) Melnikov, S. Y., Eislöffel, J., Bacciotti, F., Woitas, J., & Ray, T. P. 2009, A&A, 506, 763
- Moerchen et al. (2007) Moerchen, M. M., Telesco, C. M., Packham, C., & Kehoe, T. J. J. 2007, ApJ, 655, L109
- Molinari et al. (2000) Molinari, S., Noriega-Crespo, A., Ceccarelli, C., Nisini, B., Giannini, T., Lorenzetti, D., Caux, E., Liseau, R., Saraceno, P., White, G. J., 2000, A&A, 538, 698
- Montesinos et al. (2009) Montesinos, B., Eiroa, C., Mora, A., & Merín, B. 2009, A&A, 495, 901
- Moór et al. (2006) Moór, A., Ábrahám, P., Derekas, A., et al. 2006, ApJ, 644, 525
- Najita et al. (2010) Najita, J.R., Carr, J.S., Strom, S.E., Watson, D.M., Pascucci, I., Hollenbach, D., Gorti, U., Keller, L., 2010, ApJ, 712, 274
- Nilsson et al. (2009) Nilsson, R., Liseau, R., Brandeker, A., et al. 2009, A&A, 508, 1057
- Nilsson et al (2010) Nilsson, R., Liseau, R., Brandeker, A., Olofsson G., Pilbratt, G.L., Risacher, C., Rodmann, J., Augereau, J.-C., Bergman, P., Eiroa, C., Fridlund, M., Th´ebault, P., and White, G.J., 2010, A&A, 518, 40
- Nisini et al. (2000) Nisini, B., Benedettini, M., Giannini, T., Codella, C., Lorenzetti, D., di Giorgio, A. M., Richer, J. S., 2000, A&A, 360, 297
- Nisini et al. (2002) Nisini, B., Gianini., T., Lorenzetti., D., 2002, ApJ, 576, 246
- Öberg et al. (2010) Öberg, K. I., et al. 2010, ApJ, 720, 480
- Olofsson et al. (2001) Olofsson, G., Liseau, R., & Brandeker, A. 2001, ApJ, 563, L77
- Ott (2010) Ott, S. 2010, ASP Conference Series, 434, 139
- Palla & Stahler (2002) Palla, F & Stahler, S.W., 2002 ApJ, 581, 1194
- Pascucci & Sterzik (2009) Pascucci, I., & Sterzik, M. 2009, ApJ, 702, 724
- Pecaut et al. (2012) Pecaut, M. J., Mamajek, E. E., & Bubar, E. J. 2012, ApJ, 746, 154
- Pilbratt et al. (2010) Pilbratt, G. L., Riedinger, J. R., Passvogel, T., et al. 2010, A&A, 518, L1
- Pinte et al. (2006) Pinte, C., Ménard, F., Duchêne, G., & Bastien, P. 2006, A&A, 459, 797
- Pinte et al. (2009) Pinte, C., Harries, T. J., Min, M., et al. 2009, A&A, 498, 967
- Pinte et al. (2010) Pinte, C., Woitke, P., Ménard, F., et al. 2010, A&A, 518, L126
- Podio et al. (2012) Podio, L., Kamp, I., Flower, D., et al. 2012, A&A, 545, A44
- Poglitsch et al. (2010) Poglitsch et al., A&A, 518, L2
- Pontoppidan et al. (2008) Pontoppidan, K.M., Blake, G.A., van Dishoeck, E.F., Smette, A., Ireland, M.J., Brown, J. 2008, ApJ, 684, 1323
- Pontoppidan et al. (2010) Pontoppidan, K. M., Salyk, C., Blake, G. A., et al. 2010, ApJ, 720, 887
- Rebull et al. (2008) Rebull, L. M., et al. 2008, ApJ, 681, 1484
- Rebull et al. (2010) Rebull, L. M., Padgett, D. L., McCabe, C.-E., et al. 2010, ApJS, 186, 259
- Rhee et al. (2007) Rhee, J. H., Song, I., Zuckerman, B., & McElwain, M. 2007, ApJ, 660, 1556
- Rice et al. (2006) Rice, W. K. M., Armitage, P. J., Wood, K., & Lodato, G. 2006, MNRAS, 373, 1619
- Riviere-Marichalar et al. (2012a) Riviere-Marichalar, P., Ménard, F., Thi, W. F., et al. 2012a, A&A, 538, L3
- Riviere-Marichalar et al. (2012b) Riviere-Marichalar, P., Barrado, D., Augereau, J.-C., et al. 2012b, A&A, 546, L8
- Roberge et al. (2006) Roberge, A., Feldman, P. D., Weinberger, A. J., Deleuil, M., & Bouret, J.-C. 2006, Nature, 441, 724
- Sandell et al. (2011) Sandell, G., Weintraub, D. A., & Hamidouche, M. 2011, ApJ, 727, 26
- Scholz et al. (2007) Scholz, A., Coffey, J., Brandeker, A., & Jayawardhana, R. 2007, ApJ, 662, 1254
- Shibai et al. (1991) Shibai, H., et al. 1991, ApJ, 374, 522
- Sicilia-Aguilar et al. (2009) Sicilia-Aguilar, A., Bouwman, J., Juhász, A., et al. 2009, ApJ, 701, 1188
- Skinner et al. (2004) Skinner, S. L., Güdel, M., Audard, M., & Smith, K. 2004, ApJ, 614, 221
- Song et al. (2003) Song, I., Zuckerman, B., & Bessell, M. S. 2003, ApJ, 599, 342
- Spezzi et al. (2008) Spezzi, L., Alcalá, J. M., Covino, E., et al. 2008, ApJ, 680, 1295
- Spinoglio et al. (2000) Spinoglio, L., et al. 2000, A&A, 353, 1055
- Smith et al. (2006) Smith, P. S., Hines, D. C., Low, F. J., Gehrz, R. D., Polomski, E. F., & Woodward, C. E. 2006, ApJ, 644, L125
- Stacey et al. (1991) Stacey, G. J., Geis, N., Genzel, R., et al. 1991, ApJ, 373, 42
- Stelzer et al. (2006) Stelzer, B., Micela, G., Hamaguchi, K., & Schmitt, J. H. M. M. 2006, A&A, 457, 223
- Thalmann et al. (2010) Thalmann, C., Grady, C. A., Goto, M., et al. 2010, ApJ, 718, L87
- Thébault & Augereau (2005) Thébault, P., & Augereau, J.-C. 2005, A&A, 437, 141
- Thi et al. (2005) Thi, W.-F., van Dalen, B., Bik, A., Waters, L.F.B.M., 2005 A&A, 430, L61
- Thi et al. (2010) Thi, W.-F., Mathews, G., Ménard, F., et al. 2010, A&A, 518, L125
- Thi et al. (2011) Thi, W.-F., Ménard, F., Meeus, G., et al. 2011, A&A, 530, L2
- Tilling et al. (2012) Tilling, I., Woitke, P., Meeus, G., et al. 2012, A&A, 538, A20
- Torres et al. (2000) Torres, C. A. O., da Silva, L., Quast, G. R., de la Reza, R., & Jilinski, E. 2000, AJ, 120, 1410
- Torres et al. (2008) Torres, C. A. O., Quast, G. R., Melo, C. H. F., & Sterzik, M. F. 2008, Handbook of Star Forming Regions, Volume II, 757
- Torres et al. (2009) Torres, R. M., Loinard, L., Mioduszewski, A. J., & Rodríguez, L. F. 2009, ApJ, 698, 242
- Trilling et al. (2007) Trilling, D. E., et al. 2007, ApJ, 658, 1289
- Trilling et al. (2008) Trilling, D. E., Bryden, G., Beichman, C. A., et al. 2008, ApJ, 674, 1086
- van den Ancker et al. (2001) van den Ancker, M. E., Meeus, G., Cami, J., Waters, L. B. F. M., & Waelkens, C. 2001, A&A, 369, L17
- van Dishoeck (2004) van Dishoeck, E. F. 2004, ARA&A, 42, 119
- van Kempen et al. (2010) van Kempen, T. A., Kristensen, L. E., Herczeg, G. J., et al. 2010, A&A, 518, L121
- Webb et al. (1999) Webb, R. A., Zuckerman, B., Platais, I., Patience, J., White, R. J., Schwartz, M. J., & McCarthy, C. 1999, ApJ, 512, L63
- Whittet et al. (1997) Whittet, D. C. B., Prusti, T., Franco, G. A. P., et al. 1997, A&A, 327, 1194
- Williams & Cieza (2011) Williams, J. P., & Cieza, L. A. 2011, ARA&A, 49, 67
- Woitke et al. (2009a) Woitke, P., Kamp, I., Thi, W-F., 2009, A&A, 501, 383
- Woitke et al. (2009b) Woitke, P., Thi, W.-F., Kamp, I., & Hogerheijde, M. R. 2009, A&A, 501, L5
- Woitke et al. (2010) Woitke, P., Pinte, C., Tilling, I., et al. 2010, MNRAS, 405, L26
- Woitke et al. (2011) Woitke, P., Riaz, B., Duchêne, G., et al. 2011, A&A, 534, A44
- Wyatt & Dent (2002) Wyatt, M.C. & Dent, W.R.F., 2002, MNRAS, 334, 589
- Wyatt (2008) Wyatt, M. C. 2008, ARA&A, 46, 339
- Young et al. (2005) Young, K. E., Harvey, P. M., Brooke, T. Y., et al. 2005, ApJ, 628, 283
- Zagorovsky et al. (2010) Zagorovsky, K., Brandeker, A., & Wu, Y. 2010, ApJ, 720, 923
- Zuckerman et al. (1995) Zuckerman, B., Forveille, T., & Kastner, J. H. 1995, Nature, 373, 494
- Zuckerman et al. (2001) Zuckerman, B., Song, I, Bessell, M.S. & Webb, R.A., 2001, ApJ, 562, L87
- Zuckerman & Webb (2000) Zuckerman, B., & Webb, R. A. 2000, ApJ, 535, 959
- Zuckerman et al. (2011) Zuckerman, B., Rhee, J. H., Song, I., & Bessell, M. S. 2011, ApJ, 732, 61
- Zuckerman & Song (2012) Zuckerman, B., & Song, I. 2012, ApJ, 758, 77
Appendix A Target list
| ID | Name | RA | DEC | Dist. | Sp.T.aa Spectral type. For multiple systems, we give either only the primary, or the brightest components when these are separable in PACS. | Sep.bb For multiple systems, separation, in arcsec, between the two main components. ’sb’ indicates a spectroscopic binary; ’e’ means eclipsing binary. | log(Lx) ccX-ray luminosity, between 0.3-10keV, in erg s-1 | WHαdd H EW is given as positive for an emission component, ‘’ for photospheric absorption and blank for no measurement. An average from published values for the most luminous component in indicated, or both components when they are separable with PACS. Note that the HEW is highly variable in many objects. | SEDee SED Class from the literature, if available: either I-II, II (defined as ), III (, which includes stars without a measured IR excess), TO (Transition Object, defined as a Class III object with an additional excess at wavelengths longer than 10), and D (classed as a debris disk). Note that for the Herbig AeBe stars, the SED classification is instead based on the Meeus SED groups I and II - see 5.0.9 for details. Blank means no excess is known in either the IR or longer wavelengths. | Mdustff Disk dust mass, in Solar units, derived in most cases from published mm/sub-mm observations (see section 5.0 for references). Upper limits are 3-, and a dashed line indicates no published values were available. Lower limits are normally based on fits to FIR photometry, where no sub-mm datapoint is available. Note that disk mass for protoplanetary disks is normally assumed to be 100.. | OI/CII/CO/H2Ogg Summary of line detections from PACS of [OI]63, [CII]157, CO J-18-17 and H2O (any transition detected, most commonly the line at 63.3 - see text). ’1’ indicates detection, ’0’ means not detected, ’:’ means not observed. | Notes/refs.hh ’Jet’ indicates published evidence of an optical jet, ’Ext.OI’ indicates the [OI]63 emission appears extended and ’high’ indicates high published mass loss rate (see §5.2.1 and 5.2.2 for details). ’Mult.’ indicates a multiple hierarchical system. |
|---|---|---|---|---|---|---|---|---|---|---|---|---|
| T-1 | HBC 347 | 03 29 38.37 | +24 30 38.0 | 140 | K1 | … | … | 0.2 | III | 4.0e-6 | 0/:/:/0 | |
| T-2 | HBC 351 | 03 52 02.24 | +24 39 47.9 | 140 | K5 | 0.61 | … | 2.8 | III | 5.0e-6 | :/:/:/: | ii Membership is now in doubt - see Luhman et al. (2009). |
| T-3 | HBC 352/353 | 03 54 29.51 | +32 03 01.4 | 140 | G0 | 8.6 | 30.4 | III | 5.0e-6 | :/:/:/: | ii Membership is now in doubt - see Luhman et al. (2009). | |
| T-4 | HBC 354/355 | 03 54 35.56 | +25 37 11.1 | 140 | K3 | 6.3 | … | III | 4.0e-6 | :/:/:/: | ii Membership is now in doubt - see Luhman et al. (2009). | |
| T-5 | SAO 76411 | 04 02 53.57 | +22 08 11.8 | 140 | G1 | … | … | 1 | III | 5.0e-6 | :/:/:/: | |
| T-6 | HBC 356/357 | 04 03 13.96 | +25 52 59.8 | 140 | K2 | 2.0 | … | 1 | III | 4.0e-6 | 0/:/:/0 | ii Membership is now in doubt - see Luhman et al. (2009). |
| T-7 | HBC 358/359 | 04 03 50.84 | +26 10 53.2 | 140 | M2 | 1.6 | 29.8 | 7 | III | 5.0e-6 | 0/:/:/0 | |
| T-8 | SAO 76428 | 04 04 28.49 | +21 56 04.6 | 140 | F8 | … | … | 1.3 | III | 6.0e-6 | :/:/:/: | |
| T-9 | HBC 360/361 | 04 04 39.37 | +21 58 18.6 | 140 | M3 | 7.2 | … | 6.6 | III | 7.0e-6 | :/:/:/: | |
| T-10 | HBC 362 | 04 05 30.88 | +21 51 10.7 | 140 | M2 | … | … | 6.6 | III | 4.0e-6 | :/:/:/: | |
| T-11 | LkCa 1 | 04 13 14.14 | +28 19 10.8 | 140 | M4 | … | 29.3 | 3.5 | III | 4.0e-6 | 0/:/:/0 | |
| T-12 | Anon 1 | 04 13 27.23 | +28 16 24.8 | 140 | M0 | 0.015 | 30.5 | 2.5 | III | 4.0e-6 | 0/:/:/0 | |
| T-13 | V773 Tau A-D | 04 14 12.92 | +28 12 12.4 | 140 | K2 | 0.2 | 30.9 | 3.0 | II | 5.0e-6 | 1/:/:/0 | Jet. Hierachical |
| T-14 | FM Tau | 04 14 13.58 | +28 12 49.2 | 140 | M0 | … | 29.7 | 76 | II | 2.0e-5 | 0/0/0/0 | 37” from V773Tau |
| T-15 | CW Tau | 04 14 17.0 | +28 10 57.8 | 140 | K3 | … | 30.4 | 140 | II | 2.0e-5 | 1/1/:/0 | Jet, high |
| T-16 | CX Tau | 04 14 47.86 | +26 48 11.0 | 140 | M3 | … | … | 18 | II | 1.0e-5 | 1/:/:/0 | |
| T-17 | LkCa 3 AB | 04 14 47.97 | +27 52 34.6 | 140 | M1 | 0.47 | 29.8 | 2.7 | III | 4.0e-6 | 0/:/:/0 | |
| T-18 | FO Tau AB | 04 14 49.29 | +28 12 30.6 | 140 | M2 | 0.15 | 28.7 | 126 | II | 6.0e-6 | 0/0/0/0 | |
| T-19 | CIDA-2 | 04 15 05.16 | +28 08 46.2 | 140 | M5.5 | … | 29.1 | 6 | III | 7.0e-6 | 0/:/:/0 | |
| T-20 | LkCa 4 | 04 16 28.11 | +28 07 35.8 | 140 | K7 | … | 30.0 | 3.2 | III | 2.0e-6 | 0/:/:/0 | |
| T-21 | CY Tau | 04 17 33.73 | +28 20 46.8 | 140 | M1.5 | … | 29.3 | 63 | II | 6.0e-5 | 1/:/:/0 | |
| T-22 | LkCa 5 | 04 17 38.94 | +28 33 00.5 | 140 | M2 | 0.048 | 29.7 | 3.8 | III | 2.0e-6 | 0/:/:/0 | |
| T-23 | HBC 372 | 04 18 21.47 | +16 58 47.0 | 140 | K5 | … | … | III | 4.0e-6 | :/:/:/: | ||
| T-24 | HBC 376 | 04 18 51.70 | +17 23 16.6 | 140 | K7 | … | … | 1.9 | III | 3.0e-6 | :/:/:/: | |
| T-25 | 04158+2805 | 04 18 58.14 | +28 12 23.5 | 140 | M3 | … | … | 175 | I-II | 3.0e-4 | 1/0/1/0 | Jet |
| T-26 | FQ Tau AB | 04 19 12.81 | +28 29 33.1 | 140 | M3 | 0.76 | 28.8 | 97 | II | 1.0e-5 | 0/0/0/0 | |
| T-27 | BP Tau | 04 19 15.84 | +29 06 26.9 | 140 | K7 | … | 30.2 | 66 | II | 2.0e-4 | 1/:/:/0 | |
| T-28 | V819 Tau AB | 04 19 26.26 | +28 26 14.3 | 140 | K7 | 10.5 | 30.3 | 2.5 | III | 4.0e-6 | 0/0/:/0 | |
| T-29 | LkCa 7 AB | 04 19 41.27 | +27 49 48.5 | 140 | K7 | 1.04 | 29.9 | 3.9 | III | 4.0e-6 | 0/:/:/0 | |
| T-30 | DE Tau | 04 21 55.64 | +27 55 06.1 | 140 | M2 | … | - | 59 | III | 5.0e-5 | 0/0/:/0 | |
| T-31 | RY Tau | 04 21 57.40 | +28 26 35.5 | 140 | K1 | … | 30.7 | 13 | II | 2.0e-4 | 1/1/0/1 | Jet |
| T-32 | HD 283572 | 04 21 58.85 | +28 18 06.6 | 140 | G5 | … | 31.1 | III | 4.0e-6 | 0/:/:/0 | - | |
| T-33 | T Tau NS | 04 21 59.43 | +19 32 06.4 | 140 | K0 | 0.7 | 30.9 | 40 | I-II | 8.0e-5 | 1/1/1/1 | Ext.OI. Po12 |
| T-34 | FS Tau AB | 04 22 02.18 | +26 57 30.5 | 140 | M0 | 0.25 | 30.9 | 69 | II | 2.0e-5 | 1/1/1/1 | Ext.OI. Po12 |
| T-35 | LkCa 21 | 04 22 03.14 | +28 25 39.0 | 140 | M3 | 0.044 | 30.9 | 6.1 | III | 5.0e-6 | :/:/:/: | |
| T-36 | FT Tau | 04 23 39.19 | +24 56 14.1 | 140 | M3 | … | … | 254 | II | 1.0e-4 | 1/:/:/0 | |
| T-37 | IP Tau | 04 24 57.08 | +27 11 56.5 | 140 | M0 | … | … | 10.5 | II | 3.0e-5 | 1/:/:/0 | |
| T-38 | J1-4872 AB | 04 25 17.68 | +26 17 50.4 | 140 | K7 | 3.3 | 29.7 | 2.9 | III | 4.0e-6 | 0/:/:/0 | |
| T-39 | DG Tau B | 04 27 02.56 | +26 05 30.7 | 140 | K6 | … | 31.0 | 270 | I-II | 6.8e-4 | 1/1/:/0 | Ext.OI. Po12 |
| T-40 | DF Tau AB | 04 27 02.80 | +25 42 22.3 | 140 | M0.5 | 0.07 | 29.1 | 54.5 | II | 4.0e-6 | 1/0/0/0 | Jet, high |
| T-41 | DG Tau A | 04 27 04.70 | +26 06 16.3 | 140 | K6 | … | 29.4 | 90 | I-II | 2.0e-4 | 1/1/1/0 | Ext.OI, high. Po12 |
| T-42 | HBC 388 | 04 27 10.57 | +17 50 42.6 | 140 | K1 | … | … | III | 3.0e-6 | :/:/:/: | ||
| T-43 | J1-507 | 04 29 20.71 | +26 33 40.7 | 140 | M4 | 0.08 | 29.6 | 5.1 | III | 3.0e-6 | :/:/:/: | |
| T-44 | FW Tau ABC | 04 29 29.71 | +26 16 53.2 | 140 | M4 | 0.2 | … | 17 | III | 2.0e-6 | 0/:/:/0 | |
| T-45 | DH/DI Tau | 04 29 42.02 | +26 32 53.2 | 140 | M2/M2 | 2.3 | 30.9 | 35/2 | II/III | 3.0e-5 | 0/:/:/0 | Jet. Mult. |
| T-46 | IQ Tau | 04 29 51.56 | +26 06 44.9 | 140 | M0.5 | … | 29.5 | 12 | II | 2.0e-4 | 1/0/0/0 | |
| T-47 | UX Tau B/AC | 04 30 04.00 | +18 13 49.4 | 140 | K1 | 2.7 | 29.9 | 4 | II/III | 5.0e-5 | 1/:/:/0 | Mult. |
| T-48 | FX Tau AB | 04 30 29.61 | +24 26 45.0 | 140 | M1 | 0.9 | 29.6 | 12 | II | 9.0e-6 | 0/:/:/0 | |
| T-49 | DK Tau AB | 04 30 44.25 | +26 01 24.5 | 140 | K7 | 2.3 | 30.0 | 40 | II | 5.0e-5 | 1/0/:/0 | |
| T-50 | ZZ Tau | 04 30 51.38 | +24 42 22.3 | 140 | M3 | 0.04 | … | 14 | III | 4.0e-6 | 0/:/:/0 | |
| T-51 | JH 56 | 04 31 14.44 | +27 10 18.0 | 140 | M0.5 | … | … | 2.2 | III | 4.0e-6 | :/:/:/: | |
| T-52 | V927 Tau AB | 04 31 23.82 | +24 10 52.9 | 140 | M5.5 | 0.29 | 29.2 | 10 | III | 5.0e-6 | 0/:/:/0 | |
| T-53 | HBC 392 | 04 31 27.17 | +17 06 24.9 | 140 | K5 | … | … | 1.1 | III | 3.0e-6 | :/:/:/: | |
| T-54 | XZ Tau AB | 04 31 40.07 | +18 13 57.2 | 140 | M1.5 | 0.3 | 29.9 | 274 | II | 1.2e-5 | 1/1/1/1 | Jet, ext.OI. +HL Tau |
| T-55 | HK Tau AB | 04 31 50.57 | +24 24 18.1 | 140 | M0.5 | 2.4 | 28.9 | 42 | I-II | 4.0e-5 | 1/0/1/0 | |
| T-56 | V710 Tau AB | 04 31 57.79 | +18 21 38.1 | 140 | M0.5 | 3.1 | 30.1 | 61 | II | 7.0e-5 | 1/:/:/0 | |
| T-57 | J1-665 | 04 31 58.44 | +25 43 29.9 | 140 | M5 | … | 28.8 | 5.2 | III | 4.0e-6 | :/:/:/: | |
| T-58 | L1551-51 | 04 32 09.27 | +17 57 22.8 | 140 | K7 | … | 30.2 | 1.5 | III | 6.0e-6 | :/:/:/: | |
| T-59 | V827 Tau | 04 32 14.57 | +18 20 14.7 | 140 | K7 | 0.09 | 30.6 | 3 | III | 3.0e-6 | 1/:/:/0 | |
| T-60 | Haro 6-13 | 04 32 15.41 | +24 28 59.7 | 140 | M0 | … | 29.2 | 61 | I-II | 1.0e-4 | 1/0/1/0 | Jet |
| T-61 | V826 Tau AB | 04 32 15.84 | +18 01 38.7 | 140 | K7 | 0.014 | 30.6 | 3 | III | 4.0e-6 | :/:/:/: | |
| T-62 | V928 Tau AB | 04 32 18.86 | +24 22 27.2 | 140 | M0.5 | 0.2 | 30.0 | 1.5 | III | 4.0e-6 | :/:/:/: | |
| T-63 | GG Tau AB | 04 32 30.35 | +17 31 40.6 | 140 | K7 | 0.25 | 28.6 | 50 | II | 2.0e-3 | 1/0/0/0 | Mult. |
| T-64 | UZ Tau EW | 04 32 43.04 | +25 52 31.1 | 140 | M1 | 3.5 | 29.9 | 73 | II | 2.0e-4 | 1/0/0/0 | Jet, ext.OI, high, mult. |
| T-65 | L1551-55 | 04 32 43.73 | +18 02 56.3 | 140 | K7 | … | 29.8 | 1.0 | III | 3.0e-6 | :/:/:/: | |
| T-66 | GH/V807 Tau | 04 33 06.43 | +24 09 44.5 | 140 | M2/K7 | 0.3 | 29.1/30.0 | 20/10 | II/III | 7.0e-6 | 0/0/:/0 | Mult. |
| T-67 | V830 Tau | 04 33 10.03 | +24 33 43.4 | 140 | K7 | … | 30.7 | 2.5 | III | 3.0e-6 | :/:/:/: | - |
| T-68 | GI/GK Tau | 04 33 34.31 | +24 21 11.4 | 140 | K6/K7 | 13 | 29.9/30.1 | 18/25 | II/II | 2.0e-5 | 1/:/:/1 | Jet. GK is binary |
| T-69 | DL Tau | 04 33 39.06 | +25 20 38.2 | 140 | K7 | … | … | 101 | II | 9.0e-4 | 1/0/:/1 | |
| T-70 | HN Tau AB | 04 33 39.35 | +17 51 52.4 | 140 | K5 | 3.1 | 29.2 | 145 | II | 8.0e-6 | 1/0/0/0 | Jet, high |
| T-71 | DM Tau | 04 33 48.72 | +18 10 10.0 | 140 | M1 | … | 29.3 | 114 | II | 2.0e-4 | 1/0/:/0 | |
| T-72 | CI Tau | 04 33 52.00 | +22 50 30.2 | 140 | K7 | … | 29.5 | 90 | II | 3.0e-4 | 1/0/0/0 | |
| T-73 | J2-2041 | 04 33 55.47 | +18 38 39.1 | 140 | M3.5 | 0.42 | … | 4.7 | … | … | :/:/:/: | |
| T-74 | JH 108 | 04 34 10.99 | +22 51 44.5 | 140 | M1 | … | 30.0 | 3 | III | 4.0e-6 | :/:/:/: | |
| T-75 | HBC 407 | 04 34 18.04 | +18 30 06.6 | 140 | G8 | 0.14 | … | III | 4.0e-6 | :/:/:/: | ||
| T-76 | Wa Tau/1 | 04 34 39.29 | +25 01 01.0 | 140 | K0 | … | … | 0.5 | III | 3.0e-6 | :/:/:/: | |
| T-77 | AA Tau | 04 34 55.42 | +24 28 53.2 | 140 | K7 | … | 30.0 | 42 | II | 1.0e-4 | 1/0/:/1 | - |
| T-78 | HO Tau AB | 04 35 20.20 | +22 32 14.6 | 140 | M0.5 | 6.9 | 29.5 | 108 | II | 2.0e-5 | 0/:/:/0 | |
| T-79 | FF Tau AB | 04 35 20.90 | +22 54 24.2 | 140 | K7 | 0.03 | 29.8 | 2 | III | 2.0e-6 | 0/:/:/0 | |
| T-80 | HBC 412 AB | 04 35 24.51 | +17 51 43.0 | 140 | M2 | 0.7 | … | 9 | III | 4.0e-6 | :/:/:/: | |
| T-81 | DN Tau | 04 35 27.37 | +24 14 58.9 | 140 | M0 | … | 30.0 | 45 | II | 3.0e-4 | 1/0/:/0 | |
| T-82 | LkCa 14 | 04 36 19.09 | +25 42 59.0 | 140 | M0 | … | … | 1.1 | III | 4.0e-6 | :/:/:/: | |
| T-83 | HD 283759 | 04 36 49.12 | +24 12 58.8 | 140 | F2 | … | … | … | III | 4.0e-6 | :/:/:/: | |
| T-84 | DO Tau | 04 38 28.58 | +26 10 49.4 | 140 | M0 | … | … | 101 | II | 7.0e-5 | 1/0/1/0 | Ext.OI, jet, high |
| T-85 | HV TauABC | 04 38 35.28 | +26 10 38.6 | 140 | M1/M4 | 4.0 | 29.57 | 10 | III/II | 2.0e-5 | 1/:/:/0 | Jet, mult. |
| T-86 | VY Tau AB | 04 39 17.41 | +22 47 53.4 | 140 | M0 | 0.66 | … | 7.3 | II | 5.0e-6 | 0/:/:/0 | |
| T-87 | LkCa 15 | 04 39 17.80 | +22 21 03.5 | 140 | K5 | … | … | 18.5 | II | 5.0e-4 | 1/0/0/0 | |
| T-88 | JH 223 | 04 40 49.51 | +25 51 19.2 | 140 | M2 | 2.1 | 28.8 | 4 | II | 3.0e-6 | :/:/:/: | |
| T-89 | IW TauAB | 04 41 04.71 | +24 51 06.2 | 140 | K7 | 0.28 | 30.0 | 4 | III | 4.0e-6 | :/:/:/: | Jet |
| T-90 | CoKuTau/4 | 04 41 16.81 | +28 40 00.1 | 140 | M1.5 | 0.05 | … | 3 | II | 5.0e-6 | 1/:/:/0 | |
| T-91 | 04385+2550(Haro6-33) | 04 41 38.8 | +25 56 26.8 | 140 | M0 | 19 | 29.6 | 17 | I-II | … | 1/:/:/0 | |
| T-92 | DP Tau | 04 42 37.70 | +25 15 37.5 | 140 | M0.5 | 0.11 | 29.0 | 87 | II | 5.0e-6 | 1/1/1/0 | Jet |
| T-93 | GO Tau | 04 43 03.10 | +25 20 18.7 | 140 | M0 | … | 29.4 | 80 | II | 7.0e-4 | 0/:/:/0 | |
| T-94 | DQ Tau AB | 04 46 53.04 | +17 00 00.5 | 140 | K5 | 0.0004 | … | 102 | II | 2.0e-4 | 1/0/:/0 | |
| T-95 | Haro 6-37 AB | 04 46 58.98 | +17 02 38.2 | 140 | K7 | 2.6/0.3 | … | 13 | II | 1.0e-4 | 1/:/:/0 | Mult. |
| T-96 | DS Tau | 04 47 48.11 | +29 25 14.4 | 140 | K5 | 7.1 | … | 38 | II | 6.0e-5 | 1/:/:/0 | |
| T-97 | UY Aur AB | 04 51 47.37 | +30 47 13.5 | 140 | K7 | 0.88 | … | 63 | II | 2.0e-5 | 1/1/1/1 | Jet, high |
| T-98 | St 34 | 04 54 23.68 | +17 09 53.5 | 110 | M3 | 1.2 | … | 90 | II | 5.0e-6 | :/:/:/: | |
| T-99 | GM Aur | 04 55 10.99 | +30 21 59.2 | 140 | K3 | … | 29.8 | 79 | II | 3.0e-4 | 1/0/0/0 | |
| T-100 | LkCa 19 | 04 55 36.96 | +30 17 55.3 | 140 | K0 | … | 30.7 | 1.2 | III | 5.0e-6 | :/:/:/: | |
| T-101 | AB Aur | 04 55 45.83 | +30 33 04.4 | 140 | A0 | … | 29.5 | 33 | II | 4.0e-5 | 1/1/1/0 | |
| T-102 | SU Aur | 04 55 59.38 | +30 34 01.6 | 140 | G2 | … | 31.1 | 4 | II | 9.0e-6 | 1/1/1/0 | Jet |
| T-103 | HBC 427 | 04 56 02.02 | +30 21 03.7 | 140 | K7 | 0.03 | 30.5 | 1.4 | III | 7.0e-6 | :/:/:/: | |
| T-104 | V836 Tau | 05 03 06.60 | +25 23 19.7 | 140 | K8.5 | … | 30.0 | 7.7 | II | 1.0e-4 | 0/:/:/0 | |
| T-105 | CIDA-10 | 05 06 16.75 | +24 46 10.2 | 140 | M4 | 0.08 | 29.0 | 9 | III | 5.0e-6 | :/:/:/: | |
| T-106 | RW Aur AB | 05 07 49.54 | +30 24 05.1 | 140 | K1 | 1.4 | … | 75 | II | 4.0e-5 | 1/0/1/0 | Ext.OI. Po12 |
| S-1 | HIP 76310 | 15 35 16.10 | -25 44 03.1 | 150 | A0V | … | … | D | 3.6e-6 | 0/:/:/0 | ||
| S-2 | J153557.8-232405 | 15 35 57.80 | -23 24 04.6 | 145 | K3 | 0.05 | 30.04 | III | 4.2e-6 | :/:/:/: | ||
| S-3 | J154413.4-252258 | 15 44 13.34 | -25 22 59.1 | 145 | M1 | … | 30.0 | 3.2 | III | 4.2e-6 | :/:/:/: | |
| S-4 | HIP 77815 | 15 53 21.93 | -21 58 16.5 | 171 | A5V | … | … | … | - | 3.0e-6 | :/:/:/: | |
| S-5 | HIP 77911 | 15 54 41.60 | -22 45 58.5 | 147 | B9V | 7.96 | … | D | 3.5e-6 | 0/:/:/0 | ||
| S-6 | J155624.8-222555 | 15 56 24.77 | -22 25 55.3 | 145 | M4 | … | … | 5.4 | II | 3.7e-6 | :/:/:/: | |
| S-7 | HIP 78099 | 15 56 47.85 | -23 11 02.6 | 140 | A0V | … | … | … | 4.2e-6 | :/:/:/: | ||
| S-8 | J155706.4-220606 | 15 57 06.42 | -22 06 06.1 | 145 | M4 | … | … | 3.6 | II | 4.3e-6 | :/:/:/: | |
| S-9 | J155729.9-225843 | 15 57 29.86 | -22 58 43.8 | 145 | M4 | … | … | 7.0 | II | 3.7e-6 | 0/:/:/0 | |
| S-10 | J155829.8-231007 | 15 58 29.81 | -23 10 07.7 | 145 | M3 | … | … | 250 | II | 3.4e-6 | 0/:/:/0 | |
| S-11 | RXJ1600.7-2343 | 16 00 44.60 | -23 43 12.0 | 145 | M2 | 1.46 | 30.4 | … | III | 3.8e-6 | 0/:/:/0 | |
| S-12 | J160108.0-211318 | 16 01 08.01 | -21 13 18.5 | 145 | M0 | … | 30.3 | 2.4 | III | 4.0e-6 | :/:/:/: | |
| S-13 | J160210.9-200749 | 16 02 10.96 | -20 07 49.6 | 145 | M5 | … | … | 3.5 | III | 3.7e-6 | :/:/:/: | |
| S-14 | J160245.4-193037 | 16 02 45.45 | -19 30 37.8 | 145 | M5 | 28.2 | … | 1.1 | III | 3.6e-6 | :/:/:/: | |
| S-15 | J160357.6-203105 | 16 03 57.68 | -20 31 05.5 | 145 | K5 | … | … | 12 | II | 3.7e-6 | 0/0/0/0 | |
| S-16 | J160357.9-194210 | 16 03 57.94 | -19 42 10.8 | 145 | M2 | … | … | 3.0 | II | 3.7e-6 | 0/:/:/0 | |
| S-17 | J160421.7-213028 | 16 04 21.66 | -21 30 28.4 | 145 | K2 | 16.22 | 30.3 | 0.6 | II-III | 1.1e-4 | 1/1/0/0 | |
| S-18 | J160525.5-203539 | 16 05 25.56 | -20 35 39.7 | 145 | M5 | … | … | 6.1 | III | 5.4e-6 | :/:/:/: | |
| S-19 | J160532.1-193315 | 16 05 32.15 | -19 33 16.0 | 145 | M5 | … | … | 26 | III | 3.9e-6 | 0/:/:/0 | |
| S-20 | J160545.4-202308 | 16 05 45.40 | -20 23 08.8 | 145 | M2 | … | … | 35 | II | 7.7e-6 | 0/0/0/0 | |
| S-21 | J160600.6-195711 | 16 06 00.62 | -19 57 11.5 | 145 | M5 | … | … | 7.5 | II | 4.9e-6 | 0/:/:/0 | |
| S-22 | ScoPMS 31 | 16 06 21.96 | -19 28 44.6 | 145 | M0.5V | 0.58 | 30.1 | 21 | II | 4.1e-6 | 0/0/:/0 | |
| S-23 | J160622.8-201124 | 16 06 22.78 | -20 11 24.4 | 145 | M5 | … | … | 6.0 | II | 4.3e-6 | :/:/:/: | |
| S-24 | J160643.8-190805 | 16 06 43.86 | -19 08 05.6 | 145 | K6 | … | … | 2.4 | … | … | :/:/:/: | |
| S-25 | J160654.4-241610 | 16 06 54.36 | -24 16 10.8 | 145 | M3 | 1.50 | 29.9 | 3.6 | … | … | :/:/:/: | |
| S-26 | J160702.1-201938 | 16 07 02.12 | -20 19 38.8 | 145 | M5 | 1.63 | … | 30 | II | 3.7e-6 | :/:/:/: | |
| S-27 | HIP 78996 | 16 07 29.93 | -23 57 02.3 | 108 | A9V | … | … | D | 4.2e-6 | :/:/:/: | ||
| S-28 | J160801.4-202741 | 16 08 01.42 | -20 27 41.7 | 145 | K8 | … | 29.9 | 2.3 | … | … | :/:/:/: | |
| S-29 | J160823.2-193001 | 16 08 23.25 | -19 30 00.9 | 145 | K9 | … | … | 6.0 | II | 4.4e-5 | 0/0/0/0 | |
| S-30 | J160827.5-194904 | 16 08 27.52 | -19 49 04.7 | 145 | M5 | … | … | 12 | III | 5.3e-6 | :/:/:/: | |
| S-31 | J160856.7-203346 | 16 08 56.73 | -20 33 46.0 | 145 | K5 | … | 30.1 | 0.5 | … | … | :/:/:/: | |
| S-32 | J160900.7-190852 | 16 09 00.39 | -19 08 44.8 | 145 | K9 | … | 30.0 | 13 | II | 2.5e-5 | :/:/:/: | +J160900.0-190836 |
| S-33 | HIP 79156 | 16 09 20.89 | -19 27 25.9 | 170 | A0V | 0.89 | … | D | 3.3e-6 | :/:/:/: | ||
| S-34 | J160953.6-175446 | 16 09 53.62 | -17 54 47.4 | 145 | M3 | … | … | 22 | II | 4.5e-6 | :/:/:/: | |
| S-35 | J160959.4-180009 | 16 09 59.33 | -18 00 09.1 | 145 | M4 | … | … | 4.0 | II | 5.1e-6 | 0/0/0/0 | |
| S-36 | J161115.3-175721 | 16 11 15.34 | -17 57 21.4 | 145 | M1 | … | 30.2 | 2.4 | II | 6.3e-6 | :/:/:/: | |
| S-37 | HIP 79410 | 16 12 21.83 | -19 34 44.6 | 140 | B9V | … | … | D | 4.6e-6 | :/:/:/: | ||
| S-38 | HIP 79439 | 16 12 44.11 | -19 30 10.2 | 131 | B9V | … | … | D | 3.9e-6 | 0/:/:/0 | ||
| S-39 | J161402.1-230101 | 16 14 02.12 | -23 01 02.2 | 145 | G4 | … | 30.2 | … | … | :/:/:/: | ||
| S-40 | J161411.0-230536 | 16 14 11.08 | -23 05 36.2 | 145 | K0 | 0.22 | 30.8 | 0.8 | II | 6.0e-6 | 0/:/:/0 | |
| S-41 | J161420.3-190648 | 16 14 20.30 | -19 06 48.1 | 145 | K5 | … | 29.3 | 52 | II | 1.7e-5 | 1/1/1/0 | |
| S-42 | HIP 79878 | 16 18 16.17 | -28 02 30.1 | 129 | A0V | … | … | D | 4.2e-6 | 0/:/:/0 | ||
| S-43 | HIP 80088 | 16 20 50.23 | -22 35 38.7 | 139 | A9V | … | … | D | 3.7e-6 | 0/:/:/0 | ||
| S-44 | HIP 80130 | 16 21 21.15 | -22 06 32.3 | 144 | A9V | … | … | … | 4.4e-6 | :/:/:/: | ||
| E-1 | RECX18 | 08 36 10.7 | -79 08 18.4 | 97 | M5.3/M5.3 | 0.04 | 30.6 | … | III | … | :/:/:/: | |
| E-2 | RECX1 (EG Cha) | 08 36 56.24 | -78 56 45.5 | 97 | K7/M0 | 0.2 | 30.6 | 1.4 | III | … | 0/:/:/0 | |
| E-3 | RECX17 | 08 38 51.50 | -79 16 13.7 | 97 | M5.0/M5.0 | 0.04 | … | … | III | … | :/:/:/: | |
| E-4 | RECX14 (ES Cha) | 08 41 30.3 | -78 53 06.5 | 97 | M4.7 | … | … | 12 | TO | 3e-7 | 0/:/:/0 | |
| E-5 | RECX3 (EH Cha) | 08 41 37.04 | -79 03 30.4 | 97 | M3.0 | … | 29.1 | 2.2 | TO | 3.5e-10 | 0/:/:/0 | |
| E-6 | RECX13 (HD75505) | 08 41 44.72 | -79 02 53.2 | 97 | A5 | … | … | … | III | … | :/:/:/: | |
| E-7 | RECX4 (EI Cha) | 08 42 23.73 | -79 04 03.0 | 97 | M1.3 | … | 30.1 | 2.3 | TO | 2e-9 | 0/:/:/0 | |
| E-8 | RECX5 (EK Cha) | 08 42 27.11 | -78 57 47.9 | 97 | M3.8 | … | 29.0 | 35 | TO | 7e-6 | 0/:/:/0 | |
| E-9 | RECX6 (EL Cha) | 08 42 38.80 | -78 54 42.8 | 97 | M3.0 | … | 29.5 | 3.6 | III | … | 0/:/:/0 | |
| E-10 | RECX7 (EM Cha) | 08 43 07.24 | -79 04 52.5 | 97 | K6.9/M1 | 0.001 | 30.3 | 0.4 | III | … | :/:/:/: | |
| E-11 | RECX8 (RS Cha AB) | 08 43 12.23 | -79 04 12.3 | 97 | A7/A8 | e | 29.8 | III | … | 0/:/:/0 | ||
| E-12 | RECX15 (ET Cha) | 08 43 18.58 | -79 05 18.2 | 97 | M3.4 | … | 28.8 | 90 | II | 2.5e-8 | 1/0/0/0 | Woi11 |
| E-13 | RECX16 (J0844.2-7833) | 08 44 09.15 | -78 33 45.7 | 97 | M5.5 | … | … | … | II | … | 0/:/:/0 | |
| E-14 | RECX9 (EN Cha) | 08 44 16.38 | -78 59 08.1 | 97 | M4.4/M4.7 | 0.2 | 28.5 | 10 | TO | 1.4e-6 | 0/:/:/0 | |
| E-15 | RECX10 (EO Cha) | 08 44 31.88 | -78 46 31.2 | 97 | M0.3 | … | 30.0 | 1.0 | III | … | 0/:/:/0 | |
| E-16 | RECX11 (EP Cha) | 08 47 01.66 | -78 59 34.5 | 97 | K6.5 | … | 30.1 | 3.2 | II | 3.3e-5 | 1/:/:/0 | |
| E-17 | RECX12 (EQ Cha) | 08 47 56.77 | -78 54 53.2 | 97 | M3.2/M3.2 | 0.04 | 30.1 | 4.2 | III | … | 0/:/:/0 | |
| W-1 | TWA21 | 10 13 14.76 | -52 30 54.1 | 69 | K3 | … | 30.2 | 3 | III | 1.0e-6 | :/:/:/: | |
| W-2 | TWA07 | 10 42 30.11 | -33 40 16.2 | 38 | M1 | … | 29.6 | 5 | TO | 6.0e-7 | 0/:/:/0 | |
| W-3 | TWA01 (TW Hya) | 11 01 51.92 | -34 42 17.0 | 58 | M2.5 | … | 30.4 | 220 | II | 6e-4 | 1/0/0/1 | Thi10 |
| W-4 | TWA02AB | 11 09 13.8 | -30 01 39.8 | 52 | M2 | 2 | 29.4 | 2 | … | 1.0e-6 | 0/:/:/0 | |
| W-5 | TWA03A (Hen3-600A) | 11 10 27.88 | -37 31 52.0 | 42 | M3e | 10 | 29.2 | 22 | TO | 1.1e-5 | 0/:/:/0 | |
| W-6 | TWA12 | 11 21 05.50 | -38 45 16.3 | 32 | M2 | … | 29.1 | 51 | … | 1.0e-6 | :/:/:/: | |
| W-7 | TWA13AB | 11 21 17.24 | -34 46 45.5 | 38 | M2e | 5.1 | 29.4 | 4 | TO | … | 0/:/:/0 | confused region |
| W-8 | TWA04AB (HD98800AB) | 11 22 05.30 | -24 46 39.3 | 46 | M5 | 0.8 | 29.9 | D | 1e-6 | 1/0/:/0 | Mult. | |
| W-9 | TWA05Aab | 11 31 55.26 | -34 36 27.2 | 50 | M2 | 2 | 29.8 | 13.4 | … | 1.0e-6 | :/:/:/: | |
| W-10 | TWA23 | 12 07 27.38 | -32 47 00.3 | 37 | M1 | … | 29.2 | … | 1.0e-6 | 0/:/:/0 | ||
| W-11 | TWA25 | 12 15 30.72 | -39 48 42.6 | 44 | M0 | … | 29.8 | 2 | … | 1.0e-6 | :/:/:/: | |
| W-12 | TWA16 | 12 34 56.30 | -45 38 07.6 | 66 | M1.5 | 0.7 | 29.6 | 4 | … | 1.0e-6 | :/:/:/: | |
| W-13 | TWA10 | 12 35 04.25 | -41 36 38.6 | 57 | M2.5 | … | 29.6 | 11 | … | 1.0e-6 | 0/:/:/0 | |
| B-1 | HD 203 | 00 06 50.09 | -23 06 27.1 | 39 | F2IV | … | 28.9 | … | D | 9e-9 | :/:/:/: | |
| B-2 | HD 14082B | 02 17 25.02 | +28 44 36.3 | 39 | F5V | (10) | 30.0 | … | D | 1.5e-8 | :/:/:/: | SN03 |
| B-3 | AG Tri | 02 27 29.25 | +30 58 24.6 | 42 | K8 | (22) | … | … | D | 1.0e-10 | :/:/:/: | SN03 |
| B-4 | HIP 12545 | 02 41 25.89 | +05 59 18.4 | 41 | M0 | sb | … | 0.6 | … | … | :/:/:/: | |
| B-5 | 51 Eri (HD 29391) | 04 37 36.13 | -02 28 24.8 | 30 | F0V | 66 | … | … | … | … | :/:/:/: | |
| B-6 | GJ 3305 | 04 37 37.47 | -02 29 28.4 | 30 | M0.5 | … | 30.2 | 2.2 | … | … | :/:/:/: | |
| B-7 | AF Lep (HD 35850) | 05 27 04.76 | -11 54 03.5 | 27 | F7V | sb | 30.3 | … | … | :/:/:/: | ||
| B-8 | AO Men | 06 18 28.21 | -72 02 41.5 | 39 | K7 | … | 30.2 | 0.6 | … | … | :/:/:/: | |
| B-9 | HD 139084AB | 15 38 57.23 | -57 42 22.7 | 40 | K0V | 10.7 | … | … | … | … | :/:/:/: | |
| B-10 | HD 146624 (HR6070) | 16 18 17.90 | -28 36 50.5 | 43 | A0V | … | … | … | … | … | :/:/:/: | |
| B-11 | HD 164249 | 18 03 03.41 | -51 38 56.4 | 47 | F5V | 16 | 30.6 | D | 4e-10 | 0/:/:/0 | Nil09 | |
| B-12 | HD 172555 | 18 45 26.90 | -64 52 16.5 | 29 | A7V | 68.5 | 28.8 | … | D | 2e-9 | 1/:/:/0 | Nil09,Riv12 |
| B-13 | CD-64 1208 | 18 45 37.03 | -64 51 46.1 | 29 | K7 | 0.2 | 29.9 | … | … | … | :/:/:/: | |
| B-14 | PZ Tel (HD 174429) | 18 53 05.87 | -50 10 49.9 | 50 | K0Vp | 0.3 | 30.6 | D | (1e-8) | :/:/:/: | ||
| B-15 | Tel AB (HD 181296) | 19 22 51.21 | -54 25 26.1 | 48 | A0V | 4.2 | 28.9 | … | D | 3e-8 | 0/:/:/0 | |
| B-16 | AT Mic AB (GJ 799A) | 20 41 51.16 | -32 26 06.8 | 10.2 | M4.5e | 3.3 | 29.4 | 10.9 | … | … | 0/:/:/0 | |
| B-17 | HD 199143AB | 20 55 47.67 | -17 06 51.0 | 48 | F8V | 1.1 | 30.6 | … | … | :/:/:/: | ||
| B-18 | HD 181327 | 19 22 58.94 | -54 32 17.0 | 51 | F5.5V | … | 29.4 | … | D | 1.5e-7 | 0/0/0/0 | Nil09,Leb12 |
| H-1 | HD 105 | 00 05 52.55 | -41 45 11.0 | 40 | G0V | … | … | … | D | 2e-9 | 0/:/:/0 | Nil10,M06 |
| H-2 | HD 1466 | 00 18 26.12 | -63 28 39.0 | 41 | F9V | … | 29.6 | … | D | 3e-10 | :/:/:/: | |
| H-3 | HD 2884/5 | 00 31 33.07 | -62 57 41.3 | 43 | B9V/F2V | 2.4/0.4 | 28.8 | … | D | … | :/:/:/: | Unassociated pair |
| H-4 | HD 3003 | 00 32 43.91 | -63 01 53.4 | 46 | A0V | 0.1 | 28.7 | … | D | 1e-10 | 0/:/:/0 | |
| H-5 | HD 3221 | 00 34 51.20 | -61 54 58.1 | 46 | K5V | … | 30.0 | 0.7 | … | … | :/:/:/: | |
| H-6 | HIP 3556 | 00 45 28.15 | -51 37 33.9 | 39 | M1.5 | … | … | 0.8 | … | … | :/:/:/: | |
| H-7 | HD 12039 (DK Cet) | 01 57 48.98 | -21 54 05.3 | 42 | G3/5V | 0.2 | 29.6 | … | D | 5e-10 | :/:/:/: | |
| H-8 | GSC8056-482 | 02 36 51.54 | -52 03 04.4 | 25 | M3Ve | … | 29.7 | 5.3 | … | … | :/:/:/: | |
| H-9 | HD 16978 ( Hyi) | 02 39 35.36 | -68 16 01.0 | 47 | B9V | … | … | … | … | … | :/:/:/: | |
| H-10 | HD 30051 | 04 43 17.20 | -23 37 42.0 | 58 | F2/F3IV/V | … | 29.8 | … | D | … | :/:/:/: | |
| H-11 | HD 44627 (AB Pic) | 06 19 12.91 | -58 03 15.5 | 46 | K2V | 5.5 | 30.0 | … | D | … | :/:/:/: | |
| H-12 | HD 53842 | 06 46 13.54 | -83 59 29.5 | 57 | F5V | … | … | … | D | … | :/:/:/: | |
| H-13 | HD 55279 | 07 00 30.49 | -79 41 46.0 | 64 | K3V | … | 29.9 | … | … | … | :/:/:/: | |
| H-14 | HD 202917 | 21 20 49.96 | -53 02 03.1 | 46 | G5V | … | 30.1 | … | D | 5e-9 | :/:/:/: | |
| H-15 | HIP 107345 | 21 44 30.12 | -60 58 38.9 | 42 | M1 | … | 29.4 | 1.4 | … | … | :/:/:/: | |
| H-16 | HD 224392 ( Tuc) | 23 57 35.08 | -64 17 53.6 | 49 | A1V | … | 29.3 | … | … | … | :/:/:/: | |
| A-1 | HD 9672 (49 Cet) | 01 34 37.78 | -15 40 34.9 | 59 | A4V | … | … | … | D? | 3e-7 | 0/1/0/0 | Hu08,Zu12 |
| A-2 | HD 31648 (MWC480) | 04 58 46.27 | +29 50 37.0 | 137 | A5V | … | 29.4 | … | gr.II | 3.6e-4 | 1/0/1/1 | Jet |
| A-3 | HD 32297 | 05 02 27.44 | +07 27 39.7 | 112 | A0 | … | … | … | D | 3e-6 | 0/0/0/0 | Ma08 |
| A-4 | HD 35187 | 05 24 01.17 | +24 57 37.6 | 114 | A2V/A7V | 1.4 | … | … | gr.II | 5e-5 | 1/0/0/0 | |
| A-5 | HD 36112 (MWC758) | 05 30 27.53 | +25 19 57.1 | 279 | A5IV | … | … | … | gr.I | 3e-5 | 1/0/1/0 | Cha08 |
| A-6 | HD 36910 (CQTau) | 05 35 58.47 | +24 44 54.1 | 113 | F2Ve | … | … | … | gr.II | 1e-5 | 1/0/1/0 | Cha08 |
| A-7 | HR 1998 ( Lep) | 05 46 57.34 | -14 49 19.0 | 22 | A2V | … | … | … | D | 3e-12 | 0/0/0/0 | Mo07 |
| A-8 | HD 97048 (CU Cha) | 11 08 03.34 | -77 39 17.5 | 158 | A0 | … | 29.5 | … | gr.I | 9.2e-4 | 1/1/1/0 | Ski04 |
| A-9 | HD 100453 | 11 33 05.58 | -54 19 28.5 | 121 | A9V | 1.1 | 28.8 | … | gr.I | 2.1e-4 | 1/0/0/0 | Co09 |
| A-10 | HD 100546 | 11 33 25.44 | -70 11 41.2 | 97 | B9V | … | 28.9 | … | gr.I | 2.9e-4 | 1/1/1/0 | Fei03,Gra05 |
| A-11 | HD 104237 (DX Cha) | 12 00 05.08 | -78 11 34.6 | 115 | A8 | sb | 30.2 | … | gr.II | 7.8e-5 | 1/0/0/0 | Jet. Fei03 |
| A-12 | HR 4796A (TWA11) | 12 36 01.0 | -39 52 10.2 | 73 | A0 | 7.8 | 29.4 | … | D | 1e-5 | 0/0/0/0 | Aug99 |
| A-13 | HD 135344B (SAO 206462) | 15 15 48.4 | -37 09 16.0 | 142 | F4V | … | 29.7 | … | gr.I | 1.6e-4 | 1/0/0/0 | Pon08 |
| A-14 | HD 139614 | 15 40 46.38 | -42 29 53.5 | 140 | A7V | … | … | … | gr.I | 2.7e-4 | 1/0/0/0 | Ack04 |
| A-15 | HD 141569 | 15 49 57.75 | -03 55 16.4 | 116 | B9.5V | (6?) | 28.1 | … | TO? | 1e-6 | 1/1/0/0 | Ste06 |
| A-16 | HD 142666 (V1026Sco) | 15 56 40.02 | -22 01 40.0 | 145 | A8V | … | … | … | gr.II | 1.6e-4 | 1/0/0/0 | |
| A-17 | HD 142527 | 15 56 41.89 | -42 19 23.3 | 233 | F6III | … | … | … | gr.I | 1.5e-3 | 1/0/0/0 | Ack04 |
| A-18 | HD 144668 (HR 5999) | 16 08 34.29 | -39 06 18.3 | 163 | A7IVe | 1.2 | 28.3 | … | gr.II | 9e-5 | 1/0/1/0 | Ste10 |
| A-19 | HD 150193 (MWC863) | 16 40 17.92 | -23 53 45.2 | 216 | A2IVe | 1.1 | 29.6 | … | gr.II | 2e-5 | 1/0/0/0 | Ste06 |
| A-20 | KK OphAB | 17 10 08.06 | -27 15 18.2 | 260 | A6/G5V | 1.6 | … | … | gr.II | 2e-5 | 1/1/1/0 | |
| A-21 | HD 158352 (HR 6507) | 17 28 49.65 | +00 19 50.2 | 60 | A7Vp | … | … | … | D | 2e-7 | 0/0/:/0 | Rh07 |
| A-22 | HD 158643 (51 Oph) | 17 31 24.95 | -23 57 45.5 | 124 | B9.5V | … | 29.0 | … | gr.II | 1e-6 | 1/0/0/0 | vdA01 |
| A-23 | HD 163296 (MWC275) | 17 56 21.29 | -21 57 21.9 | 119 | A1V | … | 29.6 | … | gr.II | 6.5e-4 | 1/0/1/1 | Jet. GS09,Till12 |
| A-24 | HD 169142 (MWC925) | 18 24 29.78 | -29 46 49.4 | 145 | A7V | 9.3 | 29.1 | … | gr.I | 2.4e-4 | 1/0/1/0 | Gra07,Meu10 |
| C-1 | DK Cha | 12 53 17.23 | -77 07 10.7 | 178 | F0 | … | 29.0 | 88 | II | 4.0e-3 | 1/:/:/0 | Ext.OI, jet. vK10 |
| C-2 | IRAS12500-7658 | 12 53 42.86 | -77 15 11.5 | 178 | M6.5 | … | 29.3 | 20 | I | … | 1/:/:/0 | |
| C-3 | Sz46N | 12 56 33.66 | -76 45 45.3 | 178 | M1 | … | 29.3 | 16 | II | 5.0e-5 | 0/:/:/0 | |
| C-4 | IRAS12535-7623 | 12 57 11.77 | -76 40 11.3 | 178 | M0 | … | 29.3 | 15 | II | 1.6e-4 | 0/:/:/0 | |
| C-5 | ISO-ChaII 13 | 12 58 06.78 | -77 09 09.4 | 178 | M7 | … | … | 101 | II | 1.6e-6 | 0/:/:/0 | |
| C-6 | Sz50 | 13 00 55.36 | -77 10 22.1 | 178 | M3 | … | 29.5 | 29 | II | 1.0e-3 | 1/:/:/0 | |
| C-7 | Sz51 | 13 01 58.94 | -77 51 21.7 | 178 | K8.5 | … | 29.5 | 102 | II | 5.0e-5 | 1/:/:/0 | |
| C-8 | C50 | 13 02 22.85 | -77 34 49.3 | 178 | M5 | … | … | 36 | II | 1.0e-6 | 0/:/:/0 | |
| C-9 | Sz52 | 13 04 24.92 | -77 52 30.1 | 178 | M2.5 | … | 30.9 | 48 | II | 8.0e-4 | 1/:/:/0 | |
| C-10 | Hn25 | 13 05 08.53 | -77 33 42.4 | 178 | M2.5 | … | 29.2 | 24 | II | 1.0e-5 | 0/:/:/0 | |
| C-11 | Sz53 | 13 05 12.69 | -77 30 52.3 | 178 | M1 | … | 29.0 | 46 | II | 1.0e-5 | 0/:/:/0 | |
| C-12 | Sz54 | 13 05 20.68 | -77 39 01.4 | 178 | K5 | … | 28.6 | 23 | II | 5.0e-4 | 1/:/:/0 | |
| C-13 | J130521.6-773810 | 13 05 21.66 | -77 38 10.0 | 178 | … | … | … | 29 | I-II | 1.0e-6 | 1/:/:/0 | embedded? |
| C-14 | J130529.0-774140 | 13 05 29.04 | -77 41 40.1 | 178 | … | … | … | … | II | … | 0/:/:/0 | |
| C-15 | C62 | 13 07 18.05 | -77 40 52.9 | 178 | M4.5 | … | … | 34 | II | 1.0e-5 | 0/:/:/0 | |
| C-16 | Hn26 | 13 07 48.51 | -77 41 21.4 | 178 | M2 | … | 29.1 | 10 | II | 1.0e-5 | 0/:/:/0 | |
| C-17 | Sz61 | 13 08 06.28 | -77 55 05.2 | 178 | K5 | … | 31.0 | 84 | II | 1.6e-3 | 1/:/:/0 | |
| C-18 | C66 | 13 08 27.17 | -77 43 23.2 | 178 | M4.5 | … | … | 30 | II | 1.0e-6 | 0/:/:/0 | |
| C-19 | Sz62 | 13 09 50.38 | -77 57 23.9 | 178 | M2.5 | 1.1 | 32.4 | 150 | II | 1.0e-6 | 0/:/:/0 |
Note. — Table A is ordered by association or group and then RA. Coordinates are the pointing position of the observations, and may be centred between multiple systems. Key to the naming convention is: T=Taurus, S=Upper Sco, E= Cha, W=TW Hya, B= Pic Moving group, H=Tuc Hor, A=Herbig AeBe stars and A stars with debris disks (noted in column 10 as D) and C=ChaII.
References. — Ack04 - Acke et al. (2004), Aug99 - Augereau et al. (1999), Cha08 - Chapillon et al. (2008), Co09 - Collins et al. (2009), Fei03 - Feigelson et al. (2003), Gra05 - Grady et al. (2005), Gra07 - Grady et al. (2007), GS09 - Günther & Schmitt (2009), Hu08 - Hughes et al. (2008), Leb12 - Lebreton et al. (2012), Ma08 - Maness et al. (2008), Meu10 - Meeus et al. (2010), Mo07 - Moerchen et al. (2007), M04 - Mamajek et al. (2004), M06 - Moór et al. (2006), Nil09 - Nilsson et al. (2009), Nil10 - Nilsson et al (2010), Po12 - Podio et al. (2012), Pon08 - Pontoppidan et al. (2008), Rh07 - Rhee et al. (2007), Riv12 - Riviere-Marichalar et al. (2012b), Ski04 - Skinner et al. (2004), Smi06 - Smith et al. (2006), SN03 - Song et al. (2003), Ste06 - Stelzer et al. (2006), Till12 - Tilling et al. (2012), Thi10 - Thi et al. (2010), vdA01 - van den Ancker et al. (2001), vK10 - van Kempen et al. (2010), Woi11 - Woitke et al. (2011), Zu12 - Zuckerman & Song (2012). Additional references are given in the text.