The spectral variability of quasar SDSS J030639.57+000343.1
Abstract
We compiled a sample of 60 quasars with spectroscopy on at least six epochs from the Sloan Digital Sky Survey (SDSS) to study the variabilities of the spectral shape, the continuum and the emission lines luminosity. In this paper, we present the results of SDSS J030639.57+000343.1. We found a strong anti-correlation between the continuum luminosity at and the spectral index, implying a bluer-when-brighter trend. The luminosity of the broad line is proportion to the continuum luminosity at . Correspondingly, we did not find strong correlation between the equivalent width of broad and the continuum luminosity, i.e. no baldwin effect of broad in this source.
keywords:
Galaxies: active - galaxies: individual: SDSS J030639.57+000343.1 - techniques: spectroscopic.1 Introduction
Quasars are one kind of powerful Active Galactic Nuclei (AGNs), characterized by strong and rapid variability (Schmidt 1969). There are extensive investigations on the continuum variability, especially in radio-loud AGNs (e.g., Fan et al. 1998; Ghosh 2000; Gu et al. 2011a,b), and two trends of color variation have been found. The Bluer-When-Brighter trend (BWB) was commonly found in blazars, and radio quiet AGNs as well (e.g., Wu et al. 2005; Gu et al. 2011a,b). However, the Redder-When-Brighter trend (RWB) has also been found (e.g., Gu et al. 2006; Bian et al. 2012).
From the multi-epoch spectra, the variabilities of the broad emission lines luminosity can be explored, in addition to those of the continuum luminosity and spectral shape. However, only few works have been done on the optical variabilities using multi-epoch spectroscopy. The variability of C iv lines has been studied for a sample of 105 quasars at two epochs (Wilhite et al. 2006). Recently, the spectral variability of FIRST bright quasars was investigated using SDSS spectra (Bian et al. 2012). We have compiled a large sample from SDSS with multi-epoch spectroscopy. As a first step, the spectral variability were explored for a sample with 6 epochs spectroscopy. In this paper, we present the results of SDSS J030639.57+000343.1.


2 Sample
We selected 7,063 quasars having spectra on at least two epochs from 105,783 SDSS DR7 quasars in Shen et al. (2011). As a first step to study the spectral variability, we choose a subsample of 60 quasars with 6 epochs spectroscopy, of which the redshift ranges from 0.08 to 3.78. Following Chen et al. (2009), the spectra was firstly corrected for the galactic extinction, then transferred to the rest frame. The continuum was fitted with a power-law, and the optical and UV Fe II features and the Balmer continuum were considered.
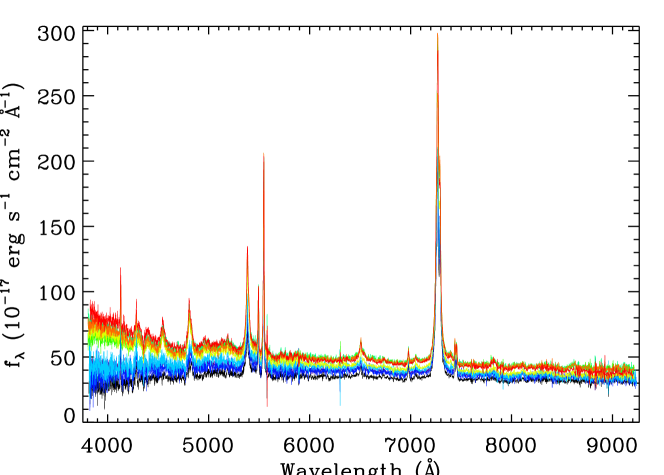
SDSS J030639.57+000343.1 () has been observed spectroscopically nine times in SDSS. The spectra is shown in Fig. 1. We fitted two bright emission lines (, ) each with two gaussians, one for the broad and the other for narrow profiles. Shen et al. (2011) estimated the black hole mass = , and the Eddington ratio = 0.24. The radio loudness is given as 5.32, where and are the flux density at 6 cm and 2500 at rest frame, respectively. Therefore, the source is likely a radio intermediate quasar, and the jet emission may not severely contaminate the optical continuum emission.
3 Results
We found a strong anti-correlation between the continuum luminosity at 5100Å and spectral index () with the Spearman rank correlation coefficient at 99.7 confidence level (Fig. 2, left). This implies the source is bluer when brighter, which is commonly found in our sample. A significant correlation was also found between the continuum luminosity at 5100Å and broad luminosity with r = 0.867 at confidence level of 99.7 (Fig. 2, right). A linear fit shows = (1.03 0.13) log () - (2.83 5.81). Consistent with this linear relation, we did not find significant correlation between the equivalent width of broad and the 5100Å continuum luminosity, i.e. no baldwin effect of broad in this source. We found similar results for broad . The comprehensive investigations on our whole sample will be presented in a forthcoming paper (Guo & Gu 2013, in prep.).
Acknowledgements
This work is supported by the 973 Program (No. 2009CB824800), and by the NSFC grant 11073039.
References
- Bian et al. (2012) Bian, W.-H., Zhang, L.,Green, R., & Hu, C. 2012, ApJ, 759, 88
- Chen et al. (2009) Chen, Z., Gu, M., & Cao, X. 2009, MNRAS, 397, 1713
- Fan et al. (1998) Fan, J. H., Xie, G. Z., Lin, R. G., & Qin, Y. P. 1998, A&AS, 133, 217
- Ghosh et al. (2000) Ghosh, K. K., Ramsey,B. D., Sadun, A. C., Soundararajaperumal, S., & Wang, J. 2000, ApJ, 537, 638
- Gu et al. (2006) Gu, M. F., Lee, C.-U., Pak, S., Yim, H. S., & Fletcher, A. B. 2006, A&A, 450, 39
- Gu & Ai (2011) Gu, M.-F., & Ai, Y. L. 2011a, A&A, 528, A95
- Gu & Ai (2011) Gu, M. F., & Ai, Y. L. 2011b, A&A, 534, A59
- Guo & Gu et al. (2013) Guo, H. X., Gu, M. F., in preparation
- Schmidt (1969) Schmidt, M. 1969,Contemporary Physics, Volume 1, 467
- Shen et al. (2011) Shen, Y., Richards, G. T.,Strauss, M. A., et al. 2011, ApJS, 194, 45
- Wilhite et al. (2006) Wilhite, B. C., VandenBerk, D. E., Brunner, R. J., & Brinkmann, J. V. 2006, ApJ, 641, 78
- Wu et al. (2005) Wu, J., Peng, B., Zhou, X.,et al. 2005, AJ, 129, 1818