841
A. Del Moro
New insights on the distant AGN population
Abstract
Current X-ray surveys have proved to be essential tools in order to identify and study AGNs across cosmic time. However, there is evidence that the most heavily obscured AGNs are largely missing even in the deepest surveys. The search for these obscured AGNs is one of the most outstanding issues of extragalactic astronomy, since they are expected to make a major contribution to the high energy peak of the X-ray background (XRB) and might constitute a particularly active and dusty phase of black hole and galaxy evolution. Using a newly developed SED fitting technique to decompose the AGN from the star-formation emission in the infrared band we identify a sample of 17 IR bright quasars at . For the majority of these sources the X-ray spectrum is well characterised by an absorbed power law model, revealing that % of the sources are unabsorbed; the remainder of these IR quasars have moderate-to-high absorption ( cm-2), and 25% are not detected in the X-rays and are likely to be Compton thick ( cm-2). We therefore find a much higher fraction of obscured than unobscured quasars, indicating that a large fraction of the luminous black hole accretion was very heavily obscured at .
keywords:
Galaxies: active - Quasars: general - X-rays: galaxies - Infrared: galaxies - Galaxies: star formation1 Introduction
The search for obscured and unobscured AGNs has been one of the main focusses of extragalactic astrophysics of the past decades. Since massive black holes (BHs) are hosted in almost 100% of the galaxy bulges in the local Universe (e.g. Magorrian et al. 1998), it is clear that tracing the whole AGN population at all redshifts is essential to understand the growth and evolution of galaxies.
The X-ray band offers a very effective way to trace the growth of BHs, since emission from galaxies is much fainter at these high energies and the radiation can penetrate large amounts of gas and dust without significant absorption. However, even the deepest X-ray surveys fail to observe and identify a large part of the most obscured AGNs (Compton thick, with column densities cm-2; e.g. Worsley et al. 2005). A large population of the most obscured AGNs is predicted to reproduce the spectrum of the X-ray background (XRB; e.g., Comastri et al. 1995; Gilli et al. 2007; Treister et al. 2009) at high energies ( keV) and might represent a particular phase in the BH-galaxy evolutionary scenarios (e.g., Di Matteo et al. 2005; Hopkins et al. 2006).

To identify the most obscured AGNs we thus resort to the infrared (IR) and radio bands (see Del Moro et al. 2013, for details on the radio AGN selection), where extinction has only small effect on the heated dust emission. However, star formation can dominate the spectral energy distribution (SED) in these bands, and mask the emission from the AGN. Through our newly developed SED decomposition technique (Del Moro et al. 2013) we are able to disentangle the AGN and star-formation components in the IR band in distant star-forming galaxies () and effectively identify AGNs that are often undetected in X-rays. We perform this analysis in the GOODS-Herschel North field, revealing a population of luminous IR quasars at . About 25% of these bright quasars are not detected in the X-rays and therefore might be very heavily obscured.
2 Infrared quasars in star-forming galaxies
2.1 IR spectral energy distribution
In our study we use some of the deepest IR Spitzer and Herschel data available to date, covering 160 arcmin2 of the GOODS-North field. We perform a detailed SED decomposition analysis in the IR band for all of the Spitzer 24 m detected sources in the GOODS-Herschel North field with spectroscopic or photometric redshift out to (1825 sources; see Del Moro et al. 2013, for details). The SEDs are constrained using the Spitzer 8, 16 and 24 m and the Herschel 100, 160 and 250 m data points. We use an empirically defined template to model the AGN IR emission and 5 templates to represent the star-formation emission (Fig. 1); the details of the decomposition method and the models used in this analysis are described in Del Moro et al. (2013).
From the resulting best-fitting models we calculate the rest-frame 6 m luminosity of the AGN (removing the galaxy contribution), which gives us an estimate of the intrinsic power of the AGN, since the IR emission is only lightly affected by extinction. Where the AGN component is not reliably constrained in our SED fitting, we estimate an upper limit for the AGN luminosity from the total 6 m luminosity obtained from the best-fit models (see Fig. 2). We significantly identified AGN emission in the IR band in 12% (212 sources) of the 24 m detected sources (Del Moro et al. 2013, in prep.).
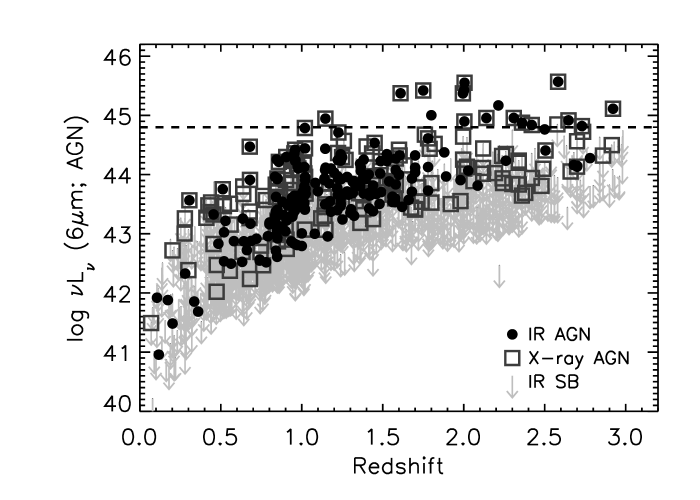
2.2 IR quasars identification
From the results obtained from our SED decomposition we identified a sample of 17 bright AGNs with mid-IR luminosity erg s-1 at redshift (see Fig. 2), corresponding to an intrinsic luminosity in the X-ray band of erg s-1 (using the relation for local unabsorbed AGN, e.g., from Lutz et al. 2004), i.e. in the quasar regime. Almost all of these sources (14/17; i.e. 82%) have spectroscopic redshift identification from optical and near-IR spectroscopy and 5 of them are classified as broad-line (BL) AGN in the optical band. For 53% of our IR quasars (9/17) Spitzer-IRS spectra are available (e.g. Kirkpatrick et al. 2012), which agree remarkably well with our best-fitting models for the source SEDs (see Fig. 1); this is an important confirmation that our SED fitting approach is reliable and that the mid-IR AGN luminosities measured from the AGN components are fairly accurate.
3 Heavily obscured accretion at
Most of the IR quasars in our sample (13/17; 76%) are detected in the deep 2 Ms Chandra data (Alexander et al. 2003), while 4 IR quasars remain undetected in the X-ray band. On the basis of the X-ray spectral analysis we have 10 X-ray luminous AGNs ( erg s-1), which have well characterised X-ray spectral properties ( and cm-2); all of these sources have 400 X-ray counts (including the 5 quasars classified as BL AGNs). These sources comprise unabsorbed and moderately absorbed quasars and are easily detected in moderate-depth X-ray surveys (but require deep X-ray surveys to accurately characterise the moderately absorbed systems). The remaining 3 X-ray detected quasars have erg s-1 and flatter X-ray spectral slopes () than those observed for the more luminous AGNs; the X-ray spectral properties of these sources are more difficult to measure, most likely because (1) they are fainter and have poorer count statistics than the X-ray luminous quasars (all have 400 X-ray counts) and (2) they are probably more heavily obscured and cannot be easily characterised by a simple absorbed power law model, since components such as reflection will affect the shape of the X-ray emission (see Alexander et al. 2011, for a likely similar source population). The 4 X-ray undetected IR bright quasars are only identified here as luminous AGNs on the basis of the presence of AGN emission in the infrared SED.
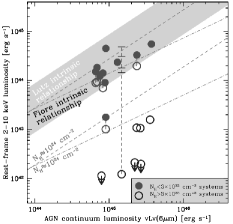
In Figure 3 we compare the X-ray luminosity and upper limits measured for our IR quasars with the mid-IR luminosity obtained from the IR SED fitting, and find that the moderately obscured ( cm-2) and unobscured sources follow nicely the relation observed for local unabsorbed AGNs (e.g. Lutz et al. 2004; Fiore et al. 2009). The remaining quasars lie far below the relation, indicating that the X-ray luminosity of these sources must be highly suppressed, possibly by Compton-thick material along the line of sight.
4 Discussion
Amongst our sample we find that 5 of the 17 IR quasars are identified as BL AGNs; these sources are similar to those typically found in optical quasar searches such as SDSS. The other 13 sources are obscured quasars, of which 5 are moderately obscured and 7 are likely to be heavily obscured. This means that there are potentially 2.5 times more obscured quasars than unobscured quasars in our sample. This fraction is much higher than those found in many previous studies (1; e.g. Ueda et al. 2003; La Franca et al. 2005; Hasinger 2008), indicating that most of the luminous BH growth was very heavily obscured at .
5 Summary
Through detailed SED analysis in the IR band of all of the 24 m detected sources in the GOODS-Herschel North field, we identify a population of IR bright quasars at . The X-ray spectral analyses reveal that moderate-to-heavily obscured AGNs outnumber unabsorbed AGNs by a factor of 2.5, a much higher fraction than those found in previous studies, suggesting that the IR selection of bright quasars is able to reveal the most obscured accretion at . We are now extending our analyses to the GOODS-South field to increase the source statistics and the constraints on the space density and properties of these highly obscured IR quasars.
Acknowledgements.
We gratefully acknowledge support from the STFC Rolling Grant (ADM; DMA). This work is based on observations made with Herschel, a ESA Cornerstone Mission with significant participation by NASA.References
- Alexander et al. (2011) Alexander, D. M., Bauer, F. E., Brandt, W. N., et al. 2011, ApJ, 738, 44
- Alexander et al. (2003) Alexander, D. M., Bauer, F. E., Brandt, W. N., et al. 2003, AJ, 126, 539
- Comastri et al. (1995) Comastri, A., Setti, G., Zamorani, G., & Hasinger, G. 1995, A&A, 296, 1
- Del Moro et al. (2013) Del Moro, A., Alexander, D. M., Mullaney, J. R., et al. 2013, A&A, 549, A59
- Di Matteo et al. (2005) Di Matteo, T., Springel, V., & Hernquist, L. 2005, Nature, 433, 604
- Fiore et al. (2009) Fiore, F., Puccetti, S., Brusa, M., et al. 2009, ApJ, 693, 447
- Gilli et al. (2007) Gilli, R., Comastri, A., & Hasinger, G. 2007, A&A, 463, 79
- Hasinger (2008) Hasinger, G. 2008, A&A, 490, 905
- Hopkins et al. (2006) Hopkins, P. F., Hernquist, L., Cox, T. J., et al. 2006, ApJS, 163, 1
- Kirkpatrick et al. (2012) Kirkpatrick, A., Pope, A., Alexander, D. M., et al. 2012, ApJ, 759, 139
- La Franca et al. (2005) La Franca, F., Fiore, F., Comastri, A., et al. 2005, ApJ, 635, 864
- Lutz et al. (2004) Lutz, D., Maiolino, R., Spoon, H. W. W., & Moorwood, A. F. M. 2004, A&A, 418, 465
- Magorrian et al. (1998) Magorrian, J., Tremaine, S., Richstone, D., et al. 1998, AJ, 115, 2285
- Treister et al. (2009) Treister, E., Urry, C. M., & Virani, S. 2009, ApJ, 696, 110
- Ueda et al. (2003) Ueda, Y., Akiyama, M., Ohta, K., & Miyaji, T. 2003, ApJ, 598, 886
- Worsley et al. (2005) Worsley, M. A., Fabian, A. C., Bauer, F. E., et al. 2005, MNRAS, 357, 1281