Measured Radiation and Background Levels During Transmission of Megawatt Electron Beams Through Millimeter Apertures
Abstract
We report measurements of photon and neutron radiation levels observed while transmitting a 0.43 MW electron beam through millimeter-sized apertures and during beam-off, but accelerating gradient RF-on, operation. These measurements were conducted at the Free-Electron Laser (FEL) facility of the Jefferson National Accelerator Laboratory (JLab) using a 100 electron beam from an energy-recovery linear accelerator. The beam was directed successively through 6 mm, 4 mm, and 2 mm diameter apertures of length 127 mm in aluminum at a maximum current of 4.3 mA (430 kW beam power). This study was conducted to characterize radiation levels for experiments that need to operate in this environment, such as the proposed DarkLight Experiment. We find that sustained transmission of a 430 kW continuous-wave (CW) beam through a 2 mm aperture is feasible with manageable beam-related backgrounds. We also find that during beam-off, RF-on operation, multipactoring inside the niobium cavities of the accelerator cryomodules is the primary source of ambient radiation when the machine is tuned for 130 operation.
keywords:
background radiation , beam transmission , energy recovery linac , megawatt electron beam , millimeter aperture , multipactoring1 Introduction
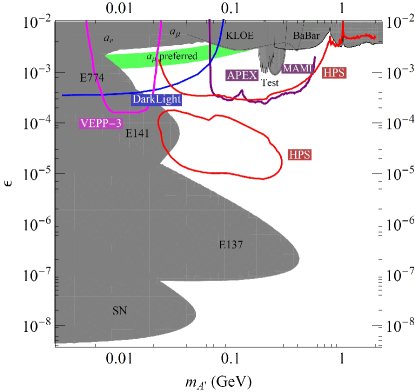
The high-quality electron beam capabilities of JLab’s accelerators at CEBAF and the Free-Electron Laser facility [1] have been incorporated into dark matter detection proposals based on predictions of Freytsis et al. [2]. Taken together, the experiments will search for a scalar boson in the mass range to 1.0 . Three experiments (APEX [3], HPS [4, 5], and DarkLight [6]) are either underway or are preparing to explore complementary regions of parameter space as indicated in Fig. 1.
The DarkLight experiment plans to study - scattering in a windowless, internal gas target at the JLab FEL. Beam-related and ambient background radiation levels at the FEL need to be characterized.
Here we report measurements performed in spring and summer 2012 including a high-power beam transmission test through millimeter-diameter apertures. This demonstrated that transmission of a half-megawatt electron beam through a 2 mm diameter, 127 mm long aperture in an aluminum block (simulating operation of the DarkLight gas target) was feasible without excessive energy loss from resistive wall heating (wakefield effects) or from beam halo interception in the block. It also allowed photon and neutron radiation levels to be studied. Companion papers [8, 9] address the beam loss and heating effects; here, we address the radiation measurements.
2 Experimental set-up
Measurements were carried out in the shielded vault of the Jefferson Laboratory FEL. The FEL consists of an injection system including a drive laser, an energy recovery linear accelerator (ERL) with superconducting RF cavities, beam lines, and recirculation arcs. The ERL produces an electron beam of up to 130 energy and up to 1 MW power. The electron beam can drive either of two beam lines. One is configured to produce infrared (IR) light, the other to produce ultraviolet (UV) light. After traversing either beam line, the beam is returned to the ERL for energy extraction.
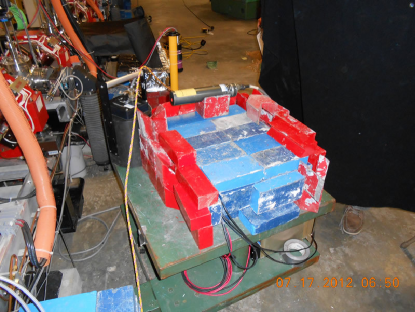
For the transmission test, a 6-port vacuum chamber test fixture was constructed containing a movable aluminum target block with three apertures of 6 mm, 4 mm, and 2 mm diameter, each 127 mm in length. The 2 mm aperture approximates the geometry of the entrance and exit ports of the proposed DarkLight windowless gas target, where the narrow aperture is used to restrict gas flow from the target into the beam line vacuum. Diagnostics were fitted on the aperture block, including a temperature sensor, a YAG crystal with a dynamic range for measuring the beam halo, and an optical transition radiation (OTR) silicon sensor for measuring the beam profile. Additional beam line diagnostics and viewers were used as well. For the transmission test, the fixture containing the aluminum aperture block was installed in the FEL IR beam line, along with additional quadrupoles and other beam line components. Ambient radiation measurements (those without the test fixture installed) were made using the IR and UV beam lines.
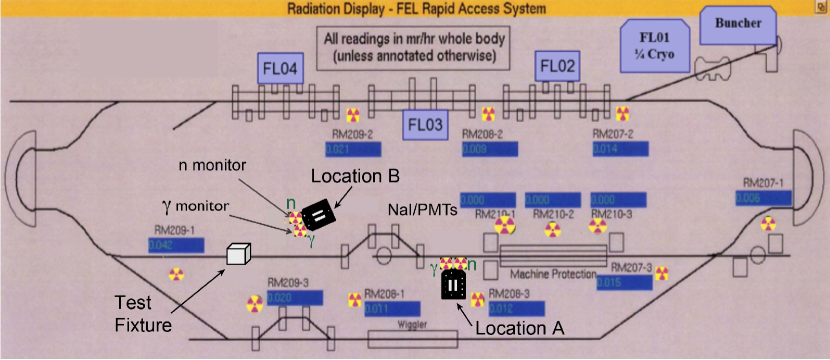
Three radiation monitoring systems were installed in the FEL vault for this study: a pair of NaI/PMT detectors (with 2-inch and 3-inch diameter NaI crystals, respectively), each inside a lead-shielded enclosure constructed with standard 2-inch x 4-inch x 8-inch lead bricks, an unshielded neutron monitor (Canberra NP100B counter, designated RM212_p1) and an unshielded gamma monitor, a xenon-filled ion chamber (Canberra IP100, designated RM212_p2). The NaI/PMT detectors were calibrated and adjusted to count photons from 300 to 15 . All three systems were located on a movable cart (see Fig. 2). The NaI/PMT detectors were read out by spectroscopy amplifiers at the cart, with high-level signals sent to MCAs in laboratory space outside the vault. The gamma and neutron monitors were read out by the FEL radiation protection monitoring system. Table 1 lists the detectors used in this study. See Fig. 3 for their locations in the vault and relative to the test fixture, IR and UV beam lines, and linac cryomodules.
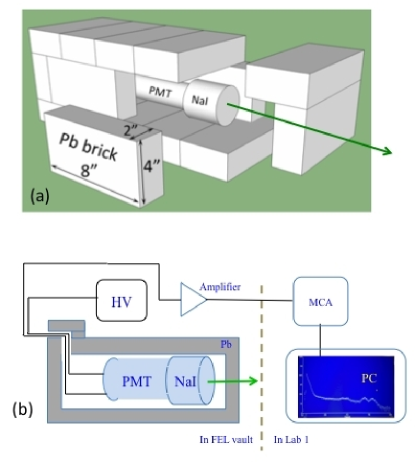
Ambient background data were taken while the cart was positioned near the mid-point of the IR beam line (Location A in Fig. 3). Radiation data with the test fixture installed were taken with the cart at a location further upstream on the IR line and approximately 1.9 m downstream of the test fixture, at to the side (Location B). Fig. 4 shows the shielding configuration for the NaI/PMT detectors.
Monitor Type Location during transmission test RM212_p1 neutron 1.9 m downstream of test fixture RM212_p2 photon 1.9 m downstream of test fixture 2 inch NaI — 1.9 m downstream of test fixture 3 inch NaI — 1.9 m downstream of test fixture
Run Aperture Duration Beam Charge Average # diameter power delivered current 1 6 mm 22 min 0.384 MW 5.1 C 3.84 mA 2 4 mm 30 min 0.393 MW 7.1 C 3.93 mA 3 2 mm 124 min 0.425 MW 31.6 C 4.25 mA 4 2 mm 413 min 0.422 MW 121 C 4.22 mA
3 Radiation level measurements
Radiation measurements were made for various machine configurations: beam-on, with the test fixture containing the aperture block in place on the beam line; beam-on, without the test fixture and aperture block; and beam-off, but with accelerating gradient RF applied to the cryomodules.
3.1 Ambient measurements without the aperture block
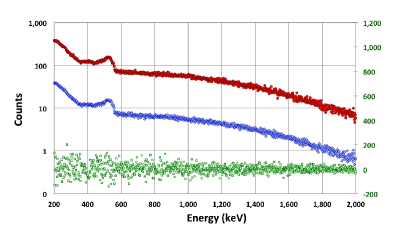
To study ambient backgrounds in the vault (without the test fixture installed), a set of measurements was made during beam-on running, with electrons in the UV line, and again during beam-off, but accelerating-gradient-on, running. NaI/PMT spectra obtained under these running conditions are shown in Fig. 5. The beam-on spectrum is shown in blue, and the beam-off, RF-on spectrum in red. The small difference between them (shown in green) demonstrates that the ambient radiation in the FEL vault for this particular machine tune is not associated with the presence of electrons in the machine. Rather, when the electron beam is properly tuned for maximum energy recovery and 130 beam energy, as was the case here, the source of the ambient radiation is multipactoring in the RF cryomodules [10]. Multipactoring occurs when field emission pulls electrons from the niobium surface of a cryomodule and these electrons are accelerated, then impact the cavity wall and release more electrons and potentially photons and neutrons as well, depending on the gradient. The process can then repeat.
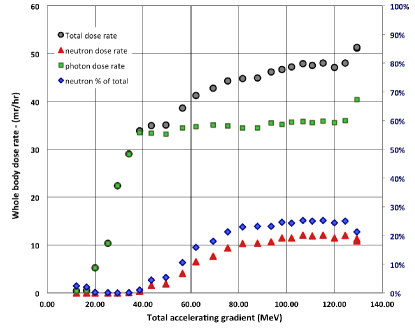
A series of radiation measurements were made as a function of accelerating gradient. The RM212_p1 (neutron) and RM212_p2 (photon) counters were used to measure dose rates, which are shown in Fig. 6 as a function of RF accelerating gradient. Starting with the accelerator tuned for stable operation at 130 , and with no electrons in the machine, RF cavities were turned off sequentially, working back towards the injector. After each section was turned off, radiation levels were recorded. Neutrons are seen to be responsible for about one quarter of the dose rates when the RF power is set up for accelerated energy greater than 100 . These measurements were made with the RM212 monitors at Location A.
We note that this setup—tuning the linac for maximum energy—tends toward the worst-case scenario in terms of production of photon and neutron backgrounds by multipactoring. However, the amount of radiation can be managed by balancing the machine tune to provide the required beam energy, stable energy recovery, and satisfy any other considerations that may be present. Also, over time, RF cavities become more susceptible to field emission. Replacement of cavities exhibiting more pronounced field emission can reduce the radiation levels.
3.2 Measurements with the aperture block
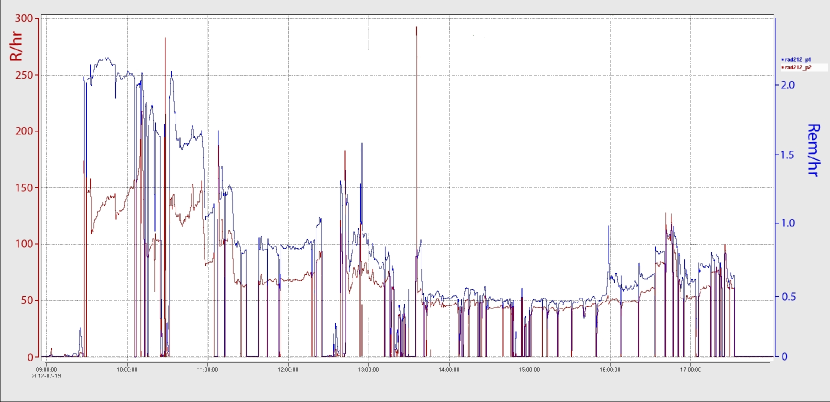
Several runs were carried out with the test fixture and its aperture block installed on the IR beam line. Table 2 lists four of these runs. Starting with the 6 mm aperture and progressing to the 4 mm and finally to the 2 mm aperture, the tests were conducted with an initially low charge/bunch and repetition rate. These were then increased while maintaining machine tune for minimum beam loss. Radiation background data were recorded for each test, along with the temperature change in the block and machine parameters. The tests varied in length from 15 minutes to 2 hours, with a final long run (Run 4) using the 2 mm aperture lasting 7 hours and delivering 121 C through the aperture. Fig 7 shows the recorded radiation levels for the photon and neutron monitors listed in Table 1.
Stable operation with minimal beam loss was achieved at each aperture step. The beam parameters at each step were 100 MeV electron energy, 53–60 pC/bunch, 4.0–4.3 mA beam current, 75 MHz bunch frequency, 400–430 kW beam power, and 70 m beam spot size at the aperture block (20 cm beta function at r.m.s. emittance of ). The beam profile and halo were measured during low duty cycle, pulsed-beam runs.
The temperature increase of the 1 kg aluminum block during beam operation, along with the cooling rate during beam-off time, allow calculation of the average power deposited in the block. When combined with the total beam power, the fractional beam loss can be determined. See Ref. [8] for a more detailed discussion. Table 3 shows beam losses ranging from 1.3 ppm to 6.8 ppm.
Run Aperture Run Average Neutron dose Photon dose # diameter duration beam loss rate at Loc. B rate at Loc. B 1 6 mm 22 min 1.3 ppm 0.24 rem/hr 13 R/hr 2 4 mm 30 min 2.1 ppm 0.43 rem/hr 19 R/hr 3 2 mm 124 min 6.8 ppm 1.32 rem/hr 75 R/hr 4 2 mm 413 min 2.8 ppm 0.58 rem/hr 60 R/hr
Table 3 also lists values of the photon and neutron backgrounds. As operational experience was gained, backgrounds decreased during each run. In Run 4, the photon dose rate downstream of the test fixture started near 150 R/hr, decreased to around 40 R/hr as the tune was improved, then remained stable to the end of the run. Neutron production based on beam loss calculations with the 2 mm aperture ranged from 0.6 rem/hr to 1.3 rem/hr.
4 Background Modeling
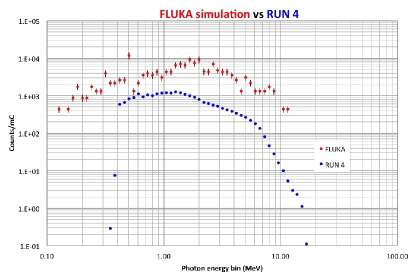
A simulation of the transmission test using the 2 mm aperture was made using FLUKA[11, 12] to compare with the measured NaI/PMT data. The simulation, which modeled incident , included the aluminum aperture block, an approximation of the beam line and its components to a distance of 3 m downstream of the aperture block, and the lead enclosure around the detectors. The FLUKA photon spectrum inside the shielded enclosure is shown in Fig. 8 along with the NaI/PMT data. A simulation of the NaI/PMT detector response was not included, nor was the detector response to the neutron component. Within this approximation, however, acceptable agreement between the two spectra over the energy range covered by the detectors ( –15 ) is found.
5 Operational lessons learned
The beam test provided an opportunity to stress the operation of the FEL energy recovery linac under high power, CW runs of up to several hours in duration. It was found that, while the machine tune was somewhat critical, it was relatively straightforward to transmit the beam through the aperture with minimal loss.
Stability of the ERL was generally good, but there were a number of of trips of the machine (See Fig. 7 for Run 4), mostly of short duration. During CW operation, a few outages up to of 10 to 30 minutes occurred when a cavity lost phase lock and had to be re-tuned, or when the phases drifted and CW operation had to be interrupted to re-phase. Phase drift was compounded by high outside ambient temperatures on some days, with correspondingly higher vault ambient temperature, which affected stability of some components. Beam trips occurred for a variety of reasons, including an RF control module that needed replacement; instabilities induced by “pinging” of a cryomodule with the beam, causing it to trip; and phase-lock faults in the drive laser associated with the high ambient temperatures. Operational stability improved during the week as experience was gained.
6 Summary
The DarkLight beam transmission test demonstrated the feasibility of sustained CW operation of the JLab FEL ERL at high power (430 kW) with a 70 m beam spot on a 2 mm diameter target aperture similar to that proposed for the DarkLight gas target. Data on beam loss, wall heating, and radiation backgrounds were obtained. Average beam losses were less than 7 ppm for all aperture sizes. Radiation backgrounds downstream of the test fixture were measured and provide information useful for design of the DarkLight detector. Experience in operating the machine in this configuration was obtained and techniques for machine tuning and beam diagnostics developed. The test demonstrated that the JLab FEL is capable of meeting the needs of the DarkLight experiment. Beam optical qualities are already very good.
Machine stability should be improved by planned upgrades to the FEL. These upgrades include a new injector, use of a smaller drive laser beam spot, reducing the bunch charge to 30 pC/pulse, and switching to a longer (80 cm) beta function. Installation and operation of the DarkLight detector will allow implementation of a transport system solution that—in addition to providing an appropriately configured beam at the target—provides a phase space exchange analogous to that normally used in the IR side of the machine. This type of exchange has been demonstrated to suppress the beam break-up (BBU) instability and to allow operation at very high current.
Measurements were obtained of photon and neutron backgrounds produced by the FEL when running under conditions similar to what will be the case when a gas target is installed for DarkLight. Of several reference runs using the three different apertures, the 7 hour, 2 mm aperture Run 4 was the most stringent, delivering 121 C total. On average during the latter half of Run 4, photon and neutron radiation backgrounds downstream of the test fixture were around 50 R/hr whole-body dose for photons and 0.4 rem/hr whole-body dose for neutrons. Numerous lessons were learned about machine operation at high current and high power, including that decreases in radiation backgrounds were obtained by improved tuning of the machine during the course of a run.
A good deal was learned about ways to improve performance and reduce backgrounds. One example is beam break-up (BBU). Usually BBU is eliminated by use of a rotator, but during the transmission test a rotator normally used for this purpose had been replaced by the test fixture and associated components. An alternative was found: shifting the beam energy to a slightly lower value eliminated the BBU.
7 Acknowledgements
We gratefully acknowledge the outstanding efforts of both the staff of the Jefferson Laboratory to deliver the high quality FEL beam and the staff of the MIT-Bates Research and Engineering Center who designed, constructed and delivered the test target assembly. The research is supported by the United States Department of Energy Office of Science.
Notice: Authored by Jefferson Science Associates, LLC under U.S. DOE Contract No. DE-AC05-06OR23177. The U.S. Government retains a non-exclusive, paid-up, irrevocable, world-wide license to publish or reproduce this manuscript for U.S. Government purposes. This work supported by the Commonwealth of Virginia and by DOE under contract DE-AC05-060R23177.
8 Appendix: NaI/PMT photon measurements
As part of the ambient radiation measurements, additional spectra were taken under identical conditions except for the amount of lead shielding: 2 inches and 4 inches surrounding the NaI/PMT detectors. Analysis of these data provides information that may be useful when planning any experiment to be conducted in the vault’s radiation environment.
8.1 Effective attenuation
A mono-energetic photon beam traversing material 222For this discussion and unless otherwise specified, lead will be the attenuating material for photons. is attenuated by several processes. At low energies, attenuation is dominated by the photoelectric effect. At higher energies the Compton effect is dominant. At still higher energies, pair production takes over. These effects overlap and the resulting attenuation can be expressed as:
| (1) |
where is the mass attenuation coefficient for photon energy , , is the density of lead (11.35 gm/cm3), and is the thickness of lead. A photon spectrum can be considered to be the sum of mono-energetic photons of energy , where represents the channel number (or energy bin) over the detection range. Photons in each channel will be attenuated according to the above equation.
We measured the spectrum for two thicknesses and 4 inches: Run A and Run B, respectively. Note that the four-inch-thick box can be treated as two 2-inch thick boxes, one inside the other. The natural log of the ratio of the two spectra yields:
| (2) |
or
| (3) |
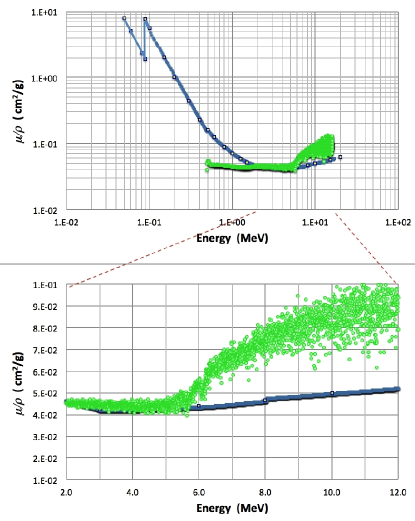
Using the two spectra, Run A and Run B, in equation (3) yields the results shown in Fig. 9.
8.2 Neutron spectrum derived from photon spectrum
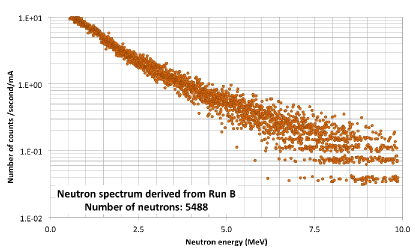
Up until the threshold, the effective attenuation of ambient photons is approximately constant. Assuming that this would be the case if there were no neutron production, then above threshold the liberated neutron would have kinetic energy equal to the difference between the photon energy and the binding energy of the neutron. Thus a neutron spectrum can be obtained from Run-B as shown in Fig. 10.
8.3 511 keV Peak
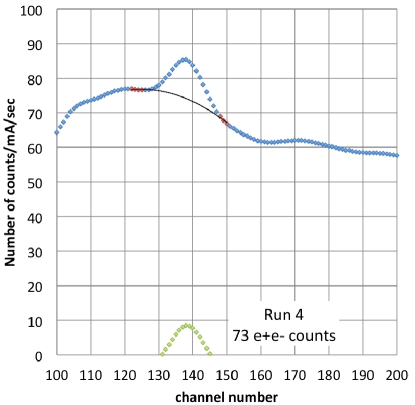
At the low energy end of the photon spectrum in Fig. 11 there is a peak near 511 keV. This is due to pair production from high energy photons that have penetrated the shielding and pair produce at the inner surface of the lead box. Of course, pair production is occurring throughout the transit through the shielding but the lead shielding absorbs the 511 keV photons before they are seen in the NaI.
8.4 Final Observations
The four-inch thick shielding can be thought of as a two-inch thick shielding box that is an analog Monte Carlo spectrum generator of an incident photon flux for the inner 2 inches of lead. Further, this takes into account the actual running conditions that are only approximated by a computer generated model.
In the FLUKA comparison with Run 4, the onset of is seen in the change in slope of Run 4’s data about 6 MeV. Note that the FLUKA spectrum does not show this effect.
Close comparision of the slopes before and after the peak of both spectra shows the effect of pile-up in Run 4’s spectrum. The main reason for setting a lower level discriminator threshold so that only data above a few hundred keV, was to reduce the pile-up and dead time during collection of the spectra.
References
- Neil et al. [2006] G. Neil, C. Behre, S. Benson, M. Bevins, G. Biallas, et al., The JLab high power ERL light source, Nucl.Instrum.Meth. A557 (2006) 9–15.
- Freytsis et al. [2010] M. Freytsis, G. Ovanesyan, J. Thaler, Dark Force Detection in Low Energy Collisions, JHEP 1001 (2010) 111.
- Abrahamyan et al. [2011] S. Abrahamyan, et al. (APEX Collaboration), Search for a New Gauge Boson in Electron-Nucleus Fixed-Target Scattering by the APEX Experiment, Phys.Rev.Lett. 107 (2011) 191804.
- Adrian [2013] P. H. Adrian, The Heavy Photon Search Experiment (2013). ArXiv:1301.1103 [physics.ins-det].
- Johnson et al. [2012] T. Johnson, et al., Heavy Photon Search Experiment (2012). Accessible at http://confluence.slac.stanford.edu/display/hpsg/.
- Balewski et al. [2012] J. Balewski, et al., A Proposal for the DarkLight Experiment at the Jefferson Laboratory Free Electron Laser, Technical Report, 2012. Accessible at http://dmtpc.mit.edu/DarkLight/DarkLightProposal_PAC39.pdf.
- Hewett et al. [2012] J. Hewett, H. Weerts, R. Brock, J. Butler, B. Casey, et al., Fundamental Physics at the Intensity Frontier (2012). ArXiv:1205.2671 [hep-ex].
- Tschalär et al. [2013] C. Tschalär, R. Alarcon, S. Balascuta, S. Benson, W. Bertozzi, J. Boyce, et al., Transmission of High-Power Electron Beams Through Small Apertures (2013). Submitted to Nucl. Inst. Meth.
- Alarcon et al. [2013] R. Alarcon, S. Balascuta, S. Benson, W. Bertozzi, J. Boyce, et al., Transmission of Megawatt Relativistic Electron Beams Through Millimeter Apertures (2013). ArXiv:1305.0199, submitted to Phys.Rev.Lett.
- Myneni and Hutton [2008] G. Myneni, M. Hutton, SRF Technology-Past, Present and Future Options, Conf.Proc. C0806233 (2008) MOPP130.
- Battistoni et al. [2007] G. Battistoni, S. Muraro, P. R. Sala, F. Cerutti, A. Ferrari, et al., The FLUKA code: Description and benchmarking, AIP Conf.Proc. 896 (2007) 31–49.
- Ferrari et al. [2005] A. Ferrari, P. R. Sala, A. Fasso, J. Ranft, FLUKA: A multi-particle transport code (Program version 2005) (2005). CERN-2005-010, SLAC-R-773, INFN-TC-05-11.
- Hubbell and Seltzer [2004] J. Hubbell, S. Seltzer, Tables of X-Ray Mass Attenuation Coefficients and Mass Energy-Absorption Coefficients (version 1.4) [Online], National Institute of Standards and Technology, Gaithersburg, MD., 2004. Available: http://physics.nist.gov/xaamdi [Tuesday, 28-May-2013 18:14:48 EDT].