Sedimentation stability and aging of aqueous dispersions of Laponite in the presence of cetyltrimethylammonium bromide
Abstract
This work discusses the sedimentation stability and aging of aqueous suspension of Laponite in the presence of cetyltrimethylammonium bromide (CTAB). The concentration of Laponite was fixed at the constant level %wt, which corresponds to the threshold between equilibrium gel IG1 and repulsive gel IG2 phases. The concentration of CTAB was within 0-0.3 %wt. In the presence of CTAB the Laponite aqueous suspensions were unstable against sedimentation and they separated out into upper and bottom layers (U- and B-layers, respectively). The dynamic light scattering technique revealed that the addition of CTAB even at rather small concentration, %wt (), induced noticeable changes in the aging dynamics of U-layer, and it was explained by equilibration of CTAB molecules that were initially non-uniformly distributed between different Laponite particles. Accelerated stability analysis by means of analytical centrifugation with rotor speed rpm revealed three sedimentation regimes: continuous (I, %wt), zone-like (II, %wt) and gel-like (III, %wt). It was demonstrated that B-layer was "soft" in the zone-like regime. The increase of resulted in its supplementary compressing and the collapse of "soft" sediment above certain critical centrifugal acceleration.
I Introduction
Nowadays the aqueous suspensions of Laponite disks attract great fundamental interest as model colloidal systems with complex aging dynamic and nonergodic arrested states Kegel and Lekkerkerker (2011); Ruzicka et al. (2011); Ruzicka and Zaccarelli (2011). Phase diagrams of these suspensions were extensively studied, discussed and revisited in recent years Mourchid et al. (1995, 1998); Bonn et al. (1999); Levitz et al. (2000); Ruzicka et al. (2004a, b); Mongondry et al. (2005); Ruzicka et al. (2006); Cummins (2007); Jabbari-Farouji et al. (2008); Kegel and Lekkerkerker (2011); Ruzicka et al. (2011); Ruzicka and Zaccarelli (2011). They are commonly specified in terms of three main variables: concentration of Laponite, , concentration of ionic component, , and time of aging, . Depending on , the following main phase states were observed in pure Laponite suspensions (i.e., at ) with long aging time (months, years) Kegel and Lekkerkerker (2011); Ruzicka et al. (2011); Ruzicka and Zaccarelli (2011):
-
•
mixed state of separated sol and gel phases ( %wt),
-
•
stable gel, equilibrium gel IG1 (1 %wt %wt),
-
•
Wigner glass or repulsive gel IG2 (2 %wt %wt),
-
•
nematic gel (>3 %wt).
Addition of ionic components to Laponite suspensions intensify their ageing and results in a decrease in the time of transition into the arrested state. E.g., addition of NaCl up to the level above 20 mM accelerates aggregation and sedimentation processes and makes suspensions turbid even at low Laponite concentrations Nicolai and Cocard (2000, 2001a). The time of transition into the arrested state also directly depends on and . Very interesting is the phase behaviour of Laponite suspensions in the presence of surfactant ions that lead to an organic modification of clay particles Hanley et al. (1997); Patil et al. (2008).
The alkylammonium salts are widely used as organic modifier since they have high ability to adsorb on the Laponite surface Liu et al. (2010); Zhang et al. (2008). Previous studies indicated that introduction of cetyltrimethylammonium bromide (CTAB) in aqueous Laponite suspensions caused fast aggregation of Laponite particles and violate sedimentation stability of suspensions. At certain threshold concentration of CTAB ( , where is the cation exchange capacity of Laponite), separation of CTAB+Laponite suspensions into clear upper (U) and turbid bottom (B) layers was observed Zhang et al. (2008). In this work, the 1-week aged Laponite suspensions were diluted by CTAB solutions. However, the Laponite suspensions are unstable against aging Abou et al. (2001); Guillermic et al. (2009); Joshi et al. (2008); Knaebel et al. (2000); Labanda and Llorens (2008); Martin and Thomas (2012); Shahin and Joshi (2012), so, the aging processes may influence the phase behaviour and sedimentation separation of CTAB+Laponite suspensions.
In this paper, the detailed study of the sedimentation stability and ageing of aqueous suspensions of disk-like Laponite particles in the presence of CTAB surfactant was done. The concentration of Laponite was fixed at a rather high level of %wt that roughly corresponded to the the boundary between isotropic or equilibrium gel IG1 and repulsive or Wigner glass gel IG2 phases. The concentration of CTAB was %wt ( ). The dynamic light scattering technique revealed that introduction of CTAB even in a rather small concentration, %wt, induced the noticeable changes in the aging dynamics of Laponite suspensions. The express analysis of sedimentation stability was done using analytical centrifugation technique with the rotor speed varied within 500-4000 rpm. Different sedimentation regimes that were dependent on CTAB concentration were revealed and discussed.
II Materials and methods
II.1 Materials
The formula of CTAB (Fluka, Germany, 99.5 %wt) is C16H33N(CH3)3Br. The molar mass of CTAB is g/mol, the length of its molecule is nm, and its critical micelle concentration (CMC) in water is %wt Zhang et al. (2008).
The formula of Laponite RD (Rockwood Additives Ltd., UK) is Na[(Si8Mg5.5Li0.4O20(OH)4]. It is composed of charged disk-like sheets with thickness about nm and average diameter about nm Lap (1990). The crystal structure of Laponite consists of octahedrally coordinated magnesium oxides sandwiched between two sheets of tetrahedrally coordinated silica. According to literature data, specific surface area , determined by adsorption of methylene blue, and density of Laponite were equal to m2/g and kg/m3, respectively. In aqueous suspensions, the Laponite particles are charged highly heterogeneously. Their faces have constant negative charge, while the positive charge of their edges is pH-dependent. The negative surface charge of Laponite RD, defined as cation exchange capacity (CEC), is equal to meq/g. The positive charges are generally screened by the diffuse part of the double electric layer of Laponite faces. Their values decrease with a pH increase and they are neutralized at pH Martin et al. (2002); Tawari et al. (2001).
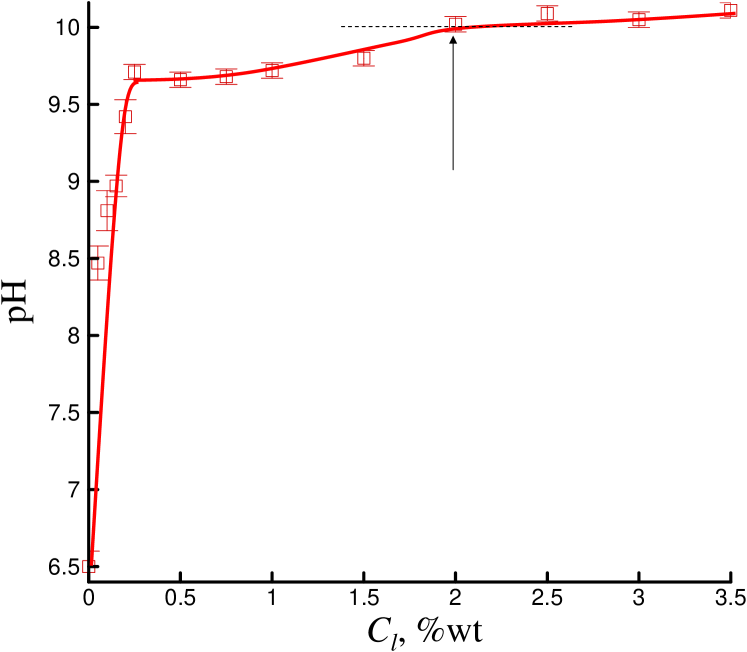
The Laponite powder was used for preparation of suspensions. It was dissolved in deionized ultrapure water (MilliQ, conductivity of 18.2 S/cm) and then vigorously stirred during, at least, 20-30 minutes until reaching a homogeneous and transparent suspension. The pH of suspensions increased with increase of Laponite concentration (Fig. 1), however, it stabilized at the level of pH for concentrations above 2 %wt. It is known that at smaller pH values Laponite particles may undergo exposure to dissolution, caused by CO2, dissolved in the sample, that gets it from the ambient air Mourchid et al. (1998); Thompson and Butterworth (1992). However, the high level of pH that was used in this work allowed to expect that the particles were stable during the experiments Bonn et al. (1999).
To prepare the CTAB+Laponite suspensions, CTAB and Laponite solutions in deionized ultrapure water (MilliQ) were mixed and vigorously stirred during, at least, 30 minutes. The final concentration of Laponite, , was fixed at 2 %wt and concentration of CTAB, , was varied within 0-0.3 %wt. The value of ( %wt) is related with CTAB concentration in suspension, expressed as a multiple of the clay (0.75 mmol/g) and concentration of Laponite ( %wt), through the following equation
| (1) |
i.e., at %wt.
II.2 Instrumentation
II.2.1 Dynamic light scattering
Dynamic light scattering (DLS) experiments were performed using ALV-5000 digital autocorrelator and HeNe laser with wavelength nm. The scattered intensity was measured as a function of decay time (1 -10 s) and scattering vector , where is the refractive index of the solvent and is the scattering angle. The second-order autocorrelation function was defined as
| (2) |
In order to remove the effect of large aggregates, the suspensions were preliminary filtered (0.45 , Millipore Millex AA) Bonn et al. (1999).
II.2.2 Analytical centrifugation
The sedimentation stability was investigated using analytical photocentrifuge LUMiSizer 610.0-135 (L.U.M. GmbH, Germany) that consisted of a centrifugal rotor with 12 optical cells, a light source (pulsed near-infrared light-emitting 880 nm diode and a light sensor). The operating principle of the analytical photocentrifuge is based on the measurement of profiles of light transmission though the cell with the studied sample Lerche and Sobisch (2007). The value of was measured continuously at various radial positions of the sample . Mean light transmission, averaged over the height of the sample , and volume-weighted cumulative distribution function of the particle size were calculated using a SepView 5.1 software (L.U.M. GmbH). Evolution of transmission profiles and increase of mean light transmission through the cell reflect continuous clarification of suspension, caused by settling of the Laponite aggregates in the centrifugal field.
The aqueous suspensions, weighting 0.4 g, were subjected to centrifugation in the rectangular polycarbonate optical cells, supplied by the photocentrifuge manufacturer. The optical path length was 2 mm and cross-sectional area was m2. The initial height of the sample in the cell was equal to m. The radial distance from the axis of rotation to the centrifugal cell bottom was 130 mm. Centrifugation experiments were carried out at different rotor speeds rpm. The centrifugal acceleration at the bottom of the cell may be calculated as
| (3) |
where m/s2 is the gravity of the Earth.
II.2.3 Statistical analysis
All the experiments were repeated, at least, three times. The Table Curve 2D software (Jandel Scientific, San Rafael, CA) was used to smooth the data and to determine their standard deviations. Mean and standard deviations were presented in the figures as error bars.
III Results and discussion
III.1 Sedimentation stability and aging in Earth gravity
Sedimentation stability in Earth gravity was checked by analyzing the photographs of fresh (a) and 24 h aged (b) suspensions with different concentrations of CTAB (Fig.2). The fresh suspensions were visually homogeneous. However, even at small concentration of CTAB (above %wt ), they became turbid and unstable. The relatively fast separation of suspensions, few hours aged, was observed. Finally, suspensions were separating out into the bottom (turbid) and upper (clear) phases, the volume of the bottom phase was continuously growing with increase and any suspension became turbid at %wt.
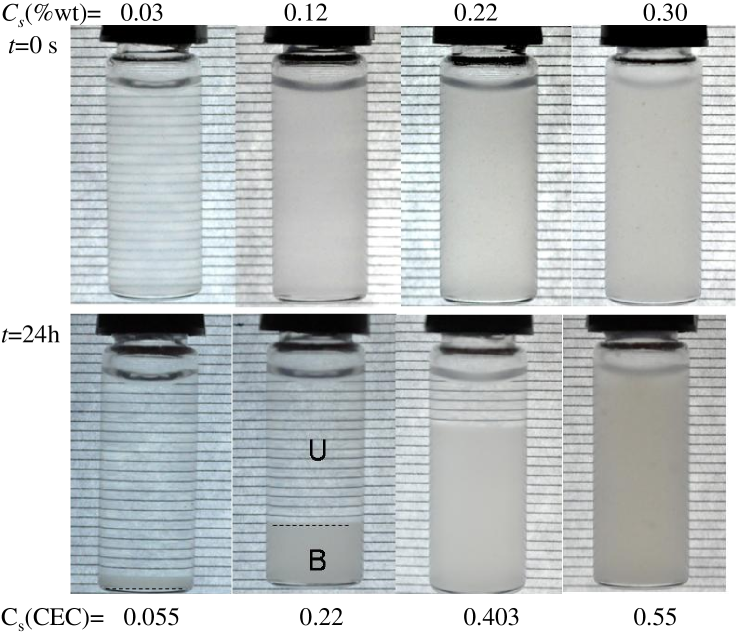
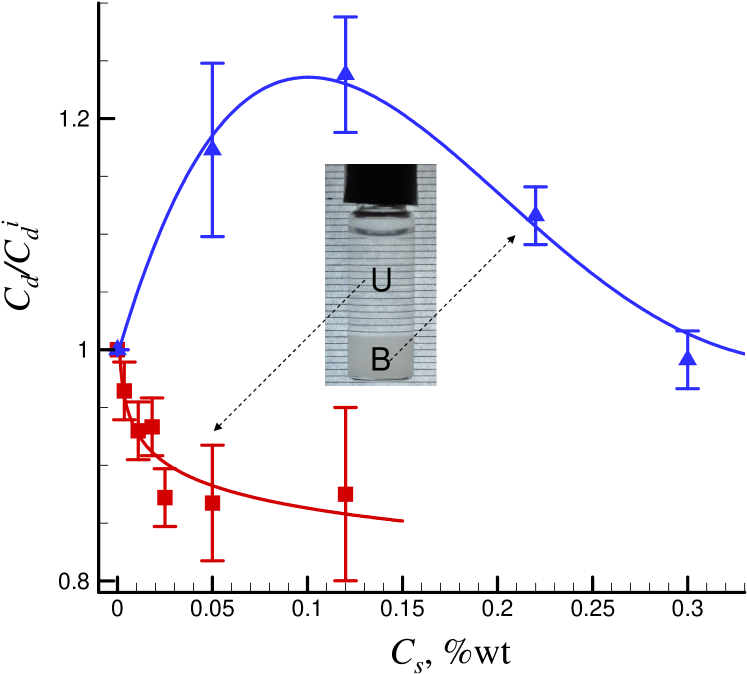
Complementary analysis has shown that solid contents were different in the upper and bottom layers (U- and B-layers, respectively) (Fig. 2). The concentration of solids (i.e., the total concentration of Laponite and CTAB in water) was determined by separation of these layers and drying in desiccator for 24 h at 453 K. Figure 3 presents ratio versus concentration of CTAB, , in U- and B-layers of 24 h aged suspensions. Here, is the solid concentration in the fresh suspension.
The concentration of solids, , was noticeably smaller in U- layer than in B- layer. However, concentrations of solids both in U- and B-layers were high. The observed separation of layers may reflect separation of phases with different contents of Laponite and CTAB. It is possible that less concentrated U-layer and more concentrated B-layer represent the phases of different non-ergodic states.
Note that our observations contradict to the phase behaviour of CTAB+Laponite suspensions described earlier Zhang et al. (2008), where phase separation was not observed for small concentration of ( ). However, it is not surprising, because another aging procedure was used in the reference Zhang et al. (2008). In order to clarify the possible effects of aging of the Laponite suspension, the dynamic light scattering (DLS) investigation were done at concentration of CTAB %wt. At such low CTAB concentration, the phase separation processes were insignificant, the bottom layer was very thin and the aging dynamics, probably, reflected the aging processes in the U-layer.
Figure 4 presents examples of the second order autocorrelation function, , versus the decay time, , for freshly prepared and 360 h aged suspensions in the absence (solid lines) and presence (dashed lines) of CTAB. The introduction of CTAB evidently affected the shape of the autocorrelation function and aging dynamics. Supplementary analysis has shown that the shape of may be well fitted using the following function
| (4) |
that was previously used to describe gelation process in the aqueous Laponite suspensions Abou et al. (2001); Cummins (2007); Ferse et al. (2007); Jabbari-Farouji et al. (2008); Nicolai and Cocard (2000, 2001b); Rosta and von Gunten (1990); Ruzicka et al. (2004b).
This function represents the weighed sum of exponential and stretched exponential contributions that corresponds to the fast (single particles or small aggregates) and slow (the structural rearrangement of the system or large aggregates) motions. Here, the constant represents the coherence factor, and are the relaxation times of fast and slow motions, respectively, and are the amplitudes of these modes, and the stretching parameter accounts for the polydispersity of aggregates. The value of corresponds to monosized aggregates. The mean relaxation time was calculated as Ruzicka et al. (2004b)
| (5) |
where is the usual Euler gamma function.
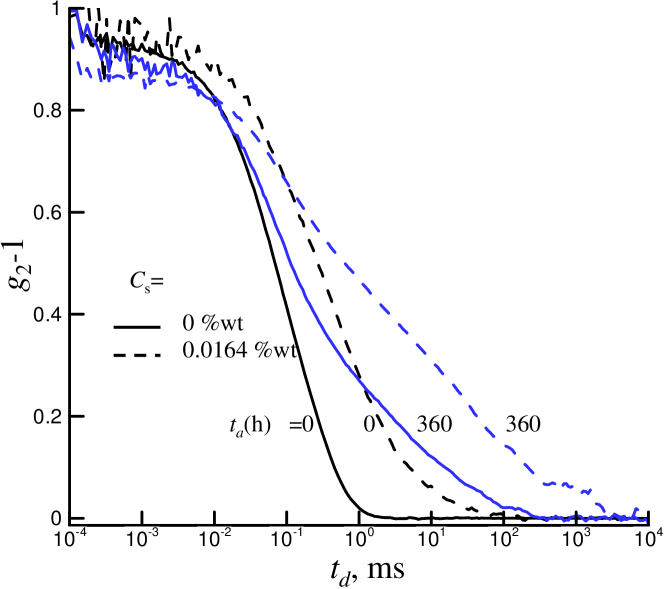
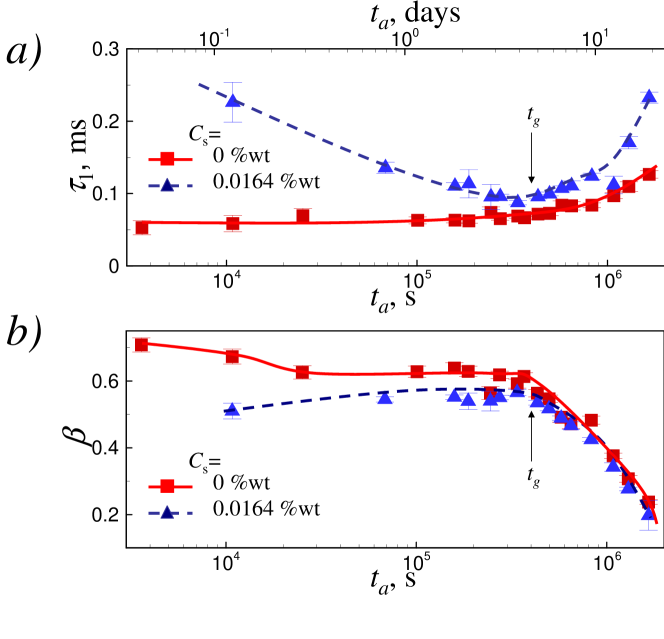
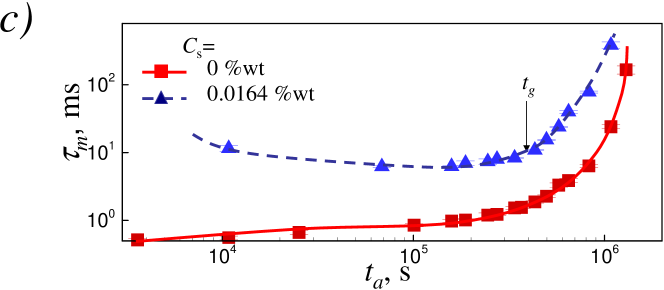
Figure 5 presents the effect of the time of aging (0-460 h) on parameters , , and . In pure Laponite suspensions with Laponite concentration 2 %wt, which corresponds to the boundary between phases IG1 and IG2 Ruzicka et al. (2011), the aging resulted in increase of polydispersity, and both of relaxation time, and . The most pronounced effects on , and were observed at s (6-12 days) that was in correspondence with commencement of gelation, observed earlier for salt-free Laponite suspensions Ruzicka et al. (2004b). From the other side, dependences , , demonstrated the presence of extremums at s ( 6 days) in the presence of CTAB. The character of these dependences at long time of aging () also can be explained by gelation processes. However, at early stages before gelation (i.e., at ) the aging resulted in decrease of polidispersity and relaxation times , . The observed behaviour may be attributed to equilibration of CTAB molecules. Initial mixing of solutions of Laponite and CTAB may result in nonuniform distribution of CTAB molecules between different Laponite particles. During the process of equilibration in the course of the aging, the values of , , were approaching those representative for the CTAB-free suspensions (Fig.5). It may reflect more homogeneous distribution of CTAB. The data on versus dependencies during gelation (i.e., at ) were fitted using the scaling equation Ruzicka et al. (2004b)
| (6) |
and the following values were obtained for the most important fitting parameters: , h ( %wt) and , h( %wt).
The data obtained for pure 2 %wt Laponite suspension in the absence of CTAB were in reasonable correspondence with data of reference Ruzicka et al. (2004b)(, h) and evidenced that suspension was non-ergodic phase IG2 at this concentration. Introduction of CTAB resulted in acceleration of gelation processes. However, the value of was still large and noticeably exceeded the values, characteristic for IG1 phase (). So, it may be concluded, that introduction of CTAB at %wt not affected the state of repulsive gel IG2, that is inherent for the pure Laponite suspension at %wt.
III.2 Accelerated stability analysis by analytical centrifugation
In order to avoid aging processes, the accelerated stability analysis using the technique of analytical centrifugation was done.
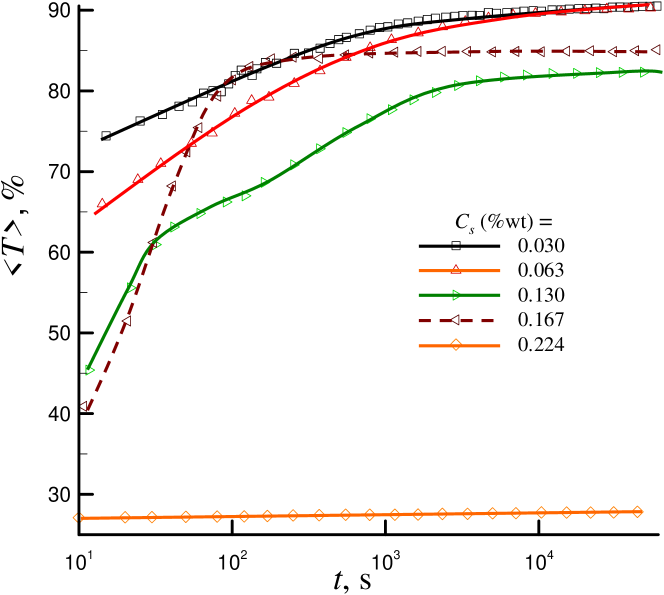
Figure 6 presents examples of mean light transmission versus time of centrifugation for different concentrations of CTAB, and the same rotor speed rpm (). In such sedimentation at relatively high acceleration, the separation of bottom phase (similar to that observed in Fig. 2) was occurred practically instantly. Further time evolution of reflected the changes in U- and B-layers. The transmission decreased (and turbidity increased) with increase of at low concentrations of CTAB ( %wt). In the course of centrifugation, the values of smoothly increased and reached saturation at ( 3 h). More accelerated time evolution of was observed in the concentration interval between 0.14 %wt and 0.2 %wt the (see, e.g., %wt in Fig. 6) and, finally, the value of was practically constant in the course of sedimentation at above 0.2 %wt ( ).
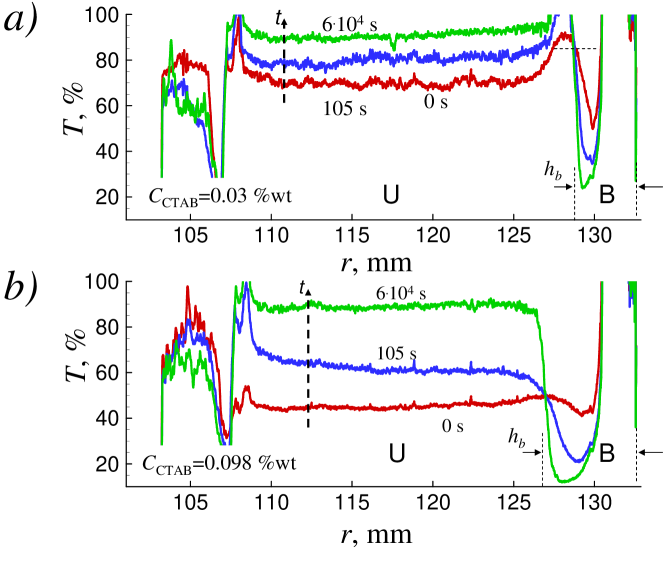
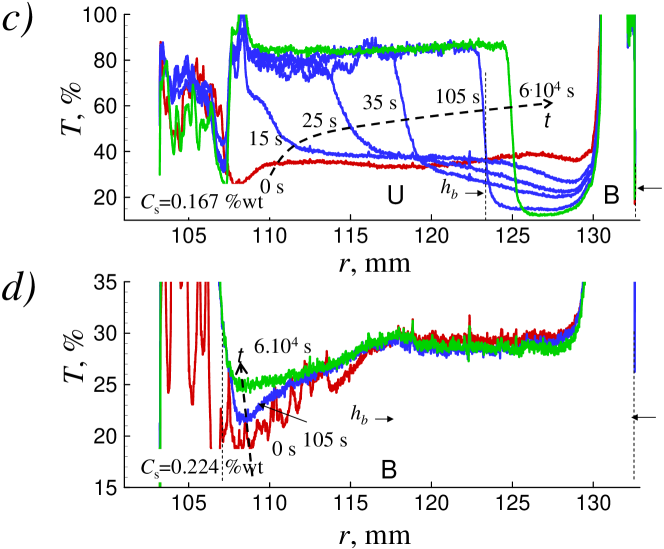
Figure 7 presents the examples of light transmission profiles in the course of sedimentation at different CTAB concentrations =0.03 %wt (a), 0.098 %wt (b), 0.167 %wt (c), 0.224 %wt(d) and at the same rotor speed rpm. At low concentrations of CTAB ( %wt), the height of B-layer was practically constant (Fig. 7a,b) during sedimentation. Transmissions of the U- and B-layers continuously increased and decreased, respectively. The transmission profiles inside U-layer were approximately homogeneous at low concentrations of CTAB. For definiteness this sedimentation regime may be called as continuous-like (I).
However, the evolution of transmission profiles became more complex at certain critical concentration ( %wt). At the initial moment, the thickness of the B-layer phase reached the value comparable with the height of suspension . The value of decreased and the bottom phase got compressed in the course of sedimentation, i.e. it was "soft" (Fig. 7c). The noticeable effects of zone-like (II) sedimentation were observed only at small time intervals ( s). The level of transmission was approximately the same inside the U-layer and noticeably lowered inside the B-layer, i.e., the B-layer was becoming more and more dense. Finally, behaviour of the profiles became stable at long time of sedimentation ( s).
The "rigid" B-layer was formed at CTAB concentrations above %wt ( ). For example, at %wt, the relative height and light transmission of the B-layer were practically constant in the course of sedimentation and only small changes in light transmission of the U-layer were observed (Fig. 7d). The "rigid" B-layer can be identified as a gel phase. For definiteness, this sedimentation may be called as gel-like (III) regime.
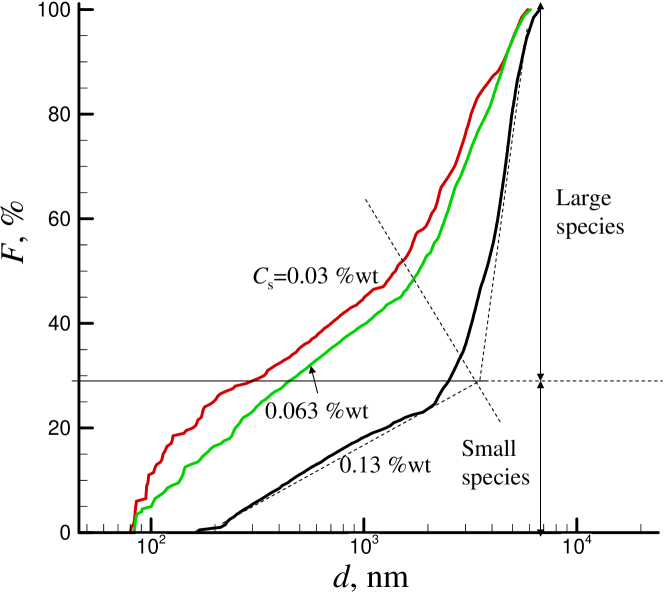
Figure 8 shows the volume-weighted cumulative distribution function , determined from U-layer sedimentation data at rpm for CTAB concentration interval between 0.03 %wt and 0.13 %wt. The observed shape of evidently reflected the presence of large and small species in CTAB+Laponite suspensions. The fraction of large species (they may correspond to the large aggregates of Laponite) continuously increased with increase of . The critical concentration of transition to the zone-like sedimentation ( %wt), possibly, reflects transformation of the CTAB+Laponite suspension to the state with dominance of large aggregates.
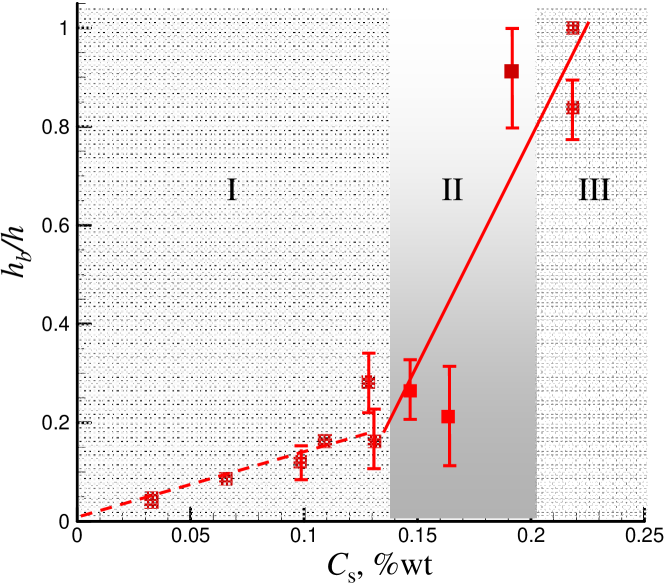
Figure 9 presents the relative height of the B-layer hb/h versus CTAB concentration . The total time of centrifugation was s and rotor speed was rpm. The different CTAB concentration ranges correspond to the regimes of continuous (I), zone-like (II) and gel-like (III) sedimentation. It is interesting that the height of B-layer increased linearly with increase of within the range of continuous (I) sedimentation:
| (7) |
where .
The supplementary ramping experiments have shown that the height of the "soft" B-layer in the regime of zone-like sedimentation (II) was sensible to the centrifugal acceleration (see, Eq.2). In these experiments, the centrifugation was done with sequential increase of the rotor speed rpm ( ), 2000 rpm ( ), 3000 rpm ( ), and 4000 rpm( ). The centrifugation time at the given was rather long and sufficient to obtain the stabilized light transmission profiles.
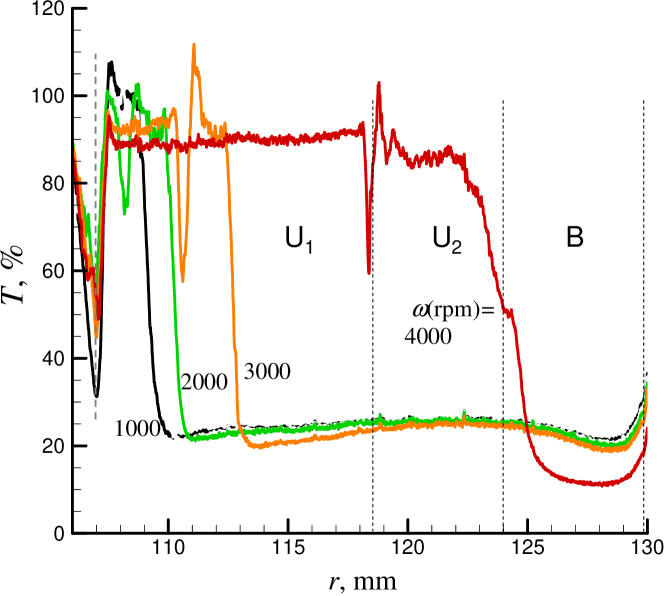
Figure 10 shows the examples of light transmission profiles , obtained in these experiments for %wt, which corresponds to regime zone-like (II) sedimentation. It is remarkable that increase of resulted in supplementary compressing of the B-layer. Moreover, light transmission profiles, obtained at rpm, revealed the spike within the U-layer (Fig. 9). It evidently reflects the presence of two phases within the U-layer denoted as U1 and U2. The nature of these phases is still unclear and requires more thorough investigation in future.
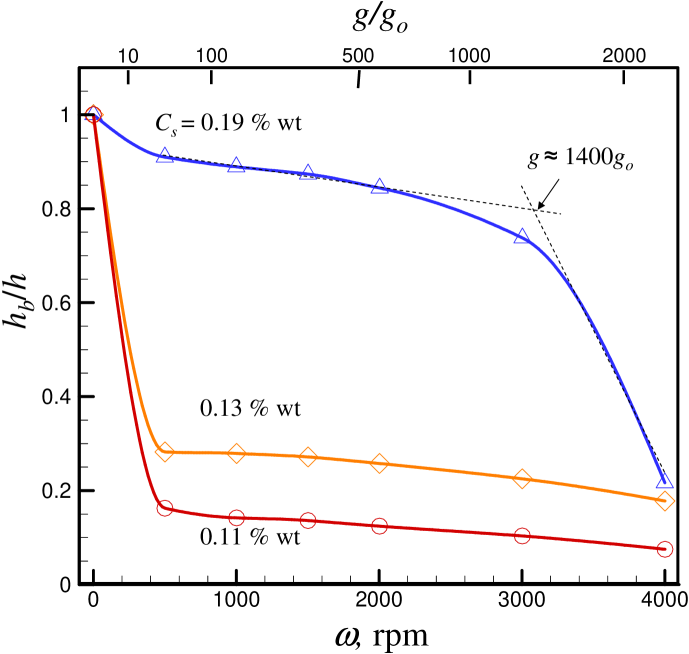
The differences between the regimes of continuous (I) and zone-like (II) were clearly manifested in dependence of the relative height of the B-layer versus rotor speed (Fig. 11). In these experiments, the time of centrifugation was constant, hours. The value of decreased ( linearly) as value of increased for CTAB concentrations that correspond to the regime of continuous (I) sedimentation ( %wt, Fig. 9). For higher concentrations of CTAB that correspond to the regime of zone-like (II) sedimentation (0.14 %wt 0.20 %wt), the collapse of the "soft" B-layer layer was observed at certain centrifugal acceleration. E.g., this collapse was observed at for %wt (Fig. 11). It corresponded to the critical damage of "soft" B-layer under the compression, caused by centrifugal acceleration.
IV Conclusions
This paper discusses sedimentation stability and aging of aqueous suspensions of Laponite in the presence of CTAB. The concentration of Laponite ( %wt) was corresponding to the boundary between IG1 and IG2 gels Ruzicka et al. (2011). Both of these phases are stable against sedimentation and unstable against aging Joshi et al. (2008); Knaebel et al. (2000); Labanda and Llorens (2008). It is expected that adsorption of CTAB on the surface of Laponite can increase its hydrophobicity and size of aggregates and decrease sedimentation stability of its suspensions. In Earth gravity, the sedimentation stability of suspension was violated even at small concentration of CTAB, suspension became turbid and separated into upper and bottom layers (U- and B-layers, respectively). The dynamic light scattering (DLS) technique revealed that introduction of CTAB even in rather small concentration, %wt (), induced noticeable changes in aging dynamics of U-layer. The most pronounced aging effects were observed after 6-12 days and they reflected commencement of gelation. At early stages before gelation, the anomalous behaviour of DLS was observed in the presence of CTAB. It may be attributed to equilibration of CTAB molecules nonuniformly distributed between different Laponite particles. The obtained data evidence that CTAB accelerates gelation. Accelerated stability analysis by means of analytical centrifugation revealed three sedimentation regimes: continuous (I, %wt), zone-like (II, %wt) and gel-like (III, %wt). The B-layer was "rigid" in the I-st and III-rd regimes and "soft" in the II-nd -regime. In the regime of continuous sedimentation (I-st regime), the fraction of large aggregates in the U-layer and the height of B-layer increased with increase of . The height of the "soft" B-layer in the regime of zone-like sedimentation was sensible to the value of rotor speed . Increase of resulted in supplementary compressing of B-layer and spitting of the upper layer into U1 and U2 layers. Moreover, the collapse of the "soft" B-layer at certain critical centrifugal acceleration was observed.
Acknowledgements.
VS would like to acknowledge the support the Institute Charles Sadron, National Center of Scientific Research of France and Ministry of Education and Science of Ukraine (grand 014/60-SP). The authors also thank Dr. N.S. Pivovarova for her help with the manuscript preparation.References
- Kegel and Lekkerkerker (2011) W. K. Kegel and H. N. W. Lekkerkerker, Nature Materials 10, 5 (2011).
- Ruzicka et al. (2011) B. Ruzicka, E. Zaccarelli, L. Zulian, R. Angelini, M. Sztucki, A. Moussaid, T. Narayanan, and F. Sciortino, Nature Materials 10, 56 (2011).
- Ruzicka and Zaccarelli (2011) B. Ruzicka and E. Zaccarelli, Soft Matter 7, 1268 (2011).
- Mourchid et al. (1995) A. Mourchid, A. Delville, J. Lambard, E. Lécolier, and P. Levitz, Langmuir 11, 1942 (1995).
- Mourchid et al. (1998) A. Mourchid, E. Lécolier, H. Van Damme, and P. Levitz, Langmuir 14, 4718 (1998).
- Bonn et al. (1999) D. Bonn, H. Kellay, H. Tanaka, G. Wegdam, and J. Meunier, Langmuir 15, 7534 (1999).
- Levitz et al. (2000) P. Levitz, E. Lecolier, A. Mourchid, A. Delville, and S. Lyonnard, Europhysics Letters 49, 672 (2000).
- Ruzicka et al. (2004a) B. Ruzicka, L. Zulian, and G. Ruocco, Journal of Physics C16, S4993 (2004a).
- Ruzicka et al. (2004b) B. Ruzicka, L. Zulian, and G. Ruocco, Physical Review Letters 93, 258301 (4 pages) (2004b).
- Mongondry et al. (2005) P. Mongondry, J. F. Tassin, and T. Nicolai, Journal of Colloid and Interface Science 283, 397 (2005).
- Ruzicka et al. (2006) B. Ruzicka, L. Zulian, and G. Ruocco, Langmuir 22, 1106 (2006).
- Cummins (2007) H. Z. Cummins, Journal of Non-Crystalline Solids 353, 3891 (2007).
- Jabbari-Farouji et al. (2008) S. Jabbari-Farouji, H. Tanaka, G. Wegdam, and D. Bonn, Physical Review E78, 61405 (2008).
- Nicolai and Cocard (2000) T. Nicolai and S. Cocard, Langmuir 16, 8189 (2000).
- Nicolai and Cocard (2001a) T. Nicolai and S. Cocard, European Physical Journal E5, 221 (2001a).
- Hanley et al. (1997) H. J. M. Hanley, C. D. Muzny, and B. D. Butler, Langmuir 13, 5276 (1997).
- Patil et al. (2008) S. P. Patil, R. Mathew, T. G. Ajithkumar, P. R. Rajamohanan, T. S. Mahesh, and G. Kumaraswamy, Journal of Physical Chemistry B112, 4536 (2008).
- Liu et al. (2010) Q. Liu, S. Zhang, D. Sun, and J. Xu, Colloids and Surfaces A355, 151 (2010).
- Zhang et al. (2008) S. Zhang, Q. Lan, Q. Liu, J. Xu, and D. Sun, Colloids and Surfaces A317, 406 (2008).
- Abou et al. (2001) B. Abou, D. Bonn, and J. Meunier, Physical Review E64, 215101 (2001).
- Guillermic et al. (2009) R. M. Guillermic, A. Salonen, J. Emile, and A. Saint-Jalmes, Soft Matter 5, 4975 (2009).
- Joshi et al. (2008) Y. M. Joshi, G. R. K. Reddy, A. L. Kulkarni, N. Kumar, and R. P. Chhabra, Proceedings of the Royal Society A464, 469 (2008).
- Knaebel et al. (2000) A. Knaebel, M. Bellour, J.-P. Munch, V. Viasnoff, F. Lequeux, and J. L. Harden, Europhysics Letters 52, 73 (2000).
- Labanda and Llorens (2008) J. Labanda and J. Llorens, Colloids and Surfaces A329, 1 (2008).
- Martin and Thomas (2012) J. D. Martin and H. Y. Thomas, Soft Matter 8, 6940 (2012).
- Shahin and Joshi (2012) A. Shahin and Y. M. Joshi, Langmuir 28, 15674 (2012).
- Lap (1990) Laponite technical bulletin, l104/90/a,1 (1990).
- Martin et al. (2002) C. Martin, F. Pignon, J.-M. Piau, A. Magnin, P. Lindner, and B. Cabane, Physical Review E66, 02140l (11 pages) (2002).
- Tawari et al. (2001) S. L. Tawari, D. L. Koch, and C. Cohen, Journal of Colloid and Interface Science 240, 54 (2001).
- Thompson and Butterworth (1992) D. W. Thompson and J. T. Butterworth, Journal of Colloid and Interface Science 151, 236 (1992).
- Lerche and Sobisch (2007) D. Lerche and T. Sobisch, Powder Technology 174, 46 (2007).
- Ferse et al. (2007) B. Ferse, S. Richter, K.-F. Arndt, and A. Richter, Macromolecular Symposia 254, 378 (2007).
- Nicolai and Cocard (2001b) T. Nicolai and S. Cocard, Journal of Colloid and Interface Science 244, 51 (2001b).
- Rosta and von Gunten (1990) L. Rosta and H. R. von Gunten, Journal of Colloid and Interface Science 134, 397 (1990).