11email: marco.mignoli@oabo.inaf.it 22institutetext: Dipartimento di Fisica e Astronomia, Università degli Studi di Bologna, viale Berti Pichat 6/2, 40127 Bologna, Italy 33institutetext: INAF – Osservatorio Astronomico di Roma, 00040, Monteporzio Catone, Italy 44institutetext: Institut de Recherche en Astrophysique et Planétologie, CNRS, F-31400 Toulouse, France 55institutetext: IRAP, Université de Toulouse, UPS-OMP, Toulouse, France 66institutetext: Space Telescope Science Institute, Baltimore, MD 21218, USA 77institutetext: Institute of Astronomy, ETH Zurich, 8093 Zürich, Switzerland 88institutetext: Laboratoire d’Astrophysique de Marseille, Aix Marseille Université, CNRS, Marseille, France 99institutetext: European Southern Observatory, Garching, Germany 1010institutetext: INAF – Osservatorio Astronomico di Padova, Padova, Italy 1111institutetext: INAF – Istituto di Astrofisica Spaziale e Fisica Cosmica, Milano, Italy 1212institutetext: Kapteyn Astronomical Institute, University of Groningen, 9700 AV Groningen, The Netherlands 1313institutetext: INAF – Osservatorio Astronomico di Brera, Milano, Italy 1414institutetext: Institute for Astronomy, The University of Edinburgh, Royal Observatory, Edinburgh, EH93HJ, UK 1515institutetext: University of Vienna, Department of Astronomy, 1180 Vienna, Austria 1616institutetext: Kavli Institute for the Physics and Mathematics of the Universe, The University of Tokyo, Kashiwa 277-8583, Japan 1717institutetext: INAF – Istituto di Astrofisica Spaziale e Fisica Cosmica, Bologna, Italy 1818institutetext: Institut d’Astrophysique de Paris, Université Pierre & Marie Curie, 75014 Paris, France 1919institutetext: Institut d’Astrophysique Spatiale, Batiment 121, CNRS & Univ. Paris Sud XI, 91405 Orsay Cedex, France
Obscured AGN at 1 from the zCOSMOS-Bright Survey
Abstract
Aims. The application of multi-wavelength selection techniques is essential for obtaining a complete and unbiased census of active galactic nuclei (AGN). We present here a method to select 1 obscured AGN from optical spectroscopic surveys.
Methods. A sample of 94 narrow line AGN with 0.65z1.20 has been selected from the 20k-Bright zCOSMOS galaxy sample by detection of the high-ionization [Ne v] line. The presence of such emission line in a galaxy spectrum is indicative of nuclear activity, although the selection is biased toward low absorbing column densities on narrow line region or galactic scale. A similar sample of unobscured (Type-1 AGN) has been collected applying the same analysis to zCOSMOS broad-line objects. This paper presents and compares the optical spectral properties of the two AGN samples. Taking advantage of the large amount of data available in the COSMOS field, the properties of the [Ne v]-selected Type-2 AGN have been investigated, focusing on their host galaxies, X-ray emission, and optical line flux ratios. Finally, the diagnostic developed by Gilli et al. (2010), based on the X-ray to [Ne v] luminosity ratio, has been exploited to search for the more heavily obscured AGN.
Results. We found that [Ne v]-selected narrow line AGN have Seyfert 2-like optical spectra, although with emission line ratios diluted by a star-forming component. The ACS morphologies and stellar component in the optical spectra indicate a preference for our Type-2 AGN to be hosted in early-spirals with stellar masses greater than , on average higher than those of the galaxy parent sample. The fraction of galaxies hosting [Ne v]-selected obscured AGN increases with the stellar mass, reaching a maximum of about 3% at 2. A comparison with other selection techniques at z1, namely the line-ratio diagnostics and X-ray detections, shows that the detection of the [Ne v] line is an effective method to select AGN in the optical band, in particular the most heavily obscured ones, but can not provide by itself a complete census of Type-2 AGN. Finally, the high fraction of [Ne v]-selected Type-2 AGN not detected in medium-deep (100-200 ks) Chandra observations (67%) is suggestive of the inclusion of Compton-thick (i.e. with N) sources in our sample. The presence of a population of heavily obscured AGN is corroborated by the X-ray to [Ne v] ratio; we estimated, by mean of X-ray stacking technique and simulations, that the Compton-thick fraction in our sample of Type-2 AGN is (statistical errors only), in good agreement with standard assumptions by the XRB synthesis models.
Key Words.:
galaxies: active – galaxies: fundamental parameters – galaxies: evolution – quasars: emission lines – X-rays: galaxies1 Introduction
The study of the history of accretion is essential to our understanding of how supermassive black holes (SMBHs) form and evolve. Accretion onto a SMBH is the predominant source of energy emitted by Active Galactic Nuclei (AGN), so a comprehensive census of AGN of all types across a large fraction of cosmic time provides constraint on the black hole mass function at the present day (Soltan, 1982; Rees, 1984; Marconi et al., 2004).
Nowadays, there are strong observational evidences that all massive galaxies in the local Universe host a central SMBH (Kormendy & Richstone, 1995). This, along with the now firmly established discovery that the masses of SMBHs are proportional to the velocity dispersions and masses of their host stellar spheroids (Magorrian et al., 1998; Ferrarese & Merritt, 2000; Gebhardt et al., 2000; Tremaine et al., 2002), indicates an enduring physical connection between nuclear activity and galaxy formation and evolution. Many theoretical and observational efforts have been recently undertaken to comprehend the elusive evolutionary connection between AGN and their host galaxies. Nevertheless, the mechanisms driving this co-evolution are still far from being fully understood. Once again, to clarify the role played by AGN in this symbiosis requires a complete survey of both unobscured and obscured AGN.
Active Galactic Nuclei present a large variety of observed properties. They inhabit host galaxies of different morphologies, and show a wide range of luminosities in all the wavebands, from radio to X-rays. In the optical/UV range, AGN are characterized by a power-law continuum and broad (1000 km s-1) emission lines, the latter produced in the so-called broad-line region (BLR), extending on scales of light days. These unobscured (Type-1) AGN are thus easily identified from their optical spectra. Conversely, there are obscured (Type-2) AGN that show only narrow (1000 km s-1) emission lines emerging from the narrow-line region (NLR), with scales of the order of hundreds of light years. Since in these AGN the continuum is often dominated by stellar emission, their optical spectra are similar to those of normal Star-Forming Galaxies (SFGs). According to the standard unified model (Antonucci, 1993), this broad classification into two spectral classes depends on whether the central SMBH, its associated continuum, and the BLR are viewed directly (Type-1 AGN) or are obscured by a dusty circumnuclear medium (Type-2 AGN).
The optical classification of emission-line galaxies is usually done through emission-line ratio diagnostic diagrams. Baldwin et al. (1981) were the first to apply such a technique (BPT), using the strongest emission lines to separate objects into categories according to the excitation mechanism of the emitting gas. In particular, the [O iii]/H versus [N ii]/H diagram became the benchmark for emission-line classification, since it can reliably distinguish Star-Forming galaxies, Seyfert 2 galaxies, Low Ionization Nuclear Emission Regions (hereafter LINERs, see Heckman, 1980), and composite objects with both an AGN and star-forming regions. At redshifts greater than z0.5, the emission lines around H get redshifted out of the optical window and classical BPT diagrams can no longer be applied. Therefore, diagnostic diagrams need to be based on emission lines observed in the blue part of the galaxy spectrum: [O iii], H, and [O ii] (Rola et al., 1997). Unfortunately, such diagrams are only moderately effective in discriminating between starbursts and AGN (Stasiǹska et al., 2006) and in particular almost fail to separate LINERS from SFGs (Bongiorno et al., 2010; Lamareille, 2010).
The X-ray emission is probably the most prominent characteristic of AGN activity, since X-rays are thought to originate from the innermost regions of an accretion disk around the central SMBH. Combined with observations at different wavelengths, deep and wide-field X-ray surveys have been indeed effective in discovering a large proportion of the AGN population, significantly improving our census of AGN demographics (Brandt & Hasinger, 2005, and references therein). However, a large population of heavily obscured AGN, predicted by synthesis models for the cosmic X-ray Background (XRB; Gilli et al., 2007), is still undetected in X-ray surveys. Although X-ray observations are the least biased against moderately obscured AGN, still even the deepest X-ray surveys can under-sample the population of extremely obscured AGN, i.e. those with column densities N (i.e. Compton-thick sources).
The presence of the emission line [Ne v]3426 can be considered a reliable signature for nuclear activity, given that the ionization potential of Ne4+ is 97 eV, and stars generally do not emit photons beyond 55 eV (Haehnelt et al., 2001). Along with the [Ne v]3426 line, also the [Ne v]3346 line arises from the same excitation level, but with a relative intensity of approximately one-third (Vanden Berk et al., 2001). A [Ne v]-selected AGN sample should not be affected by significant contamination from star-forming galaxies: in their large spectroscopic sample, Baldwin et al. (1981) found no [H ii] region with detectable [Ne v], although some rare exceptions are known today (Izotov et al., 2004). Therefore, [Ne v] provides a powerful diagnostic tool in detecting AGN (Schmidt et al., 1998; Gilli et al., 2010).
In this paper we report on the first statistical optical sample (a total of 94 objects included in our Type-2 AGN class) of [Ne v]-selected AGN found in spectra taken in the zCOSMOS Survey (Lilly et al., 2007). Throughout the paper, we adopt a “concordance” cosmology, =, =, and =. Magnitudes are given in the AB system.
2 The zCOSMOS-Bright spectroscopic survey
The Cosmic Evolution Survey (COSMOS, Scoville et al., 2007) provided superb angular resolution and depth with single-orbit I-band HST-ACS exposures over a 2 square degree equatorial field (Koekemoer et al., 2007), along with deep ground-based images with excellent seeing (Capak et al., 2007). The zCOSMOS spectroscopic survey (Lilly et al., 2007) yields spectroscopic redshifts for a large numbers of galaxies in the COSMOS field using VIMOS, a multi-slit spectrograph mounted on the 8m UT3 of the European Southern Observatory’s Very large Telescope (ESO VLT). The zCOSMOS redshift project has been designed, in order to efficiently utilize VIMOS, by splitting the survey into two parts: first, the zCOSMOS-bright is a pure-magnitude limited survey, which has spectroscopically observed about twenty thousands objects brighter than = across the entire COSMOS field, with a medium-resolution grism (R600) and over a red spectral range (5500–9700 Å). This selection culls galaxies mainly in the redshift range 0.1z1.2. The second part, zCOSMOS-deep, has targeted about 10,000 25 galaxies, selected within the central 1 deg2, using color-selection criteria to encompass the redshift range 1.4z3.0. In this case, observations were performed with the R200 LR-Blue grism, which provides a spectral coverage from 3600 to 6800 Å. Because of the spectral and redshift ranges covered, the vast majority of the zCOSMOS-deep spectra sample a rest-frame wavelength interval shortward of 3000Å. Thus, in this paper we used only the zCOSMOS-bright spectra in the search for the [Ne v]3426 emission line. The spectra were reduced and calibrated using the VIMOS Interactive Pipeline Graphical Interface software (VIPGI, Scodeggio et al., 2005), while the redshift measurements were obtained with the help of an automatic package (EZ, Garilli et al., 2010) and then visually checked. For more details about the zCOSMOS survey, we refer the reader to Lilly et al. (2009).
3 The [Ne v]-selected Samples
3.1 Samples Selection
The 20k zCOSMOS-bright sample (hereafter the zCOSMOS sample) has been built from a magnitude-limited survey, with a fairly high sampling rate (70%) and well understood completeness properties (Zucca et al., 2009), that makes it well suited for statistical studies of AGN. Among the 20707 entries included in the zCOSMOS spectroscopic catalog (version 4.2), a total of 18141 galaxies and AGN have measured redshifts, 1031 objects (5%) are spectroscopically classified as stars, and 1535 objects (7%) remain without redshift identification. Of course, the success rate in securing a redshift is a function of redshift itself, rest-frame color and magnitude, but Lilly et al. (2009) showed that it is very high (95%) for the zCOSMOS sample between 0.5z0.9. In order to guarantee that both the [Ne v]3346,3426 emission lines fall within our spectral coverage, we have limited our analysis to redshifts larger than 0.65. The standard zCOSMOS redshift measurement process includes several interactive steps in which broad line AGN were identified and flagged; initially, we excluded from analysis the already identified Type-1 AGN, because our principal aim is to collect a sample of obscured AGN. The analyzed sample contains 7624 galaxies with redshifts between 0.65 and 1.50, and the corresponding 8188 spectra111In the 20k zCOSMOS sample, for various reasons more than 5% of the targets were observed twice or more (see Lilly et al., 2009). were then visually inspected and measured to identify the [Ne v]-emitting objects.
The careful [Ne v]-selection procedure consisted of two main steps. First, all the galaxy spectra were smoothed with a 3-pixel boxcar and plotted in the rest frame, using a semi-automatic procedure, adapted from the IRAF task splot, to detect the [Ne v]3426 feature in emission and compile a list of candidate AGN. This supervised but automatic preliminary analysis, which identified a possible [Ne v] emission line only if its peak is above 2.5 times the significance level as derived by the noise of the surrounding continuum and its center is within Å of the expected position, reduced to a few hundreds the number of galaxies to be further examined. The final phase of the selection process consisted of a careful examination of both the one-dimensional and two-dimensional sky-subtracted spectra, in order to: eliminate the spurious detections (sky line residuals, cosmic rays residuals, zero order contaminations); mark as secure candidates those galaxies with both the [Ne v] emission lines clearly visible at the expected positions; and accurately verify the reliability of the [Ne v]3426 lines, when the three times fainter [Ne v]3346 feature is not detectable. Following the laborious but accurate selection process presented above, we identified 95 zCOSMOS galaxies with a secure detection of [Ne v] in their spectra. The permitted narrow emission lines visible in the observed spectral range of these galaxies (i.e., Mg ii, H, and H) have been analyzed in order to investigate the possible presence of a faint broad component. We did not find a broad component in any spectrum of the [Ne v]-selected objects, and we estimated an upper limit to the flux ratio of the narrow and broad components of the order of 10-20%, depending on the emission line intensity and continuum S/N. Given these spectral properties, we can confidently classify all the selected objects as Type 1.9-2 AGN; hence the 95 galaxies constitute our bona-fide obscured AGN sample.
In the redshift range where the [Ne v] falls within our spectral coverage, the zCOSMOS survey discovered 112 broad line AGN. We applied the same analysis to this Type-1 AGN sample, detecting the [Ne v] emission line in 45 objects (40%).
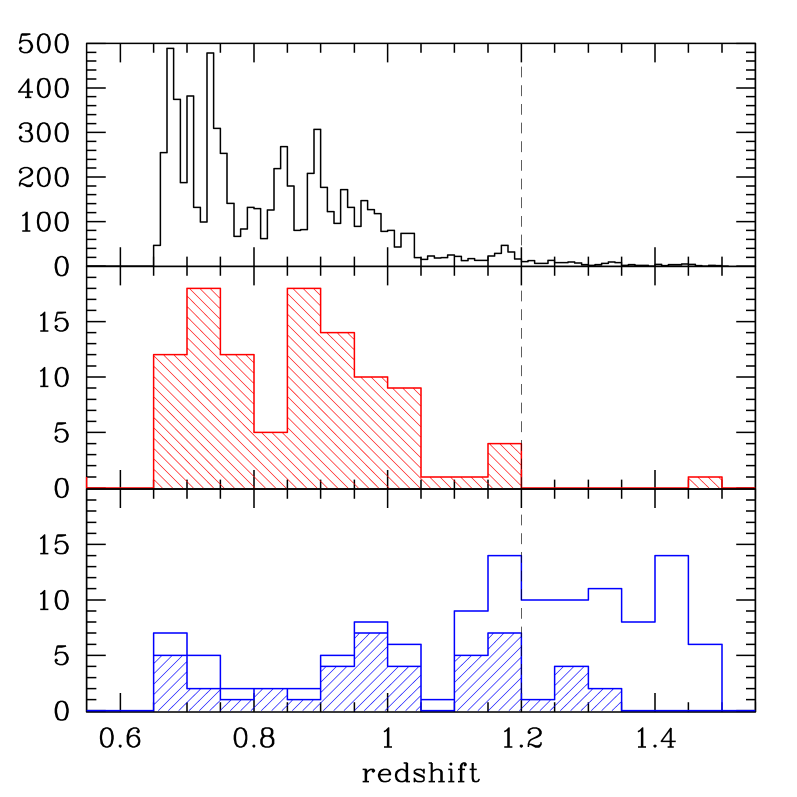
The redshift distributions of our AGN samples, along with that of the parent galaxy population, are presented in Figure 1. The redshift distribution of the [Ne v]-selected emission line galaxies (the Type-2 AGN sample; middle panel) clearly follows that of the zCOSMOS galaxies, with a steady decline at redshifts greater than 0.9 and then an almost complete lack of objects above z=1.2, with a single noteworthy exception at z=1.45. The reason for the paucity of [Ne v]-detected objects in the highest redshift interval is two-fold: first, the magnitude-limited zCOSMOS survey naturally culled normal galaxies, as well as obscured host-dominated Type-2 AGN, up to z1.2 (Le Févre et al., 2005; Lilly et al., 2007). Second, at redshifts greater then 1.2, the [Ne v] feature enters the wavelength region where the zCOSMOS spectra are severely affected by fringing, making it more difficult to detect the emission line over the noisy continuum. As a confirmation of this effect, we can look at the Type-1 AGN sample, which was not selected on the basis of [Ne v]-detection: at , the fraction of broad line objects with a detected [Ne v] emission line is 62% (37/60), whereas the ratio drops to a mere 13% (7/52) among objects with . Due to the difficulties in identifying [Ne v]-selected AGN above this redshift threshold, we limited the redshift interval to 0.65z1.20, drawing two final samples of 94 narrow line (Type-2) AGN and 60 broad line (Type-1) AGN.
3.2 Type-2 vs. Type-1 Samples
In this section we compare the mean optical properties of the two AGN samples, the [Ne v]-selected Type-2 sample and the Type-1 sample, the latter selected on the sole basis of the presence of a broad component in the emission lines visible in the spectra (hereafter NL- and BL-samples). First, we generated composite spectra for each AGN class by averaging all the available zCOSMOS spectra included in that class. To create the composite, each spectrum was shifted to the rest-frame according to its redshift (with a 1.5Å rest-frame bin222At the median redshift of the analyzed galaxy sample (z0.82), a rest-frame bin of 1.5Å matches the pixel size of the observations.) and normalized to a common wavelength range, always present in the observed spectral window. An identical weight was assigned to each individual spectrum, to avoid biasing the final composite towards the brightest objects.
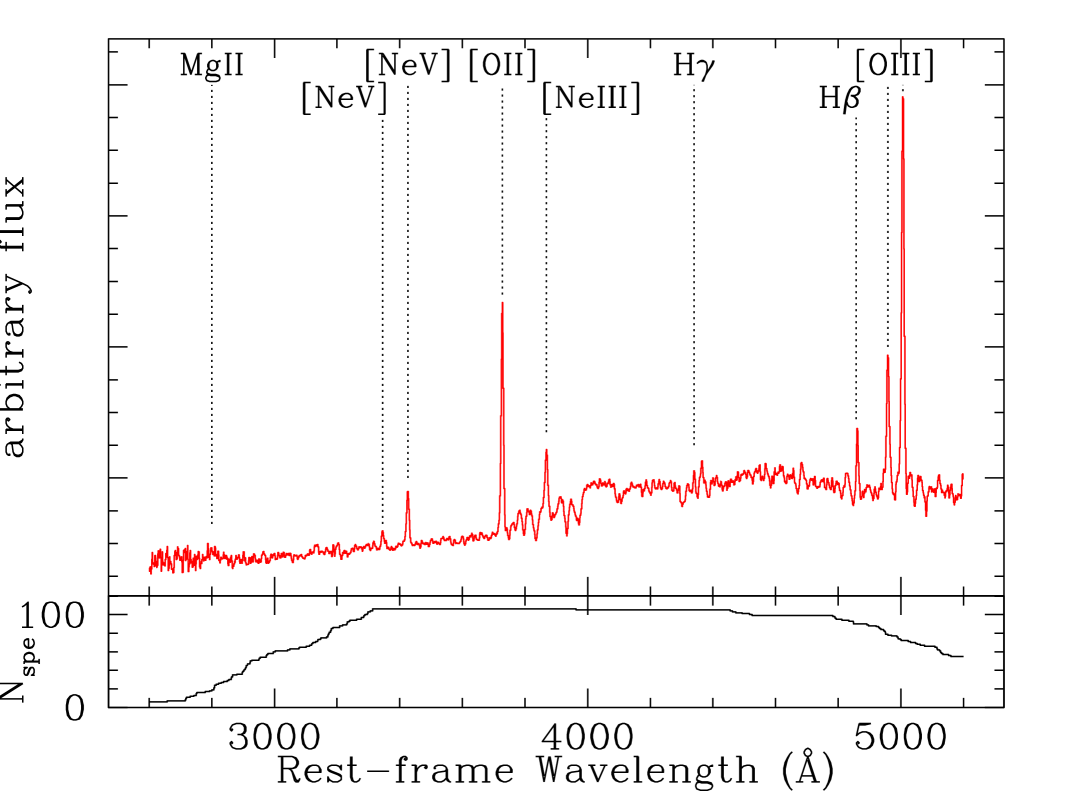
In Figure 2 the average spectrum, obtained stacking the spectra of ninety-four [Ne v]-detected galaxies, is plotted. It clearly shows strong, high-ionization narrow lines, in particular those of Neon, but very faint Mg ii emission line. In Figure 2 the main emission lines visible in the rest-frame spectral range covered by the observations are also labelled, while a summary of the principal emission line parameters is presented in Table 1. Indeed, the Type-2 sample composite spectrum closely resembles the spectrum of a Seyfert 2 galaxy, although the line ratios would place it in the transition region of the diagnostic diagram involving the “blue” emission lines ([O iii]5007, H, and [O ii]3727; Lamareille et al., 2004), commonly used at these redshifts. All the emission lines are unresolved (the upper limit of 700 km/s roughly corresponds to the spectral resolution of the zCOSMOS data), with the possible exception of the [Ne v] line itself, which seems marginally resolved, and of the very faint Mg ii feature. But in the latter case the low S/N of the line prevents us from obtaining a reliable FWHM estimate.
In order to obtain accurate flux measurements of the narrow Balmer emission lines in the spectral range, we used Bruzual & Charlot (2003) (BC03) population synthesis models to fit and subtract the stellar continuum in the composite spectrum of the Type-2 AGN; the fitting procedure allowed us to account for the underlying stellar absorption of the Balmer lines. The mean optical extinction in the Narrow Line Region (NLR), derived from the observed H/H flux ratio, is quite low (E(BV)=). This is not unexpected, since the AGN obscuration occurs in the inner core of the galaxies, and a significant amount of dust in the NLR would have prevented us from detecting the blue [Ne v] emission line. The absorption-line continuum of the composite could also provide useful information about the average stellar content of the galaxies hosting our Type-2 AGN sample. A set of 39 BC03 template spectra, spanning a wide range in age and metallicity, have been used to fit the emission-line-free regions of the composite. The best-fit model corresponds to an old stellar population with an exponentially declining star-formation, with the ratio between galaxy’s age and SF e-folding time of t/2. These model parameters roughly approximate a galaxy of Hubble Type Sa/Sb (Buzzoni, 2005).
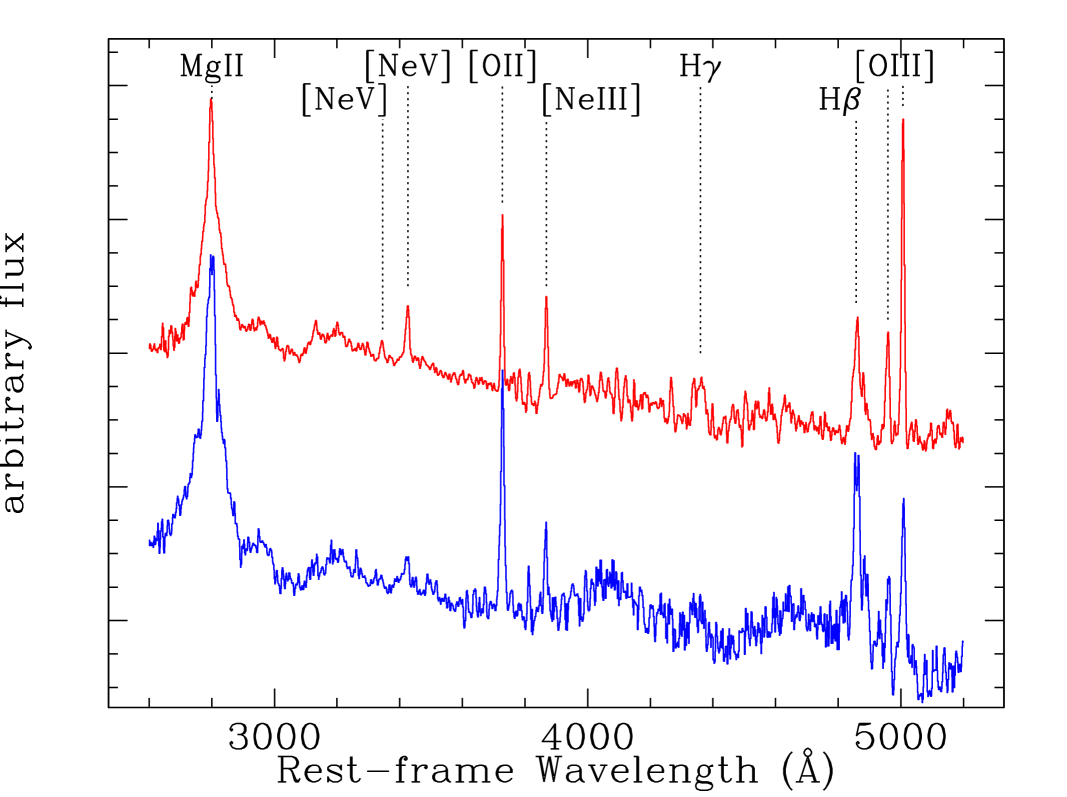
We also computed the average spectra of Type-1 AGN, by stacking spectra the thirty-seven broad line AGN with a [Ne v] detection and the twenty-three objects without a detectable [Ne v] line. The two composite spectra are presented in Figure 3, showing evident similarity. Nevertheless, looking at Table 1, where the principal emission line parameters are listed, it is possible to identify a main difference: the H/H flux ratio in Type-1 AGN without [Ne v] emission is significantly larger than in [Ne v]-detected ones, suggesting a larger mean optical extinction in the corresponding sub-sample. The higher average extinction in the sample 23 BL-AGN without [Ne v]-detection could explain why this feature is missing in the individual spectra, but visible in the high S/N stacked spectrum.
NL-AGN BL-AGN BL-AGN ([Ne v]-det.) (no-[Ne v]) line EW FWHM EW FWHM EW FWHM [Å] [km/s] [Å] [km/s] [Å] [km/s] Mg ii2800 6.2 42.0 5000 64.0 7500 [Ne v]3346 2.3 0.9 0.6 [Ne v]3426 8.2 900 3.1 1000 1.4 1100 [O ii]3727 29.3 700 7.0 12.8 900 [Ne iii]3869 6.0 700 3.5 3.1 700 H 3.2 700 8.6 2500 3.8 2000 H 8.2 700 21.4 2000 22.0 2000 [O iii]4959 9.0 700 6.9 700 4.2 800 [O iii]5007 33.2 700 20.5 700 13.1 800 333All values are rest-frame. H is severely contaminated by the adjacent [O iii] line in BL-AGN composite spectra. The FWHM of low S/N emission lines is highly uncertain, and its value is missing in the table; FWHM upper limits refer to unresolved emission lines.
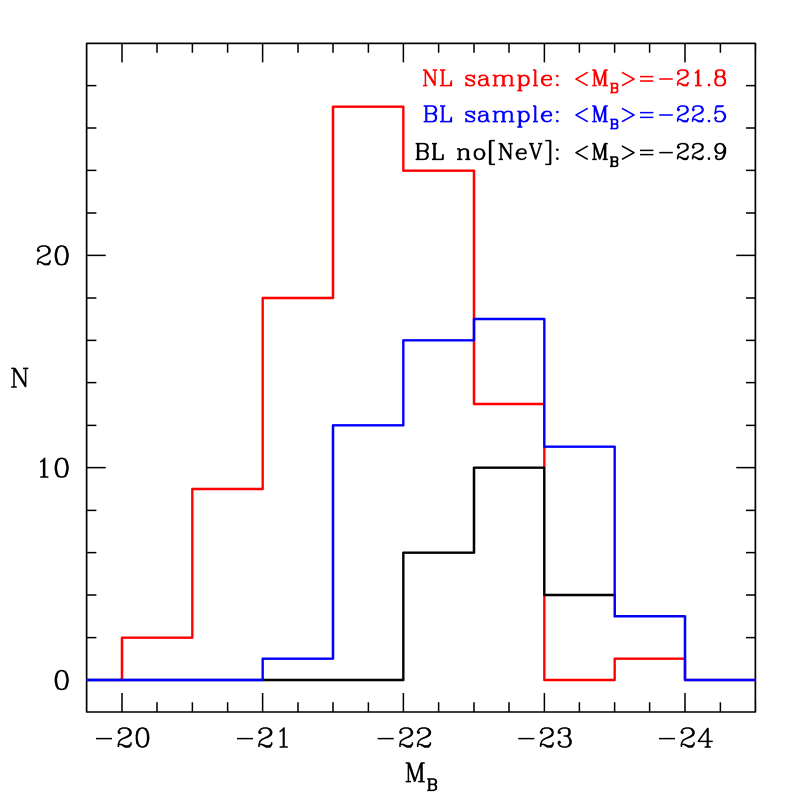
The non-detection of the [Ne v] emission line in a fraction of Type-1 AGN spectra is also probably related to the presence of a stronger continuum from the central engine in these objects, continuum that is shielded in the NL-sample. In support to this hypothesis, the absolute B-magnitude distributions of the AGN samples are presented in Figure 4. Absolute magnitudes were computed following the method described by Ilbert et al. (2005), using a set of templates for the K-correction and all the available photometric information. In order to reduce the importance of the K-correction assumption, rest-frame absolute magnitude were derived using the apparent magnitude from the closest (depending on the redshift) observed band. In Figure 4 a clear trend is visible: the median absolute B-magnitudes in the three sample distributions are -21.8, -22.5 and -22.9, respectively, for the total NL-sample, the total BL-sample, and the sub-sample of unobscured AGN with undetected [Ne v]. It is indeed expected that the NL-sample is composed by less luminous objects with respect to the unobscured AGN which belong to the BL-sample, but the higher luminosity of the BL-AGN with undetected [Ne v] corroborates the idea that the detection of this faint spectral feature becomes more difficult when the (unobscured) nuclear continuum increases. Further analysis of the Type-2 sample completeness, in terms of [Ne v] line detection, is discussed in the next section.
Finally, we compare the properties of the average spectrum of our BL-sample with those of the SDSS quasar composite (Vanden Berk et al., 2001): the Mg ii broad emission line is significantly stronger, on average, in our AGN sample than observed in the more luminous SDSS quasars (EW=32Å; see Table 2 in Vanden Berk et al., 2001). This is expected in the framework of the “Baldwin Effect” (Baldwin, 1977, but see also a thorough discussion of the observational biases in Zamorani et al. 1992). Conversely, the H relative intensity is lower in our composite spectra than in the SDSS one (EW22Å and 46Å, respectively), and the continuum is significantly redder. The latter results are consistent with the hypothesis that, in the red part of the rest-frame optical range, our composite spectra are significantly contaminated (and reddened) by the host galaxy stellar light. Very similar results were obtained by Gavignaud et al. (2006), who selected their Type-1 AGN sample from the VVDS survey, a spectroscopic survey which shares many characteristics (magnitude limit, instrument) with zCOSMOS. Although a detailed study of the broad line AGN component in the zCOSMOS survey is beyond the scope of this paper, and will be addressed in a future work, the preliminary analysis presented above indicates that the zCOSMOS BL-samples, both the [Ne v]-detected sub-sample and the no-[Ne v] one, do not show atypical spectral properties when compared to other known quasar samples.
3.3 Type-2 AGN Sample Completeness
The principal aim of this paper is to select and study a sample of obscured AGN at redshift 1. The BL-sample has been collected mainly for comparison purposes. For this reason, our main concern is related to the efficiency of our detection technique in selecting narrow line [Ne v]-emitting galaxies, having already interpreted the non-complete detection of the [Ne v] emission line in Type-1 objects as a combined effect of smaller emission line EWs and noise in zCOSMOS spectra.
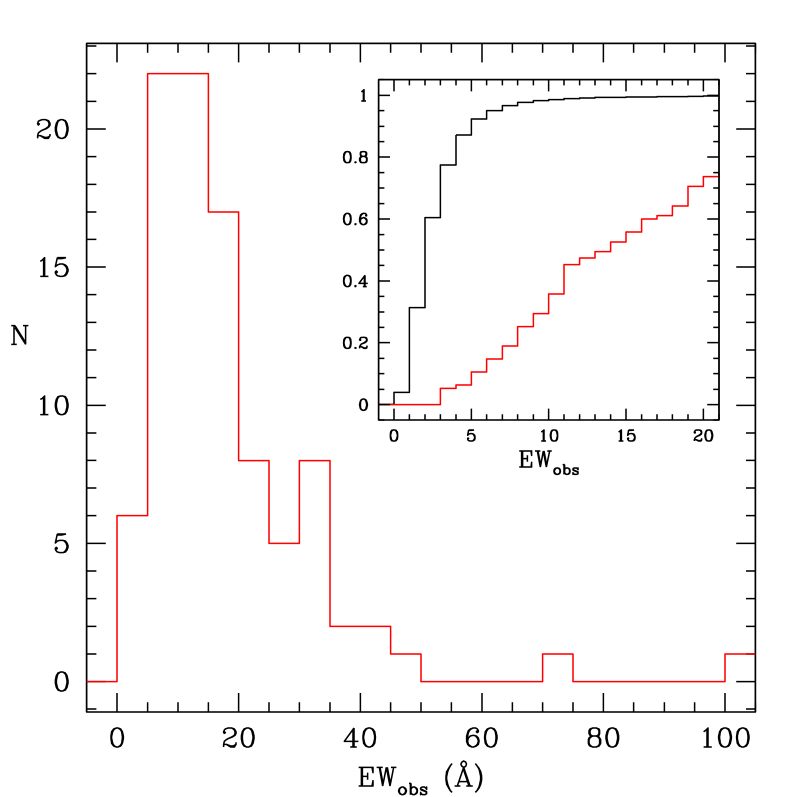
In order to support the effectiveness of our technique in selecting a fairly complete sample of Type-2 AGN, at least in terms of [Ne v] emission, we analyze the distribution of the detected line EWs, presented in Figure 5. The observed EW distribution of the [Ne v] emission line is peaked at around 10Å, with a long tail up to 100Å. The inset of Figure 5 shows the cumulative EW distribution of the detected [Ne v] lines, along with the cumulative distribution of the EW upper limits for the 7265 zCOSMOS galaxies with undetected [Ne v]. The detection limits have been estimated from the S/N in the continuum adjacent to the line, following the procedure outlined by Mignoli et al. (2009) on the basis of a larger sample of emission line galaxies drawn from the zCOSMOS survey. Comparing the two cumulative distributions, we find that 92% of the galaxies with undetected [Ne v] have upper limits lower than 5Å, while only six Type-2 AGN show EW smaller than the same threshold. Since there is no reason to expect that galaxies with loose upper limits include a different percentage of AGN than the parent sample (1.3%), we can confidently conclude that our selection misses very few strong [Ne v] emitters (i.e. with EW larger than 5Å).
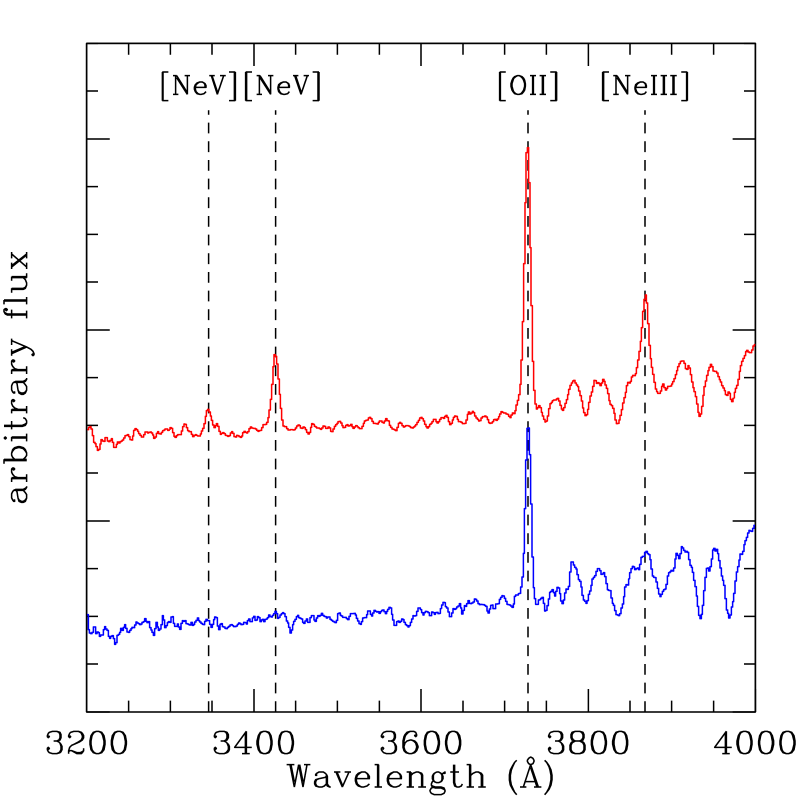
We further examine our detection efficiency exploiting the multi-wavelength data set of the COSMOS field, using the Chandra-COSMOS Survey (C-COSMOS; Elvis et al., 2009) to pinpoint AGN candidate in X-rays. The sample of zCOSMOS galaxies without broad lines in their spectra and 0.65z1.20, includes 5148 objects inside the Chandra mosaic; 180 of these galaxies have been associated with an X-rays source in the C-COSMOS catalog (details on the X-rays catalog and matching criteria can be found in Puccetti et al. 2009 and Section 5.1). Most of these galaxies likely harbor an active galactic nucleus, since their X-ray luminosity is larger than erg/s, and it has been shown that other sources of X-ray emission in normal galaxies (i.e. high-mass binaries; Moran et al., 1999) cannot easily account for such high luminosities. We stacked 158 optical spectra of the X-ray emitting galaxies without [Ne v] detection using the same recipe adopted for the [Ne v]-detected Type-2 AGN sample, and the two composite spectra are shown in Figure 6. Visually comparing the two spectra, it is striking the complete absence of the [Ne v] doublet in these X-ray emitting galaxies; an upper limit of 0.5Å to the [Ne v] equivalent width can be obtained from the S/N of the continuum. Therefore, we can confidently assert that the selection process should not have missed a significant number of galaxies with the [Ne v] emission line in the EW range of 1-3Å, since such a population of weak [Ne v] emitters do not emerge even in a complementary X-ray selected AGN sample. On the other hand, the presence of a significant number of X-ray emitting galaxies, probably hosting an obscured AGN, without a detectable [Ne v] emission, clearly indicates that this technique alone is not sufficient to select a complete sample of Type-2 AGN. The mean optical extinction in these X-ray emitting galaxies, derived from the H/H flux ratio measured in their composite spectrum, is E(BV)=, larger than in the [Ne v]-selected Type-2 AGN sample, suggesting dust extinction on galactic or NLR scale as a possible cause for the [Ne v] paucity in these objects.
4 The [Ne v]-selected Type-2 AGN sample properties
4.1 Stellar Mass distribution of the host galaxies
Stellar masses, for both the Type-2 AGN and the galaxy parent samples, have been computed by Bolzonella et al. (2010). Briefly, they used different stellar population synthesis models to fit the large set of optical and near-infrared photometry available in the COSMOS field, using a minimization to find the best-fit model, at a fixed redshift from the zCOSMOS survey. Further details on stellar masses’ determination can be found in Bolzonella et al. (2010) and Pozzetti et al. (2010).
Previous studies of Type-2 AGN host galaxy properties have assumed that the contamination of the AGN light to their stellar masses measurements is negligible (Silverman et al., 2008; Schawinski et al., 2010). Bongiorno et al. (2012) analyzed the differences between the stellar masses computed using SED fitting with only a galaxy component and those obtained with two components (AGN and galaxy). They applied the two SED fitting to a large sample of AGN in the COSMOS field: our [Ne v]-selected AGN, included in their work, shows the least differences in the computed stellar masses, between the various AGN classes, with a median of mass ratios . Our [Ne v]-selected Type-2 AGN sample is composed by galaxies hosting relatively low-luminosity and obscured AGN, so we can confidently compare their derived properties with those of the parent sample.
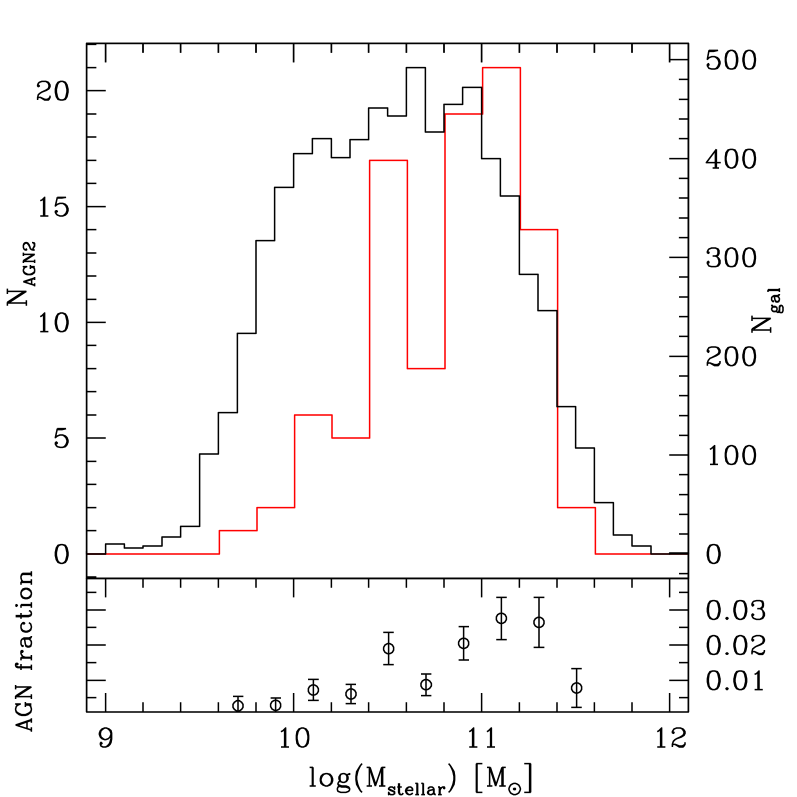
Figure 7 shows the stellar mass distribution of galaxies hosting the Type-2 AGN sample (red histogram), along with that of the parent galaxy sample (black histogram). From the top panel of Figure 7, we can see that the stellar mass for most Type-2 AGN hosts is in the range , while the galaxies of the parent sample have masses down to . The median stellar mass of the Type-2 AGN host galaxies is , while for the parent galaxy sample is . We used a two-populations Kolmogorov-Smirnov (K-S) test to assess the significance of the difference between the masses of the parent sample and the AGN host galaxies, finding that they differ at very high significance ().
The fraction of [Ne v]-selected obscured AGN in our zCOSMOS sample is shown as a function of the host stellar mass in the lower panel of Figure 7, with the percentage of Type-2 AGN rising from less than 1% at to around 3% at . A similar trend is shown by purely X-ray selected AGN in zCOSMOS (Silverman et al., 2009), and in larger X-ray sample (Aird et al., 2012), although we will show below that the two selection techniques ([Ne v] and X-ray) are more complementary than overlapping. Also in optically selected AGN samples the detection rate is strongly dependent on host galaxy mass, as established in a sample of SDSS emission-line galaxies (Kauffmann et al., 2003).
4.2 Morphologies of the host galaxies
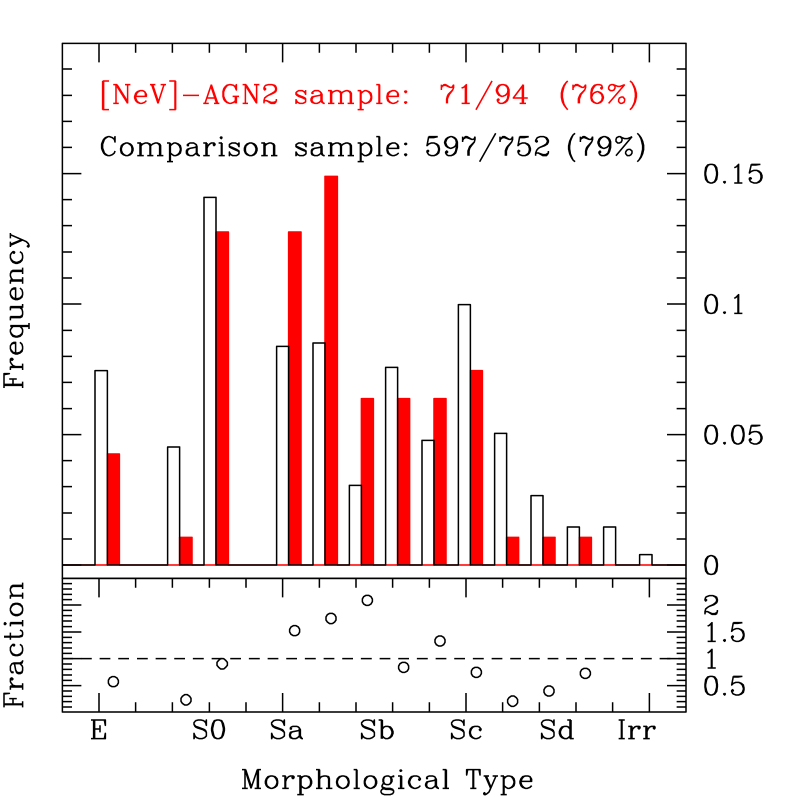
In order to compare the morphologies of our AGN host galaxies to those of normal galaxies, we built a control sample of galaxies from the zCOSMOS survey. Given the different mass distribution highlighted in Figure 7, for each of the 94 narrow line AGN we selected 8 galaxies from the parent sample with matched redshift and stellar mass. We made use of the morphological catalog by Nair et al. (in preparation) that, using the F814W-band images from the Advanced Camera for Surveys (ACS) available in COSMOS and following the method applied in Nair & Abraham (2010), visually classified all the galaxies belonging to zCOSMOS, and divided them into different types (Ell, S0, Sa-Sd, and Irr). A clear classification in one of the Hubble types was possible for 71 out of 94 (76%) of the AGN host galaxies, while a similar fraction of galaxies (597/752, 79%) have been classified in the control sample. The objects which do not have a regular morphology assigned to them are mainly of two classes: for some galaxies, the resolution and signal-to-noise is such that it was not possible to establish an accurate morphological type, but the majority of the unclassified objects shows peculiar morphologies (i.e. doubles, tadpoles and chain galaxies) and do not find a natural place in the Hubble sequence.
The AGN host galaxy morphology distribution is plotted along with that of the control sample in Figure 8, where only objects with assigned Hubble type are shown. The two distributions are not strikingly different, since the significance of the difference between the two populations is at about 2 level, as estimated from a K-S test. Even if the two distributions are similar, the lower panel of Figure 8 seems to suggest a difference in the trend of the relative frequency of the Hubble types: the hosts of the [Ne v]-selected Type-2 AGN prefer the early-spirals morphologies (Sa-Sb), with an expected paucity of late-spirals and Irregulars, but also with a lower fraction, with respect to the control sample, of elliptical galaxy hosts.
4.3 Optical spectroscopic properties
We measured the [Ne v] and [O ii] emission lines in all the available zCOSMOS spectra of the AGN included in both the Type-1 and Type-2 samples selected by [Ne v]-detection. We used a semi-automatic procedure that exploits the IRAF task : first, the continuum was automatically fitted to fixed wavelength intervals, although our procedures also enabled interactive adjustments of the continuum level to improve the line measurement in noisy spectra. Then, equivalent widths (EWs) and fluxes were measured by applying a Gaussian-function fitting algorithm of the continuum-subtracted line profiles. The measurement errors, estimated from the rms of the continuum close to the line after the Gaussian fit is subtracted, are of the order of 5-10% for the [O ii], and 10-20% for the fainter [Ne v]. Moreover, repeated observations exist for more than 5% of the zCOSMOS sample, and spectral measurements obtained from these repeated spectra are consistent within the errors quoted above.
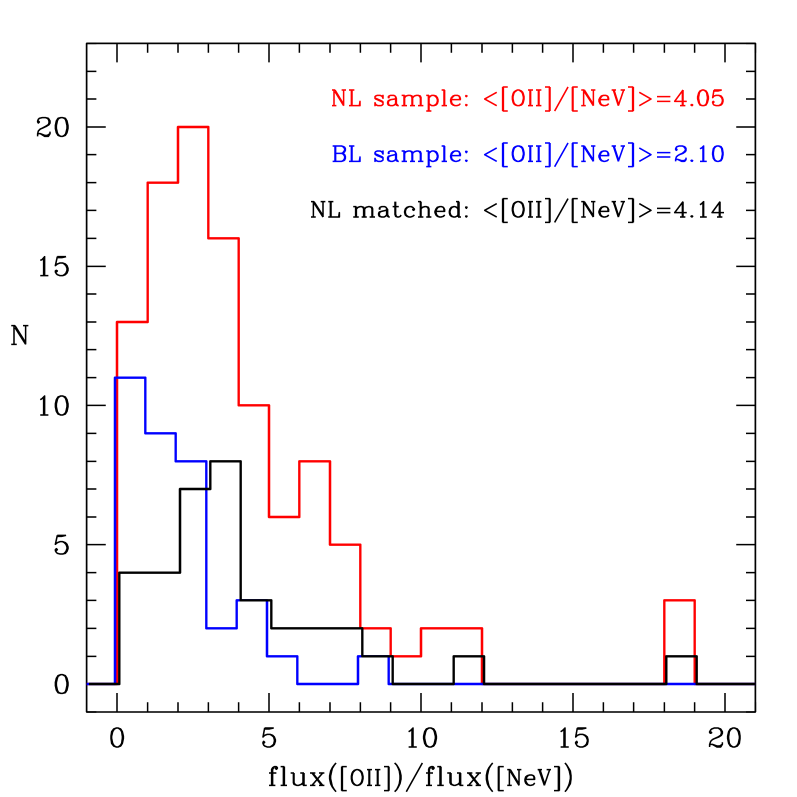
We investigate the [O ii]/[Ne v] flux ratio in our [Ne v]-selected samples of broad and narrow line AGN. According to the unification model (Antonucci, 1993), the emission properties of the Narrow Line Region should be similar in both AGN types. Thus, under the hypothesis that the [Ne v] emission and NLR [O ii] component are linked, a larger line flux ratio in the obscured population, with respect to typical Type-1 AGN values, would favor the scenario of enhanced star formation in Type-2 AGN invoked by semi-analytic models of galaxy formation and evolution (Gilli et al., 2010, and references therein).
The mean (median) flux ratio is 4.05 (3.13) in the NL sample and 2.10 (1.62) in the BL sample. Because of different selection efficiencies in the two samples (see section 3.2), we also extracted, from the larger sample of NL-AGN, a sub-sample with redshift and [Ne v] flux distributions matching those of the BL-AGN. Again, the mean (median) [O ii]/[Ne v] intensity ratio is 4.14 (3.51) in this BL-matched Type-2 AGN sample. We measured the flux ratio also in the composite spectra of Type-2 AGN and [Ne v]-detected Type-1 AGN samples presented in section 3.2, obtaining similar values of 3.62 and 1.94, respectively. The composite spectrum of the Type-2 AGN sample, selected at redshifts 0.3z0.83 from the Sloan Digital Sky Survey, shows an intensity ratio in good agreement with the averages measured in this work (4.50.3; Zakamska et al., 2006). The significantly larger value of the [O ii]/[Ne v] flux ratio is therefore suggestive of enhanced star formation, for a given [Ne v] luminosity, in the obscured population, at least with respect to the sample of Type-1 AGN.
5 Comparison with other Type-2 AGN selection techniques at z1
While the cosmological evolution of unobscured QSOs has been relatively well studied out to very high redshifts () thanks to large optical surveys, mostly the 2dF QSO Redshift Survey (Croom et al., 2004) and the Sloan Digital Sky Survey (SDSS; Richards et al., 2006), there are not many samples of optically selected, high-z Type-2 AGN available in the literature, and their space density beyond the local universe is poorly known. The selection of complete samples of obscured AGN is a difficult task, and the two methods commonly regarded as the most complete, the optical emission line selection and the X-ray detection, have their own biases. In the optical, dust extinction throughout the host galaxy can significantly reduce the observed emission line luminosity and/or alter the line ratios. Moreover, the emission line selection suffers from a redshift-dependent completeness, since at different redshifts the diagnostic diagrams exploit different line ratios, with different efficiencies and specificities. On the other hand, the X-ray selection, while largely unaffected by extinction in the host galaxy, is biased against sources in which nuclear emission is absorbed by Compton-thick gas close to the central engine.
Consequently, the Type-2 AGN detection rate strongly depends on the adopted selection criteria and sample definition. There is no single known method that can select a complete sample of obscured AGN, and we are not aware of any selection technique capable to identify all the objects found by other methods. In this section, we compare the result of our [Ne v]-selection technique with other AGN selection methods, using as reference the parent sample of 7358 galaxies with 0.65z1.20 and , selected from the zCOSMOS Redshift Survey.
5.1 X-ray selection
The sample of zCOSMOS galaxies without broad lines in their spectra and redshift range 0.65z1.20 includes 5148 objects within the Chandra mosaic; 180 of these galaxies show X-ray emission (all above 1042 erg s-1) and are likely obscured AGN. Only 23 [Ne v]-selected sources are detected by Chandra within 1.2 arcsec from the optical position; the median distance between the X-ray and optical counterpart is 0.46 arcsec. To derive rest-frame, observed (i.e., prior to absorption correction) 2-10 keV fluxes, we have extracted the X-ray counts for these sources using the multiple pointings of the Chandra-COSMOS mosaic. Here we present a summary of the adopted procedure; a more exhaustive description is presented in a forthcoming paper (Vignali et al., in preparation).
Because of the tiling strategy in the C-COSMOS field, every source can be observed in more than one pointing and at different locations within the ACIS-I field-of-view, hence the source count distribution is generally characterized by different PSF sizes and shapes. To properly account for all of these effects, we have used the Acis Extract software (Broos et al., 2010), which extracts the source counts from each observation using the 90% of the encircled energy fraction at 1.5 keV at the source location and then correcting for aperture. X-ray photometry in the observed band corresponding to the rest-frame 2–10 keV band was then converted into a count rate using the exposures derived from the time-maps at each source position, and then into a flux assuming a power-law with photon index . To provide support to our results, X-ray spectra were also extracted for all of the 23 sources and fitted using XSPEC (version 12.6; Arnaud, 1996) with a a power-law modified by Galactic absorption only. The derived rest-frame 2–10 keV fluxes were found to be consistent, within their admittedly large errors, with the fluxes obtained by the simple count rate to flux conversion described above.
For 46 of the remaining 48 [Ne v]-selected sources444For two sources, no reliable X-ray photometry could be obtained from the available data. with no individual X-ray detection, we have derived upper limits to the X-ray flux using the same procedure described above: at each source position, counts have been extracted taking into account the PSF size and shape in the observed band equivalent to the rest-frame 2-10 keV energy range. One-sigma count upper limits have then been converted into count rates using the time-maps, and these were finally converted into X-ray flux upper limits assuming a power-law with photon index , which is broadly consistent with a Compton-thick spectrum.
As a final remark, we note that the population traced by X-ray detected [Ne v]-selected sources represents a limited fraction of the overall, likely obscured, AGN population with an X-ray counterpart and no broad emission line in the optical spectra (23/180, i.e. 12.7%). The X-ray selection allows us to collect a larger number of z1 Type-2 AGN than the [Ne v]-detection technique (180 vs. 71). Both samples include a population of heavily obscured AGN, as suggested by the distribution of column density for Type-2 AGN in the Chandra-COSMOS survey (Lanzuisi et al., 2013) on the one hand and by the large fraction of X-ray undetected [Ne v]-selected sources (48/71) on the other hand. In other words, the selection based on the lack of broad optical emission lines coupled to relatively strong ( erg s-1) X-ray emission is somehow complementary to the selection of AGN based on the presence of [Ne v] emission.
5.2 The “blue” line ratios diagram
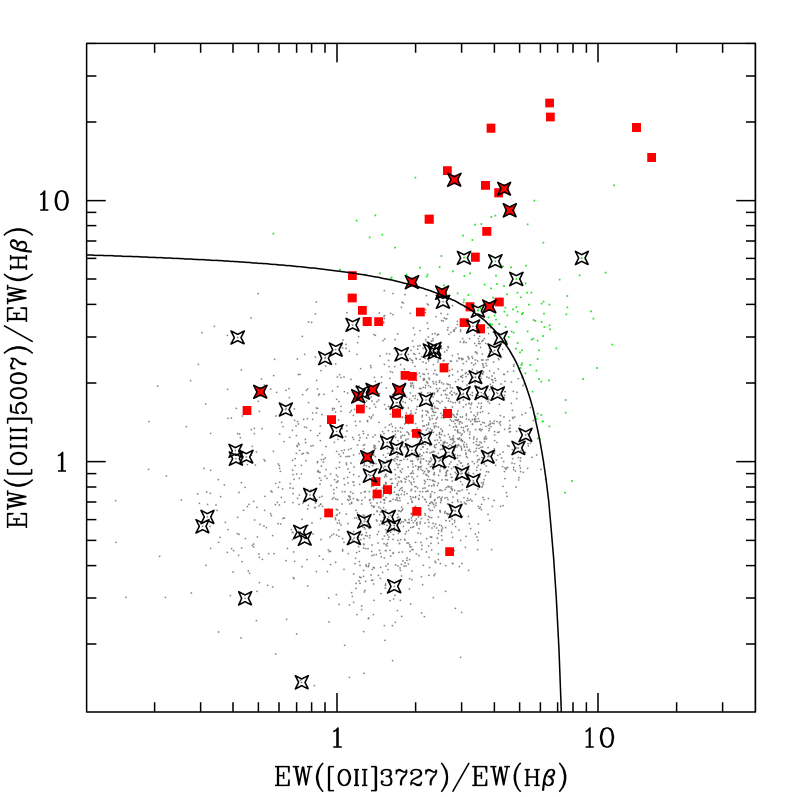
The classical method to classify star-forming galaxies and narrow line AGN with optical spectroscopy is based on emission-line ratio diagnostics. The most efficient and commonly used BPT diagram requires two sets of line ratios: [N ii] 6583/H and [O iii] 5007/H. Unfortunately, in the redshift range of interest here, the H line is outside the observed spectral range, so we need to rely on a diagnostic diagram based only on emission lines observed in the blue part of the optical spectra: [O iii] 5007, H and [O ii]3726,3729. Such “blue” diagnostic diagram, recently applied to a smaller (10k) sample of zCOSMOS galaxies (Bongiorno et al., 2010), is less effective than the lower redshift, classical BPT diagnostic diagram. The emission line fluxes of the zCOSMOS galaxies were measured using the automated pipeline platefit_vimos (Lamareille et al., 2009), which simultaneously fits all the emission lines with Gaussian functions after removing the stellar continuum. We checked the consistency of the platefit measurements with the [O ii] fluxes measured by us in the sample of [Ne v]-selected AGN, finding an excellent agreement: the mean of the intensity ratio distribution was 0.997 and two flux measurements never differed by more than 20%.
The sample of zCOSMOS galaxies in the redshift range 0.65z0.92 includes 5662 objects; this number includes 63 out of 94 [Ne v]-selected Type-2 AGN. The upper redshift limit is chosen to ensure that the [O iii] line is still within the observed spectral range. The basic requirement for a reliable classification is that all the diagnostic emission lines are detected above a minimum signal-to-noise ratio (S/N). In particular, we selected emission-line galaxies in the explored redshift range for which all the lines are detected with S/N3. This S/N cut reduces the number of analyzed galaxies down to 2461 (43%), with the strongest criterion being that on H, which is generally the weakest of the involved emission lines. A larger fraction (48/63; more than 75%) of [Ne v]-selected Type-2 AGN satisfies the requirements for being included in the diagnostic diagram shown in Figure 10. This diagram allows us to separate the zCOSMOS star-forming galaxies from the Seyfert 2-like objects which inhabit the upper part of the line ratio plane. The demarcation line, proposed by Lamareille (2010), separates the underlying galaxy population in 159 Type-2 AGN (6.5%) and 2302 SFG. The position of the [Ne v]-selected narrow line zCOSMOS galaxies is also shown (red square dots) in Figure 10: a significant fraction (29/48 or 60%) of Type-2 AGN selected via [Ne v] fall in the star-forming region of the blue diagnostic diagram. Conversely, of the 159 Type-2 AGN selected on the basis of their emission line ratios, only 19 (12%) show a detectable [Ne v] emission. As a further check, we stacked the optical spectra of the remaining 140 Type-2 AGN, selected by the diagnostic diagram, detecting a very faint [Ne v] emission line with a rest-frame EW of 0.7Å. In Figure 10 we also highlighted the emission-line galaxies with an X-ray counterpart in the Chandra catalog (open star symbols): again, 55 out of 66 (83%) X-ray sources (with L erg s-1, thus likely Type-2 AGN) fall in the region of star-forming galaxies. So, the [Ne v]-selected and X-ray emitting Type-2 AGN share similar classification percentage and position in the blue diagnostic diagram, suggesting a heavy incompleteness in the line-ratios technique used to select high redshift () obscured AGN.
The lower efficiency in selecting AGN of the blue diagnostic diagram has been already reported in literature (Bongiorno et al., 2010; Stasiǹska et al., 2006), with a number of possible explanations: first, because of the large wavelength separation between the [O iii] 5007 and H emission lines, their flux ratio is very sensitive to dust obscuration on galactic scale, and the adoption of an EW ratio can only mitigate the effect, due to the differential extinction between the emission line region and the stellar continuum in the galaxy spectra. Another possible reason for the presence of Type-2 AGN in the SFG region is that in these objects star formation and AGN activity coexist. This hypothesis is consistent with model predictions for the position of the composite AGN/SF in the optical diagnostic diagrams (Stasiǹska et al., 2006). The latter explanation seems more plausible for the [Ne v] selected Type-2 AGN falling in the SFG region, since a small amount of extinction in the host galaxy would erase the blue faint [Ne v] emission line.
5.3 The Mass-Excitation (MEx) diagnostic
The Mass-Excitation diagnostic diagram has been recently proposed by Juneau et al. (2011) and offers, at , a more complete AGN selection than the optical blue diagram. It is derived from the classic BPT diagram, using the galaxy stellar mass as a surrogate for the [N ii] 6583/H line ratio. Juneau et al. (2011) demonstrate that the MEx technique successfully distinguishes between star formation and AGN emission, also dealing with AGN/SF composite galaxies, the so-called “MEx-intermediate” class, which lie in a part of the diagram in between the AGN and SFG regions.
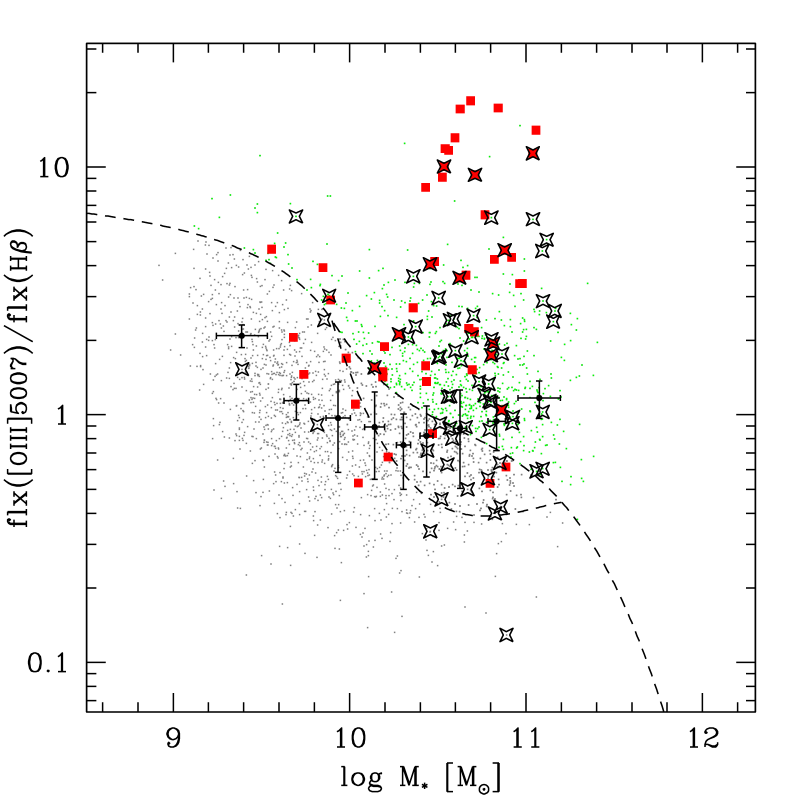
The same zCOSMOS galaxy sample adopted for the blue diagnostic diagram (objects in the range 0.65z0.92 and with emission lines all detected with S/N3) has been analyzed with the MEx diagnostic diagram presented in Figure 11. The high efficiency in selecting AGN of the MEx technique is evident when looking at the position of the [Ne v]-selected (red squares) and X-ray emitting (starred symbols) Type-2 AGN. A large fraction (39/48, more than 80%) of the [Ne v]-selected galaxies are classified as AGN, along with other four objects lying in the region of the diagram where AGN/SF composites are expected. Only five of them would be classified as star-forming galaxies by the MEx diagnostic diagram. Similarly, of the 66 X-ray emitting galaxies which satisfied the constrain for the inclusion in the diagram, fifty are classified as AGN and eleven belong to the MEx-intermediate class. Once again, although the two samples have only few objects in common, the [Ne v]-selected and X-ray emitting Type-2 AGN share almost identical position and classes percentage in the MEx diagnostic diagram.
However, a few words of caution about the efficiency of the MEx technique are appropriate. The inclusion of a very large percentage of AGN selected with other techniques is probably the consequence of a quite “generous” criterion for AGN classification by the MEx diagnostic. When it is applied to the zCOSMOS galaxies in the range 0.65z0.92, about one-third of them (796) are classified as active, a quite large number of AGN if compared to those identified by other techniques. Moreover, since more than 3000 galaxies are not included in the MEx diagram because of low S/N in their emission line measurements, we had to estimate how their removal would bias the AGN fraction. We divided the excluded galaxies in nine equally populated bins according to their computed stellar mass, and fluxes of the emission lines have been measured in composite spectra. In seven over nine bins the value of [O iii]/H flux ratio, plotted in Figure 11 against the mean stellar mass, falls below the MEx empirical division curve, suggesting that zCOSMOS galaxies with low S/N spectra predominantly populate the star-forming region, and, if they were included in the diagnostic diagram, the AGN percentage would decrease to %. In addition, since the empirical dividing lines used in Figure 11 have been calibrated in Juneau et al. (2011) using a z0.1 SDSS galaxy sample, their application to our z0.8 sample should be taken with caution. Indeed, new computations carried out by Juneau et al. (in prep.) confirm that the loci of these diagnostic diagrams evolve with redshift, and that approximately 10% of the galaxies falling in the AGN class using local relation are instead included in the SF region at z=0.7. This would further decrease, by a similar amount, the MEx-AGN fraction in our zCOSMOS galaxy sample.
5.4 The relative efficiency of Type-2 AGN selection techniques
[Ne v] X-ray DD-Blue DD-MEx [Ne v] 36 (2.1%) 11 (17%) 12 (10%) 30 (5.1%) X-rays 11 (31%) 66 (3.9%) 11 (9.4%) 50 (8.6%) DD-Blue 12 (33%) 11 (17%) 117 (6.8%) 69 (12%) DD-MEx 30 (83%) 50 (76%) 69 (59%) 582 (34%) 555The diagonal elements represent the number of galaxies classified as Type-2 AGN by each technique, with corresponding efficiencies respect to the sample of 1712 galaxies for which all diagnostics are available. Type-2 AGN identified by two methods are shown as off-diagonal elements, along with the percentage with respect to the total number of galaxies (boldface number in same column) selected by the specific diagnostic identified in the column top label.
In this section the previously discussed optical and X-ray diagnostics are compared. Since the different selection techniques are not applicable to all the members of the parent galaxy sample, in order to obtain a meaningful comparison, we extract a subsample of 1712 galaxies (included in the Chandra field-of-view, with a redshift range of 0.65z0.92, and with emission lines all detected with S/N3) for which all diagnostics are available. The objects that show at least one indication of activity are 651, more than one-third of the galaxy population (38%) but, as already demonstrated in Section 5.3, the exclusion of galaxies with low S/N emission lines in the MEx diagram may significantly increase the AGN percentage. If we do not take into account the MEx diagnostic, the AGN number drops to 191 (11%).
A relative evaluation of the different techniques, presented in this paper, to select Type-2 AGN at z1 can be drawn from Table 2: the first three selections (namely, [Ne v] and X-ray detections, and the blue line ratios diagram) are almost complementary, with similar efficiency and relatively small overlaps, since the fraction of objects simultaneously detected by two methods ranges from 10 to 33%. Conversely, the MEx diagnostic seems highly efficient in selecting obscured active galaxies, since more than 50% of the Type-2 AGN666Taking in account also the redshift evolution of the empirical dividing lines. identified by other methods are located in the AGN region of the MEx diagram. The differences in the nature of the selected Type-2 AGN samples play an important role in the relative merits of the selection methods investigated. The [Ne v]- and X-ray-selected galaxies have clear sign of nuclear activity, representing good single examples of powerful AGN. On the other hand, the MEx selection, with its probabilistic approach, produces a more complete statistical AGN sample, including also low-luminosity objects, but it can be affected by contamination especially when used on an object-by-object basis.
6 The X-ray to [Ne v] flux ratio and the heavily obscured AGN content in zCOSMOS
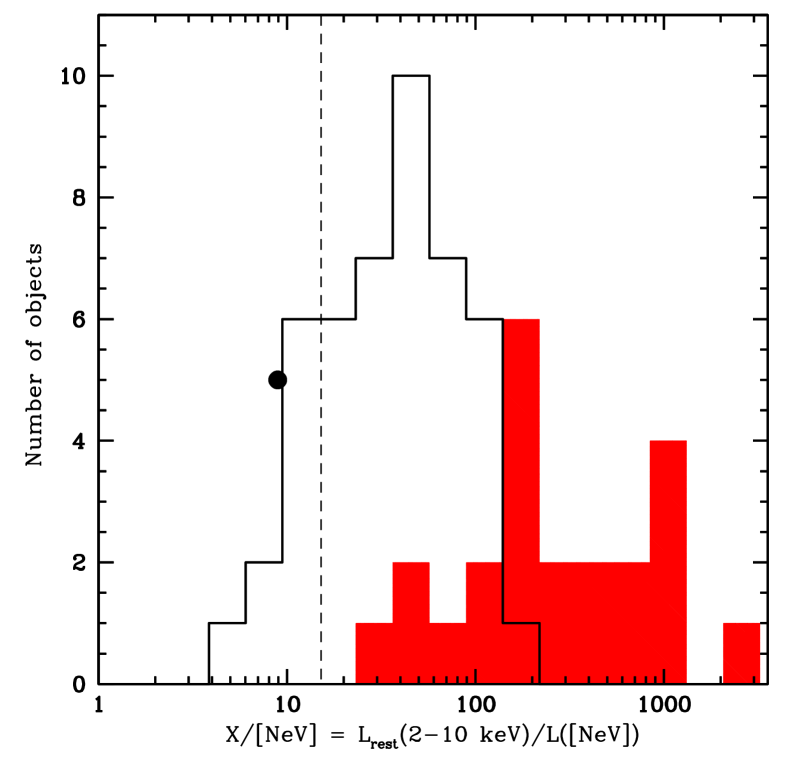
Gilli et al. (2010) explored the potential of the observed 2–10 keV to [Ne v] emission-line luminosity ratio (X/NeV) as a method to discover heavily obscured, possibly Compton-thick AGN up to z1.5. The zCOSMOS [Ne v]-selected Type-2 AGN provide an ideal sample to apply this promising diagnostic.
In order to compare the [Ne v] line flux measured in zCOSMOS spectra with the integrated Chandra X-ray emission in a fair manner, we need to correct the optical spectral measurements for slit losses. In the redshift interval of interest (z0.65), the 1″-slit width used in zCOSMOS observations corresponds to a physical size greater than 7 kpc, so, unless the sizes of the NLR are unreasonably larger than the typical value of 1 kpc, the line flux that enters the spectrograph aperture can be considered as coming from a point source, and it is essentially affected by seeing variations only. Thus, we corrected the [Ne v] flux for each of our objects using aperture corrections estimated through spectroscopic stars observed in the same multi-slit mask of the analyzed AGN spectrum. In our Type-2 AGN sample, the aperture corrections range between 0.03 and 1.69 mag, with a median value of 0.46 mag. Ten of the [Ne v]-selected galaxies had multiple zCOSMOS spectra, and applying the estimated aperture correction allowed us to lower, on average, the relative flux differences of the repeated measurements from 17% to 9%. The X-ray fluxes are computed in the 2–10 keV rest frame band, without any absorption correction, in order to follow the definition given in Gilli et al. (2010).
The distribution of the X/NeV ratio for the 69 zCOSMOS Type-2 AGN with reliable Chandra measurements (see Section 5.1 for details) is plotted in Figure 12. Gilli et al. (2010) showed that, in a sample of local Seyferts, the AGN with X/NeV15 are almost all Compton-thick. In our [Ne v]-selected sample, 9 Type-2 AGN are below this threshold, being all undetected in the X-rays. These sources can be safely considered robust Compton-thick AGN candidates. Of the the 46 [Ne v]-selected Type-2 AGN with X/NeV upper limits, 39 have X/NeV100, suggesting a column density possibly exceeding cm-2 (Gilli et al., 2010). Conversely, all of the 23 X-ray detected objects fall in the region likely populated mostly by Compton-thin AGN (with 30X/NeV2100).
Synthesis models of the X-ray background (Treister & Urry, 2006; Gilli et al., 2007) predict that the “missing” XRB at 30 keV (i.e. the XRB emission that cannot be accounted for by unobscured and moderately obscured AGN) is indeed produced by Compton-thick objects. According to the synthesis model of Gilli et al. (2007), most of the missing XRB is produced by Compton-thick AGN in the redshift interval z=0.5–1 and with intrinsic 2–10 keV luminosities in the range erg s-1: these intervals match almost perfectly with those of our [Ne v]-selected sample777The [Ne v] or [O iii] luminosities are converted into 2–10 keV intrinsic luminosities following the recipes described in Vignali et al. (2010) and Gilli et al. (2010).
Our sample is therefore placed in the best position to assess the relevance of Compton-thick AGN to the XRB emission. To this purpose, we used X-ray stacking analysis to derive the average X/NeV ratio for the 46 X-ray undetected [Ne v]-selected Type-2 AGN (represented by the empty histogram in Figure 12) and for two sub-samples of these X-ray undetected sources, those with X/NeV30 and those with X/NeV30. The “dividing line” of X/NeV=30 has been chosen to have a similar number of objects in both sub-samples (22 and 24, respectively). For the 46 X-ray undetected [Ne v]-selected Type-2 AGN, the derived average X/NeV ratio is 9.8 (filled circle in Figure 12), while for the X/NeV30 (X/NeV30) sub-sample the ratio is 3.6 (36). We note that for the first sub-sample X-ray photometry in the rest-frame 2–10 keV band provides only a 1.6 detection, while for the second sub-sample we have a 5.8 detection. The results of the stacking analysis were used to tighten the constraints on the Compton-thick AGN fraction among the X-ray undetected sources as follows: an average of 2.6, 1.1 and 3.9 net counts per source were obtained when stacking the total sample of 46 X-ray undetected sources, the “faint” sub-sample of 22 sources with X/NeV30, and the “bright” sub-sample of 24 sources with X/NeV30, respectively. We then assumed that the count statistics of the 46 X-ray undetected sources follows a Poisson distribution with mean 2.6, and verified that this is a good assumption since the integration of the lower and upper half of such a distribution returns an average counts of 1.2 and 3.9, which are in excellent agreement with the values measured for the “faint” and “bright” sub-samples. We then performed 104 Montecarlo runs, each time randomly extracting 46 count values from the Poisson distribution and converting these counts into X-ray fluxes with the prescriptions given in Section 5.1. These random X-ray flux catalogs were associated to the NeV flux catalog of X-ray undetected sources and the corresponding X/NeV ratios were then computed. By considering the whole set of simulations, on average 29.4 sources (with 2.7 rms) were found to have X/NeV15 and are therefore Compton-thick candidates. Based on the above simulations, we estimate that the Compton-thick fraction in our sample of 69 Type-2 AGN is , which is broadly consistent with the expectations from XRB synthesis models (e.g. 50% in Gilli et al. 2007). We stress that the small uncertainties in our estimate of the Compton-thick AGN fraction are just statistical, whereas the systematics related to the selection method and stacking analysis are likely to dominate the error budget. Significant improvements are likely to be obtained by using the data from the recently approved Chandra COSMOS Legacy Survey (2.8 Ms, PI F. Civano), which will observe the outer portion of the COSMOS field and enlarge the total X-ray coverage to 1.7 deg2 at a depth of 160 ks: the 24 objects [Ne v]-selected objects which are now outside the Chandra mosaic should be then observed, and about half of the current X/NeV upper limits should be improved by a factor of 2 (or turn into real measurements) by these new X-ray data. A deeper investigation of the Compton-thick candidates among [Ne v]-selected obscured AGN in COSMOS will be presented in a forthcoming paper (Vignali et al., in preparation), by exploiting both the X-ray techniques (stacking of undetected objects, spectral analysis) and infrared data.
7 Summary
In this paper we have presented a method to select 1 obscured AGN from optical spectroscopic surveys, useful to gather a more complete census of actively accreting black holes in galaxies. The detection of the high-ionization [Ne v] line has been used to pinpoint active nuclei in the 20k-Bright zCOSMOS galaxy sample and we have successfully found systems that escaped other AGN selection techniques.
The [Ne v]-selected Type-2 AGN sample consists of 94 sources in the redshift range 0.65z1.20, spanning the [O iii] luminosity range LL[O iii]L☉. The Type-2 AGN composite spectrum closely resembles the spectrum of a Seyfert 2 galaxy with strong high-ionization narrow lines. Nevertheless, the line ratios would place it in the transition region of diagnostic diagrams, suggesting some star formation contamination. The mean optical extinction of the narrow line AGN sample, estimated from the composite H/H flux ratio, is E(BV)=. The absorption-line continuum of the composite spectrum, fitted with BC03 population synthesis models, gives information on the average stellar content of the hosts, that roughly corresponds to an Sa/Sb galaxy.
In the same redshift interval, the zCOSMOS survey discovered 60 broad-line AGN, 37 of them with a detected [Ne v] line. Comparing the composite spectra of both the full Type-1 sample and the [Ne v]-detected Type-1 sub-sample, no significant differences have been found, which indicates that the latter does not show special optical characteristics with respect to the full sample. The non-detection of the faint [Ne v] emission line in a fraction of Type-1 AGN spectra is therefore probably due to the presence of a stronger continuum in these objects, continuum that is shielded in the NL-sample. The two composite spectra do not show peculiar properties also with respect to other known quasar sample.
The main emission lines have also been accurately measured in all the zCOSMOS spectra of [Ne v]-selected objects. The average [O ii]/[Ne v] flux ratio in the Type-2 AGN sample (4) is significantly larger than in the Type-1 AGN sample (2). If interpreted as due to an excess in the [O ii] luminosity, the larger line ratio is suggestive of enhanced star formation in the obscured population, at least with respect to the sample of Type-1 AGN.
The stellar masses of galaxy hosts cover the range –, and are, on average, higher than those of the galaxy parent sample. The median stellar mass of the Type-2 AGN hosts is , while for the parent galaxy sample is . The fraction of galaxies hosting [Ne v]-selected Type-2 AGN increases with the stellar mass, reaching a maximum of around 3% at 2.
A visual morphological classification has been assigned to 71 out of 94 (76%) of the Type-2 AGN host galaxies using the ACS images available in COSMOS. Comparing the AGN host morphologies with those of a carefully mass-matched sample of normal galaxies, the two distributions do not look strikingly different, although a possible trend in the relative frequency of the Hubble types seems to emerge: the [Ne v]-selected Type-2 AGN do prefer the early-spirals (Sa-Sb) galaxies, with an expected lack of late-spirals and Irregulars morphologies. Moreover, a lower fraction of elliptical galaxy hosts, at least with respect to the control sample, is observed. The host galaxy population, which shows later morphologies with respect to brighter Type-2 AGN samples (i.e. the SDSS sample of Zakamska et al., 2006, who found mainly elliptical hosts), is probably related to the different nuclear luminosity of the samples: our [Ne v]-selected objects cover an [O iii] luminosity range at least an order of magnitude fainter than SDDS Type-2 quasars.
The selection techniques of Type-2 AGN at z1 have also been investigated, with respect to their relative efficiency. First, the [Ne v]-selected sample has been compared with the C-COSMOS catalog of X-ray sources: the [Ne v] technique discovered a large fraction of Type-2 AGN (46/69, 67%) undetected in the medium-depth, wide-area Chandra survey. Many of these X-ray faint, [Ne v] emitting galaxies may be heavily obscured active nuclei, especially if we consider that, of the 39 zCOSMOS broad line AGN falling in the Chandra region, all but two are detected in the X-rays. Conversely, a substantial number of X-ray luminous galaxies (158) do not show a detectable [Ne v] emission, neither in single zCOSMOS spectra, nor in the stacked optical spectrum. Similar results have been obtained in comparing [Ne v] and line ratio selection methods: the blue diagnostic diagram, based on [O iii]/H versus [O ii]/H line ratios, includes 48 [Ne v]-selected Type-2 AGN, and again a large fraction of them (29/48, 60%) fall in the star-forming region of the diagram. Likewise, 55 out of 66 (83%) luminous X-ray sources fall in the region of star-forming galaxies. The [Ne v]-selected and X-ray-emitting Type-2 AGN share similar position and class distribution in the [O iii]/H versus [O ii]/H plane, but these two methods alone cannot provide a fairly complete Type-2 AGN selection, since a significant number of emission line galaxies (136), without a visible [Ne v] line in the spectra and undetected in X-rays, are classified as active by the diagnostic diagram. Finally, the Mass-Excitation diagnostic diagram seems the most comprehensive of the analyzed selection techniques, since more than 50% of the Type-2 AGN identified by other methods are classified as AGN according to the MEx diagram. However, MEx-AGN classification may not always hold on an individual galaxy basis and the degree of contamination is probably the main drawback of the method, as only 20% of the MEx-AGN candidates are selected by one of the other techniques.
Finally, the 2–10 keV to [Ne v] emission line luminosity ratio has been exploited to search for the more heavily obscured AGN. For the 69 [Ne v]-selected Type-2 AGN with reliable Chandra measurements, a significant fraction (46 objects, 67%) is undetected in the X-rays and only X/NeV upper limits can be derived. We exploited X-ray stacking analysis to estimate the average X/NeV ratio for the X-ray undetected [Ne v]-selected galaxies. A set of Montecarlo simulations, based on simple assumptions, was performed, finding that the Compton-thick fraction in our sample of Type-2 AGN is of the order of 40%, in good agreement with the XRB synthesis models (Gilli et al., 2007). Conversely, all the 23 X-ray detected, [Ne v]-selected Type-2 AGN fall in the region of the Compton-thin objects. We intend to further investigate the nature of these Compton-thick AGN candidates in a forthcoming paper.
Acknowledgements.
This work was supported by the INAF Grant “PRIN–2010”. We also acknowledge financial contribution from the agreement ASI-INAF I/009/10/0. and from the “PRIN–INAF 2011”. The authors would like to thank the referee for his/her valuable suggestions and Stéphanie Juneau for helpful discussions and for sharing her results prior to publication.References
- Aird et al. (2012) Aird, J., Coil, A.L., Moustakas, J., et al. 2012 ApJ, 746, 90
- Arnaud (1996) Arnaud, K.A. 1996 in “Astronomical Data Analysis Software and Systems V”, A.S.P. Conference Series, Vol. 101, 17
- Antonucci (1993) Antonucci, R. 1993 ARA&A, 31, 473
- Baldwin (1977) Baldwin, J.A. 1977 ApJ, 214, 679
- Baldwin et al. (1981) Baldwin, J.A., Phillips, M.M. & Terlevich R. 1981 PASP, 93, 5
- Bolzonella et al. (2010) Bolzonella, M., Kovac̈, K., Pozzetti, L., et al. 2010 A&A, 524, A76
- Bongiorno et al. (2010) Bongiorno, A., Mignoli, M., Zamorani, G., et al. 2010 A&A, 510, A56
- Bongiorno et al. (2012) Bongiorno, A., Merloni, A., Brusa, M., et al. 2012 MNRAS, in press.
- Brandt & Hasinger (2005) Brandt, W.N., & Hasinger, G. 2005 ARA&A, 43, 827
- Broos et al. (2010) Broos, P.S., Townsley, L.K., Feigelson, E.D., et al. 2010 ApJ, 714, 1582
- Bruzual & Charlot (2003) Bruzual, G. & Charlot, S. 2003 MNRAS, 344, 1000
- Buzzoni (2005) Buzzoni, A. 2005 MNRAS, 361, 725
- Capak et al. (2007) Capak, P., Aussel, H., Ajiki, M., et al. 2007 ApJS, 172, 99
- Croom et al. (2004) Croom, S.M., Smith, R.J., Boyle, B.J., et al. 2004 MNRAS, 349, 1397
- Elvis et al. (2009) Elvis, M., Civano, F., Vignali, C., et al. 2009
- Ferrarese & Merritt (2000) Ferrarese, L., & Merritt, D. 2000 ApJ, 539, 9
- Garilli et al. (2010) Garilli, B., Fumana, M., Franzetti, P., et al. 2010 PASP, 122, 827
- Gavignaud et al. (2006) Gavignaud, I., Bongiorno, A., Paltani, S., et al. 2006 A&A, 457, 79
- Gebhardt et al. (2000) Gebhardt, K., Kormendy, J., Ho, L.C., et al. 2000 ApJ, 543, 5
- Gilli et al. (2007) Gilli, R., Comastri, A., & Hasinger, G. 2007 A&A, 463, 79
- Gilli et al. (2010) Gilli, R., Vignali, C., Mignoli, M., et al. 2010 A&A, 519, 92
- Heckman (1980) Heckman, T.M. 1980 A&A, 87, 152
- Haehnelt et al. (2001) Haehnelt, M.G., Madau, P., Kudritzki, R & Haardt, F. ApJ, 549, L151
- Ilbert et al. (2005) Ilbert, O, Tresse, L., Zucca, E., et al. 2005 A&A, 439, 863
- Izotov et al. (2004) Izotov, Y.I. , Noeske, K.G., Guseva, N.G., et al. 2004 A&A, 415, L27
- Juneau et al. (2011) Juneau, S., Dickinson, M., Alexander, D.M., & Salim, S. 2011 ApJ, 736, 104
- Kauffmann et al. (2003) Kauffmann, G., Heckman, T.M., Tremonti, C., et al. 2003 MNRAS, 346, 1055
- Koekemoer et al. (2007) Koekemoer, A.M., Aussel, H., Calzetti, D., et al. 2007
- Kormendy & Richstone (1995) Kormendy, J., & Richstone, D. 1995 ARA&A, 33, 581
- Lamareille et al. (2004) Lamareille, F., Mouhcine, M., Contini, T., et al. 2004 MNRAS, 350, 396
- Lamareille et al. (2009) Lamareille, F., Brinchmann, J., Contini, T., et al. 2009 A&A, 495, 53
- Lamareille (2010) Lamareille, F. 2010 A&A, 509, 53
- Lanzuisi et al. (2013) Lanzuisi, G., Civano, F., Elvis, M., et al. 2013 MNRAS, 431, 978
- Le Févre et al. (2005) Le Févre, O., Vettolani, G., Garilli, B., et al. 2005 A&A, 439, 845
- Lilly et al. (2007) Lilly, S.J., Le Févre, O., Renzini, A., et al. 2007 ApJS, 172, 70
- Lilly et al. (2009) Lilly, S.J., Le Brun, V., Maier, C., et al. 2009 ApJS, 184, 218
- Magorrian et al. (1998) Magorrian, J., Tremaine, S., Richstone, D., et al. 1998 AJ115, 2285
- Marconi et al. (2004) Marconi, A., Risaliti, G., Gilli, R., et al. 2004 MNRAS, 351, 169
- McIntosh et al. (1999) McIntosh, D.H., Rix, H.-W., Rieke, M.J., & Foltz, C. B 1999 ApJ, 517, L73
- Mignoli et al. (2009) Mignoli, M., Zamorani, G., Scodeggio, M., et al. 2009 A&A, 493, 39
- Moran et al. (1999) Moran, E.C., Lehnert, M.D., & Helfand, D.J. 1999 ApJ, 526, 649
- Nair & Abraham (2010) Nair, P.B. & Abraham, R.G. 2010 ApJS, 186, 427
- Pozzetti et al. (2010) Pozzetti, L., Bolzonella, M., Zucca E., et al. 2010 A&A, 523, A13
- Puccetti et al. (2009) Puccetti, S., Vignali, C., Cappelluti, N., et al. 2009 ApJS, 185, 586
- Rola et al. (1997) Rola, C.S., Terlevich, E., Terlevich, R.J. 1997 MNRAS, 289, 419
- Rees (1984) Rees, M.J. 1984 ARA&A, 22, 471
- Richards et al. (2006) Richards, G.T., Strauss, M.A., Fan, X., et al. 2006 AJ, 131, 2766
- Schawinski et al. (2010) Schawinski, K., Urry, C.M., Virani, S., et al. 2010 ApJ, 711, 284
- Schmidt et al. (1998) Schmidt, M., Hasinger, G., Gunn, J., et al. 1998 A&A, 329, 495
- Scodeggio et al. (2005) Scodeggio, M., Franzetti, P., Garilli, B., et al. 2005 PASP, 117, 1284
- Scoville et al. (2007) Scoville, N., Abraham, R.G., Aussel, H., et al. 2007 ApJS, 172, 38
- Silverman et al. (2008) Silverman, J.D., Mainieri, V., Lehmer, B.D., et al. 2008 ApJ, 675, 1025
- Silverman et al. (2009) Silverman, J.D., Lamareille, F., Maier, C., et al. 2009 ApJ, 696, 396
- Soltan (1982) Soltan, A. 1982, MNRAS, 200, 115
- Stasiǹska et al. (2006) Stasiǹska, G., Cid Fernandes, R., Mateus, A., et al. 2006 MNRAS, 371, 972
- Treister & Urry (2006) Treister, E. & Urry, M.C. 2006 ApJ, 652, L79
- Tremaine et al. (2002) Tremaine, S., Gebhardt, K., Bender, R. et al. 2002 ApJ, 574, 740
- Vanden Berk et al. (2001) Vanden Berk, D.E., Richards, G.T., Bauer, A., et al. 2001 AJ, 122, 549
- Vignali et al. (2010) Vignali, C., Alexander, D. M., Gilli, R., & Pozzi, F. 2010 MNRAS, 404, 48
- Zakamska et al. (2006) Zakamska, N.L., Strauss, M.A., Krolik, J.H., et al. 2006 AJ, 132, 1496
- Zamorani et al. (1992) Zamorani, G., Marano, B., Mignoli, M., et al. 1992 MNRAS, 200, 115
- Zucca et al. (2009) Zucca, E., Bardelli, S., Bolzonella, M., et al. 2009 A&A, 508, 1217