Mid-infrared Spectral Properties of Post-Starburst Quasars
Abstract
We present Spitzer InfraRed Spectrograph (IRS) low-resolution spectra of 16 spectroscopically selected post-starburst quasars (PSQs) at z 0.3. The optical spectra of these broad-lined active galactic nuclei (AGNs) simultaneously show spectral signatures of massive intermediate-aged stellar populations making them good candidates for studying the connections between AGNs and their hosts. The resulting spectra show relatively strong polycyclic aromatic hydrocarbon (PAH) emission features at 6.2 and 11.3 µm and a very weak silicate feature, indicative of ongoing star formation and low dust obscuration levels for the AGNs. We find that the mid-infrared composite spectrum of PSQs has spectral properties between ULIRGs and QSOs, suggesting that PSQs are hybrid AGN and starburst systems as also seen in their optical spectra. We also find that PSQs in early-type host galaxies tend to have relatively strong AGN activities, while those in spiral hosts have stronger PAH emission, indicating more star formation.
1 INTRODUCTION
Active galactic nuclei (AGNs) are powered by accretion of mass onto the super-massive black holes (SMBHs), which have also been found to exist at the centers of essentially all massive non-active galaxies (e.g., Kormendy & Richstone, 1995). This leads to the general belief that AGNs play an important role in the formation and evolution of galaxies and several tight correlations have been found between the mass of SMBHs and various properties of host galaxies, such as the velocity dispersion, (Ferrarese & Merritt, 2000; Gebhardt et al., 2000; Tremaine et al., 2002), the mass of the host bulge (Magorrian et al., 1998; Häring & Rix, 2004; Graham, 2004, 2012), and the luminosity of the host bulge (Kormendy & Richstone, 1995; Marconi & Hunt, 2003; Graham & Scott, 2013). Furthermore, studies have found that the activities of AGN and star formation are also related, both peaking at similar redshifts and declining to the local downsized Universe together (Hopkins, 2004; Silverman et al., 2008; Aird et al., 2010; Han et al., 2012). All this evidence suggests that SMBHs and their host galaxies share mutual evolutionary histories (Croton et al., 2006; Bower et al., 2006; Di Matteo et al., 2005, 2008; Hopkins et al., 2005, 2006, 2008).
While the observational evidence is still not conclusive, theoretical studies have suggested two mechanisms responsible for the trigger of starbursts and the ignition of AGN activity. In the early universe, major-mergers provide abundant fuel for the brightest quasars as having been observed (e.g., Treister et al., 2012), leading to their space density peaking at 2-3. In the mean time, a dusty starburst is also triggered by the mergers and the star formation rate peaks at the same redshift range (e.g., Bouwens et al., 2009). In a later stage below , AGN cosmic downsizing happens (e.g., Heckman et al., 2004) in which the space density of low-luminosity AGNs peaks at these redshifts because secular evolution and minor interactions become the main fueling mechanisms.
Despite the fact that an evolutionary sequence is still unclear, both massive starburst and AGN activity can co-exist and heat the luminous infrared galaxies (LIRGs, ) and ultra luminous infrared galaxies (ULIRGs, ) (e.g., Sanders et al., 1988; Magnelli et al., 2011; Murphy et al., 2011). As LIRGs and ULIRGs evolve, the AGN, instead of the dusty starburst, begins to dominate the IR emission and heats the dust to higher temperatures, eventually destroying or excavating the dust and gas associated with the starburst, not only quenching the star formation, but also halting the black hole growth and limiting the SMBH mass (Di Matteo et al., 2005). When the AGN runs out of fuel and stops being active, SMBHs are left in the center of massive galaxies.
Post-starburst quasars (PSQ) are objects which show simultaneously an AGN and a massive luminous post-starburst stellar population, with composite spectra displaying broad emission lines as well as the Balmer jumps and strong Balmer absorption lines characteristic of type-A stars. The prototype of PSQ is UN J1025-0040 (Brotherton et al., 1999; Canalizo et al., 2000; Brotherton et al., 2002). Its strong stellar component has an age of Myr, and a bolometric luminosity comparable to that of the quasar. A younger UN J1025-0044 would have a more luminous stellar population and would likely be dust enshrouded, placing it in the ULIRG class. This object was proposed as representative of ULIRGs making an evolutionary transition into a quasar phase.
The large quasar surveys like the Sloan Digital Sky Survey (SDSS) have made statistical studies of PSQs possible. A sample of luminous PSQs, spectroscopically selected from SDSS, at , were studied via HST/ACS F606W imaging (Cales et al. 2011, hereafter C11) and Keck/KPNO high signal-to-noise ratio (S/N) optical spectroscopy (Cales et al. 2013, hereafter C13). These studies showed that PSQs have a heterogeneous population of both early-type and spiral hosts. Although these two subsets have similar disturbance fractions in their hosts, the starburst mass and age of their hosts and the AGN SMBH mass and Eddington fractions are different. They concluded that the early-type PSQs likely result from major mergers and are evolved (U)LIRGs, while spiral PSQs imply more complicated star-formation history and are likely triggered by more common non-merger events (e.g., harassment, bars). The two types of PSQs with different AGN and post-starburst signatures suggests that at least two mechanisms are responsible for their triggering, supporting the relevant theoretical studies involving mutual BH-bulge growth (e.g., Hopkins & Hernquist, 2009; Schawinski et al., 2010). Only the PSQs with early-type hosts, however, appear to represent transitioning objects in the classic evolutionary sequence involving major mergers. They also note that the PSQs with spiral hosts show morphological features and emission-line ratios indicating they possess ongoing or recent star formation in addition to a dominant post-starburst stellar population.
We continue the study of the PSQs from C11 and C13 here, in which we investigate the mid-infrared (MIR) spectroscopic properties of 16 PSQs using Spitzer IRS observations. We compare their MIR spectral features with host morphologies, MIR colors, and other properties in an effort to better understand PSQs and their relationships to quasars and starburst galaxies more generally.
The MIR continuum is emitted by warm dust heated by high-energy photons from an AGN, star formation, or some mix of the two. Since the MIR continuum emission may be a combination of thermal radiation from dust with different temperatures, its shape and slope can help us understand the energy source. Below 20 µm the continuum can be represented with a power law (, Mullaney et al. 2011), and it flattens at longer wavelengths.
In addition to information contained in the continuum, several MIR spectral features can be used to diagnose the relative AGN/starburst contributions to the total infrared luminosity.
First, polycyclic aromatic hydrocarbon (PAH) emission lines exhibited in the MIR spectrum can indicate intense star formation, because PAHs are excited by UV and/or optical photons mostly from young stars instead of from AGNs (e.g., Peeters et al., 2004; Brandl et al., 2006). Based on early Spitzer observations, several studies (Schweitzer et al., 2006; Netzer et al., 2007; Shi et al., 2007; Hao et al., 2007) have reported the detection of PAH emission features in quasars selected with different properties, including optically blue PG quasars, 2MASS red quasars, and 3CR radio quasars. This suggests that star formation occurs widely in quasars and may also be present in PSQs.
Second, The 9.7 µm and 18 µm silicate absorption or emission features are present in the mid-IR spectrum of quasars (e.g., Hao et al., 2007). The silicate emission is suggested to arise mainly from the inner edge of the dusty AGN torus according to AGN unified schemes (e.g., Antonucci, 1993; Urry & Padovani, 1995), while the absorption features may be produced by a dust screen surrounding a hot emission region.
Our sample of PSQs is described in Section 2. Details of the observations and data reduction are explained in Section 3. We describe the measurements of the PSQs spectral features in Section 4. The mid-infrared composite spectrum of PSQs are given in Section 5.1. Results and discussions are given in Section 5 . Finally we summarize our results in Section 6. We adopt cosmological parameters Mpc-1, , and throughout this paper.
2 SAMPLE
Our sample was drawn from the HST snapshot program described by C11. There were 80 objects in the program and we eventually obtained HST images for 29 objects. Before the HST snapshot program had been completed, we proposed and obtained Spitzer IRS observations of the 16 objects that currently had HST imaging. These 16 objects are studied in this paper and they are also included in a subsample of 38 PSQs studied with high S/N optical spectroscopy for separating the AGN and stellar components (C13).
We summarize the selection criteria here, but see also C11 for more details. All PSQs were spectroscopically selected from the Sloan Digital Sky Survey data release 3 (SDSS DR3, Abazajian et al., 2005), and all objects have broad optical emission lines with FWHM and significant detections of Balmer absorption lines and Balmer jumps indicative of intermediate-age stellar populations (100s of Megayears). Additionally all objects have and -22.9.
Given our selection method for the 80 HST targets and the random selection of the SNAP observations, the 16 targets are likely representative for the class within the redshift range. Despite this small sample size, the luminosity of the sample spans 1.5 dex, relatively significant for statistical studies.
3 OBSERVATION AND DATA REDUCTION
Mid-infrared spectra of 16 PSQs were obtained with the Spitzer Infrared Spectrograph (IRS, Houck et al., 2004) as part of our GO program (Program ID 30075). All 16 of the objects were observed in staring mode with the Short Low first-order module (SL1 & SL2), which covers 5-14 µm, and with the Long Low second-order module (LL1 & LL2), which covers 14-40 µm. The Ramp Duration and Number of Cycles of the observations are listed in Table 1. The Spitzer IRS has a slit width of 3″.6 for SL and 10″.7 for LL, corresponding to 16 kpc and 47 kpc at , respectively. The angular size of the majority of our objects is consistent with the expected PSF size, thus we treated them as point sources.
We started with the standard pipeline products of co-added, non-subtracted post-BCD frames. The bad pixels in the images were removed with the interactive IDL procedure IRSCLEAN (version 2.1.1). Subtraction of 2-dimensional images with different nod positions of the same spectral order was used for sky subtraction. One-dimensional spectra were extracted with Spitzer IRS Custom Extraction software (SPICE; version 2.5). We adopted the optimal extraction method for point sources with default parameters. During this extraction, pixels are given different weights based on their positions and a spatial profile of a bright calibration star. Standard IRS flux calibration is applied, which also corrects slit losses for unresolved sources. The uncertainty of flux calibration is within 5%. For each object, we obtained 6 individual 1-dimensional spectra from each of the two nod positions. Corresponding spectra of the two nod positions agree well with each other in both flux level and spectral shape. The “bonus” 3rd order short spectra have very low S/N and were discarded. We averaged all other individual spectra to obtain the final spectrum of each source over the entire wavelength range.
We specifically checked the region near 14 µm where different IRS spectral orders are stitched. We found no flux excess in the wider-slit LL modules compared to the SL modules, confirming that there is no substantial slit loss and our objects can be treated as point sources. We also compared our spectra with those produced from the standard Post-BCD pipeline and found that the flux level matches well and ours have higher S/N due to the optimal extraction.
4 SPECTRAL MEASUREMENTS
Table 2 lists our measurements of the PAH line fluxes and equivalent widths (EWs), silicate strength defined by Hao et al. (2007), integrated fluxes around 5.5 µm and 15 µm. The PAH features are measured by fitting a single Gaussian profile and a local continuum between 5.5 µm to 6.9 µm for 6.2 µm PAH and between 11.0 µm to 11.7 µm for 11.3 µm PAH. When the S/N is too low to measure, we estimated a 3 upper limit by simulating a Gaussian emission profile with the typical PAH FWHM of 0.2 µm (Smith et al., 2007) of the low-resolution observing mode. We cannot obtain a clean measurement for the PAH 7.7 µm feature because of the complicated line blending in that region and low S/N of our spectra.
Since the S/N of our spectra is relatively low, there is probably no sufficient information for detailed modeling such as PAHFIT (Smith et al., 2007), which can decomposes the spectra using physically motivated models involving PAH emissions, gas temperatures, narrow emission lines, dust absorptions, etc. Our comparison shows that the PAH EWs measured using PAHFIT are roughly twice as large as those measured using Gaussian profile fit (Fig. 1), because part of the Gaussian fit continuum is accounted for by the broad wings of PAH emission models in PAHFIT. However, the PAH EWs measured using the two methods are strongly correlated for our sample and therefore the choice of adopting either measurement in the analyses does not affect the conclusions.
Table 2 includes some additional information of interest. We obtained the Wide-Field Infrared Survey Explorer (WISE, Wright et al., 2010) profile-fit magnitudes and uncertainties of our sources from the WISE All-Sky Release Point Source Catalog (Cutri & et al., 2012). We tabulate the WISE (i.e., [3.4 µm] [4.6 µm]) MIR color here in column 9. Column 10 provides host morphology classification from Cales et al. (2011).
5 RESULTS AND DISCUSSION
5.1 Composite Spectra
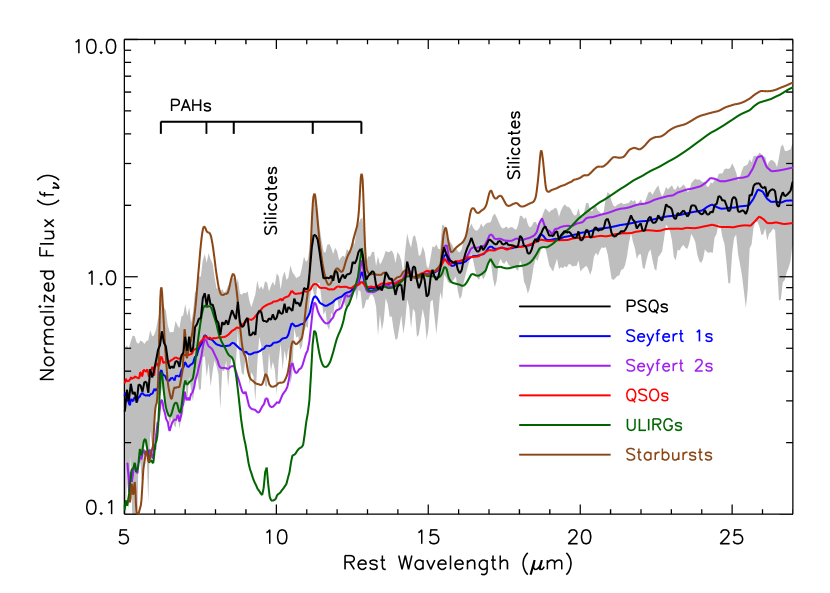
Because we are interested in PSQ ensemble as well as individual characteristics, we construct composite spectra. First, we created a composite of the total sample of 16 PSQs by normalizing their spectra at rest-frame 14.5 µm and applying a median combine. In Fig. 2, we compare our PSQ composite spectrum with those of Seyferts, PG QSOs, and ULIRGs (Hao et al., 2007) as well as starburst (Brandl et al., 2006). It is clear that the PSQs lie between ULIRGs and QSOs, especially between 15 µm to 30 µm where it is closer to Seyfert 1. While type I QSOs show emission in the 9.7 µm silicate feature, meanwhile ULIRGs and type II AGNs show absorption, PSQs do not seem to show either emission or absorption. In addition, the PAH features in PSQs are stronger than those in type I AGNs, but weaker than those in starbursts. These comparisons are consistent with the idea that PSQs are hybrids of AGN and starbursts as also seen in optical spectra.
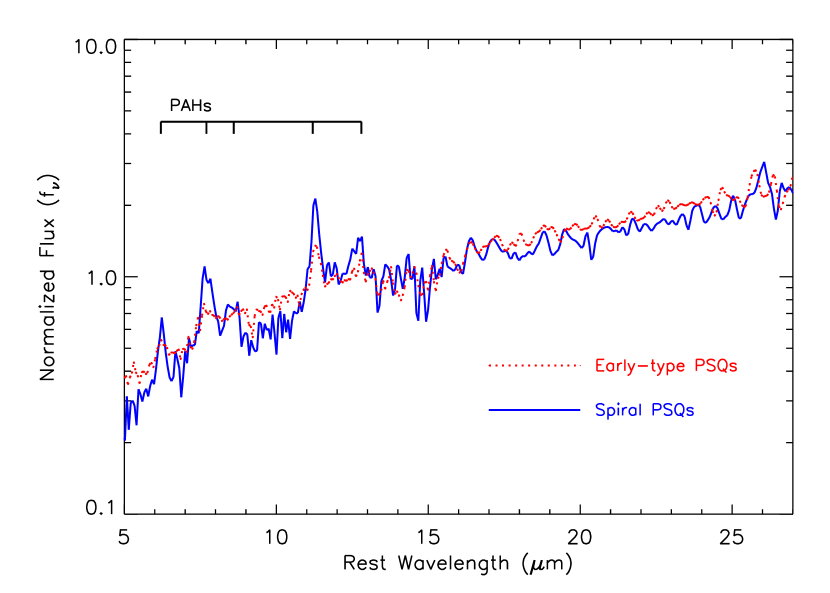
We have also constructed composite spectra based on the host morphologies. For the 16 PSQs in our sample, there are 8 with early-type hosts, 7 with spiral hosts, and one with indeterminate classification which is not included in constructing composite spectra. Fig. 3 shows the two composite spectra. The continuum shapes show a remarkable similarity, indicating a very small variation of the MIR SEDs of PSQs residing in different types of host galaxies. A slight difference is that the PAH emission features are stronger in PSQs with spiral hosts, suggesting more star formation activity.
5.2 PSQs in Diagnostic Diagrams
Several MIR diagnostic diagrams have been developed to study the nature of the infrared emission (e.g., Genzel et al., 1998; Lutz et al., 1998; Rigopoulou et al., 1999; Laurent et al., 2000; Peeters et al., 2004; Spoon et al., 2007). The strength of the PAH features can be used to distinguish the dominant energy source, AGN or stellar; and the silicate absorption or emission can be used to diagnose obscured or unobscured sources.
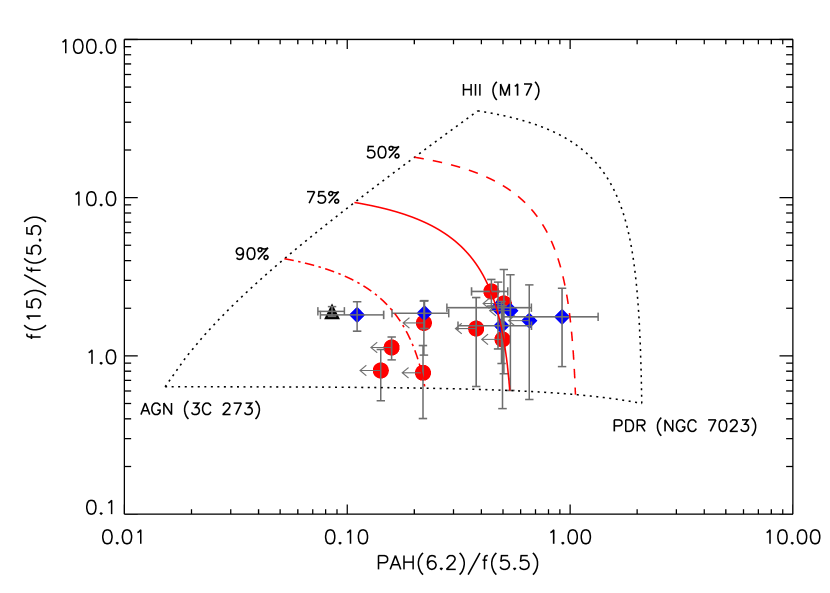
Figure 4 shows our objects in the diagnostic diagram of Armus et al. (2007) where the flux ratio at 15 µm and 5.5 µm () and the ratio of the 6.2 µm PAH flux to are used to distinguish the dominant type of emission region: AGN, starburst (HII) or photodissociated region (PDR). All our PSQs fall in the middle of the diagram, indicating they are intermediate between AGN and starburst, but with all having more than 50% contribution from AGNs.
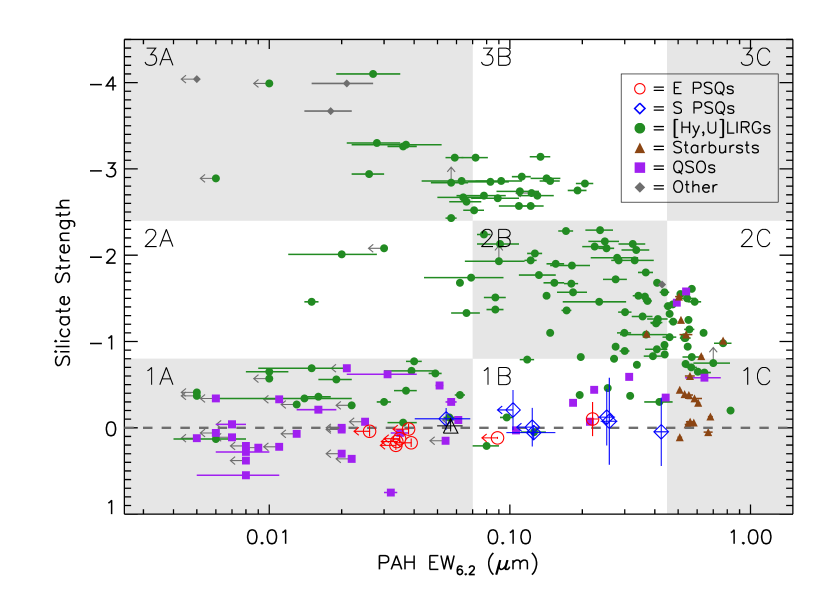
The “fork diagram” of Spoon et al. (2007), simply involving the EW of PAH 6.2 µm (EW6.2) and the strength of the 9.7 µm silicate feature, provides better diagnostics. We reproduced the diagram in Figure 5 using data from Spoon et al. (2007) and added the PSQs. It is clear that hyperluminous infrared galaxies (HyLIRGs) and ULIRGs show more silicate absorption because of their dust rich environment, while unobscured QSOs suppress PAH emission. Again, PSQs have the MIR properties between pure AGNs and pure starbursts, consistent with the above and the evidence from the composite spectra (§ 5.1). Moreover, the silicate strength of PSQs is very weak and uncertain, showing no obvious absorption (or emission) and suggesting that PSQs are probably not obscured, or at least not heavily obscured. Both the host galaxy and the circumnuclear dust torus can be responsible for the absorption of the silicate features, and thus the obscuration of the PSQs. Goulding et al. (2012) have studied a sample of Compton-thick AGNs and suggested that the silicate absorption seems to originate from the host galaxy. However, with current data, we cannot address whether the lack of obscuration of our objects is due to the host galaxy or the torus.
When studying 70 luminous infrared galaxies (), Hernán-Caballero et al. (2009) also compiled a reference sample of 137 low-redshift sources including quasars, type 1 and 2 Seyfert galaxies, ULIRGs and starbursts. They compared different MIR diagnostic diagrams using the combined sample of more than 200 sources and found that EW separates most starburst-dominated and AGN-dominated sources. This criterion would place most PSQs as AGN-dominated. While this definition is somewhat arbitrary, we do notice when using this definition that PSQs in early-type hosts are more AGN-dominated and those in spiral hosts seem to be closer to starbursts.
Based on all the evidence from the PSQ composite spectrum and diagnostic diagrams, we can infer that the dust in PSQs is heated by both AGN and stellar process. The PAH emission strengths of PSQs are higher than those of PG QSOs, but similar to those of ULIRGs, as seen in Figure 5. This may imply that PSQs are more similar to ULIRGs than to QSOs, except that PSQs do not show obvious silicate absorptions as ULIRGs, indicating that PSQs are unobscured AGNs. But on the other hand, the fact that the PAH molecules in PSQs can survive the high energy photons from the central AGN suggests that they must be shielded by a large amount of gas and dust from radiation (see Schweitzer et al., 2006). It is therefore reasonable to suggest that PSQs have less dust absorption than ULIRGs, but perhaps more than QSOs. The PSQ properties revealed in the mid-IR agrees with those from the optical, especially supporting the hypothesis in an evolutionary scenario that the PSQs are in a transitional phase from ULIRGs to classical QSOs as they emerge from their dust cocoons.
5.3 Mid-IR Properties of PSQs and Host Galaxy Type
PSQs in early-type and spiral hosts show different PAH strengths, as seen in §5.1 and §5.2. We explore this difference more quantitatively below mainly with the PAH 11.3 µm emission feature which has higher S/N for our objects.
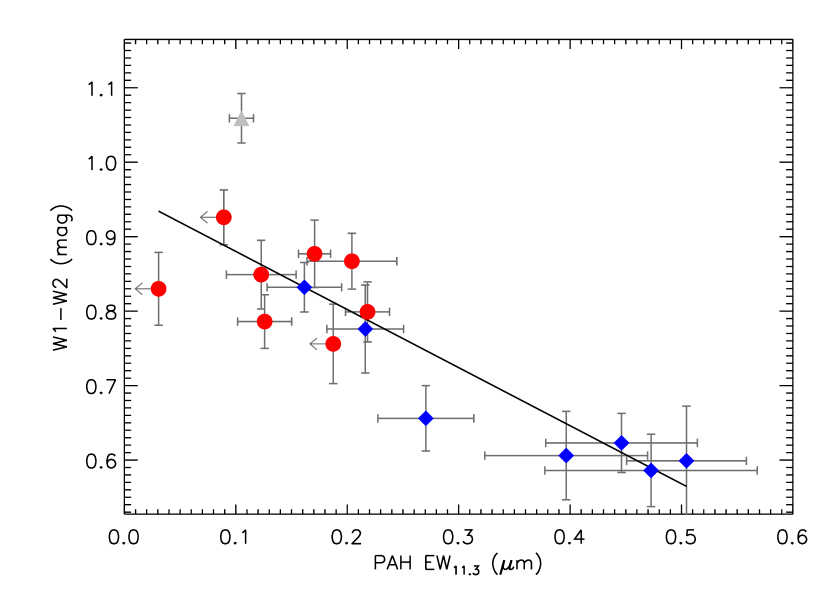
Fig. 6 shows the distributions of PAH EW11.3 for the entire PSQ sample, the spiral-host PSQs, and the early-type host PSQs. The spiral-host PSQs have statistically stronger PAH EW11.3 (mean EW) than those with early-type host (mean EW, including 3 upper limits). This can also be seen clearly in Fig. 7, implying that spiral-host PSQs have more ongoing or recent star formation.
Stern et al. (2012) identified a sample of 130 AGNs in the COSMOS field (Scoville et al., 2007) using a simple WISE mid-infrared color and suggested using WISE color as a good criterion to select both unobscured and obscured AGNs. This color selection criterion is independent of optical colors, radio and X-ray properties of their selected AGNs whose redshifts span between . For our objects with similar redshifts, we can also use as a tracer of AGN dominance. Fig. 6 shows the distributions of . The difference between the two host types are obvious with PSQs in early-type hosts showing greater AGN contribution, confirming the results from the optical work (C11, C13) that AGNs of PSQs hosted by early-type galaxies have on average greater AGN luminosity than those hosted by spiral galaxies. Fig. 7 also shows distinct regions for the two host types, as well as a strong anticorrelation between PAH EW11.3 and . At least two factors may be responsible for this anticorrelation. First, continuum emission from warm dust rises with increasing AGN activity and therefore dilutes the EW of PAH emission even if the flux of the PAH emission remains the same. Second, PAH molecules can be destroyed by high energy photons (e.g., Voit, 1992) with increasing AGN activity as indicated by higher .
Our results are consistent with many previous studies that have compared MIR spectral properties with optical diagnostics and specifically investigated the connections between the PAH emissions, star formation, and AGN activities, using different samples in the local () universe (e.g., O’Dowd et al., 2009; Treyer et al., 2010; LaMassa et al., 2012). They found that AGN dominated sources have weaker PAH EWs and if this is caused by the ionization field hardness, it is only true for the AGN population and cannot be generalized for the star-forming population. While our small sample, with higher luminosity and higher redshift (compared to for most Seyfert 2s in LaMassa et al. (2012)), also shows weaker PAH emission with increasing AGN activity, the data quality of our sample does not allow us to address the issue of the hardness of radiation fields.
We have also looked for correlations between MIR properties and derived parameters of AGN (black hole mass and Eddington accretion rate) or starburst (age and mass) that were obtained from the optical spectral decompositions in C13, and found no significant relationships of interest. No correlation was seen between optical AGN and starburst parameters either (C13), which is perhaps surprising. We note that there may be several reasons for this. 1. Our sample is small and the uncertainty of the measured parameters due to low S/N may have hidden the expected connections. 2. The derived parameters of AGN and starburst from the optical spectral decomposition may have intrinsic uncertainty due to possible degeneracy issues in the spectral modeling. 3. There does not exist any correlation between these parameters which leads to the inevitable thought that the dust structure of PSQs, the interaction between black hole, starburst, and dust may be more complicated than we thought.
6 SUMMARY
We have studied the MIR spectral properties of 16 PSQs based on observations with Spitzer IRS, trying to better understand the nature of the PSQs. All of our analyses show consistent results.
1. MIR spectra show supporting evidence that PSQs are hybrid AGN and starburst systems as seen in the optical spectra.
2. Diagnostic diagrams as well as all detailed MIR features in the PSQ composite spectrum, including continuum slope, silicate features, and PAH emission features (6.2 µm and 11.3 µm), seem to place PSQs in between ULIRGs and normal QSOs, supporting the hypothesis that some PSQs are in the transition phase from ULIRGs evolving to QSOs (e.g. those in early type hosts) or simply hybrid objects triggered by events less dramatic than major mergers (e.g., those in spiral hosts).
3. PSQs in early-type hosts have greater AGN activity, consistent with the results from optical studies (C11).
4. PSQs in spiral hosts have stronger PAH emission, indicating that they have more ongoing star formation.
5. PAH emission decreases with increasing AGN dominance in PSQs (Fig. 7), suggesting that the PAH emission is either diluted by AGN continuum or the PAH molecules are destroyed by high energy photos from AGN.
These luminous PSQs are interesting, extreme hybrid or transitory objects. Both optical and infrared diagnostics provide a consistent picture in which we see two populations distinguished by their host morphology, one likely representative of major-merger triggers thought to be common in the so-called “quasar epoch” of , and the other characteristic of the more local “downsized universe” in which lower mass and lower luminosity systems are active and triggered by less dramatic events. PSQs seem to be useful as objects capable of diagnosing the two paths toward AGN activity associated with bursts of star formation.
References
- Abazajian et al. (2005) Abazajian, K., Adelman-McCarthy, J. K., Agüeros, M. A., et al. 2005, AJ, 129, 1755
- Aird et al. (2010) Aird, J., Nandra, K., Laird, E. S., et al. 2010, MNRAS, 401, 2531
- Antonucci (1993) Antonucci, R. 1993, ARA&A, 31, 473
- Armus et al. (2007) Armus, L., Charmandaris, V., Bernard-Salas, J., et al. 2007, ApJ, 656, 148
- Bouwens et al. (2009) Bouwens, R. J., Illingworth, G. D., Franx, M., et al. 2009, ApJ, 705, 936
- Bower et al. (2006) Bower, R. G., Benson, A. J., Malbon, R., et al. 2006, MNRAS, 370, 645
- Brandl et al. (2006) Brandl, B. R., Bernard-Salas, J., Spoon, H. W. W., et al. 2006, ApJ, 653, 1129
- Brotherton et al. (1999) Brotherton, M. S., van Breugel, W., Stanford, S. A., et al. 1999, ApJ, 520, L87
- Brotherton et al. (2002) Brotherton, M. S., Grabelsky, M., Canalizo, G., et al. 2002, PASP, 114, 593
- Cales et al. (2011) Cales, S. L., Brotherton, M. S., Shang, Z., et al. 2011, ApJ, 741, 106
- Cales et al. (2013) Cales, S. L., Brotherton, M. S., Shang, Z., et al. 2013, ApJ, 762, 90
- Canalizo et al. (2000) Canalizo, G., Stockton, A., Brotherton, M. S., & van Breugel, W. 2000, AJ, 119, 59
- Croton et al. (2006) Croton, D. J., Springel, V., White, S. D. M., et al. 2006, MNRAS, 365, 11
- Cutri & et al. (2012) Cutri, R. M., & et al. 2012, VizieR Online Data Catalog, 2311, 0
- Di Matteo et al. (2005) Di Matteo, T., Springel, V., & Hernquist, L. 2005, Nature, 433, 604
- Di Matteo et al. (2008) Di Matteo, T., Colberg, J., Springel, V., Hernquist, L., & Sijacki, D. 2008, ApJ, 676, 33
- Ferrarese & Merritt (2000) Ferrarese, L., & Merritt, D. 2000, ApJ, 539, L9
- Gebhardt et al. (2000) Gebhardt, K., Bender, R., Bower, G., et al. 2000, ApJ, 539, L13
- Genzel et al. (1998) Genzel, R., Lutz, D., Sturm, E., et al. 1998, ApJ, 498, 579
- Goulding et al. (2012) Goulding, A. D., Alexander, D. M., Bauer, F. E., et al. 2012, ApJ, 755, 5
- Graham (2004) Graham, A. W. 2004, ApJ, 613, L33
- Graham (2012) Graham, A. W. 2012, ApJ, 746, 113
- Graham & Scott (2013) Graham, A. W., & Scott, N. 2013, ApJ, 764, 151
- Häring & Rix (2004) Häring, N., & Rix, H.-W. 2004, ApJ, 604, L89
- Han et al. (2012) Han, Y., Dai, B., Wang, B., Zhang, F., & Han, Z. 2012, MNRAS, 423, 464
- Hao et al. (2007) Hao, L., Weedman, D. W., Spoon, H. W. W., et al. 2007, ApJ, 655, L77
- Heckman et al. (2004) Heckman, T. M., Kauffmann, G., Brinchmann, J., et al. 2004, ApJ, 613, 109
- Hernán-Caballero et al. (2009) Hernán-Caballero, A., Pérez-Fournon, I., Hatziminaoglou, E., et al. 2009, MNRAS, 395, 1695
- Hopkins (2004) Hopkins, A. M. 2004, ApJ, 615, 209
- Hopkins et al. (2005) Hopkins, P. F., Hernquist, L., Cox, T. J., et al. 2005, ApJ, 630, 705
- Hopkins et al. (2006) Hopkins, P. F., Hernquist, L., Cox, T. J., et al. 2006, ApJS, 163, 1
- Hopkins et al. (2008) Hopkins, P. F., Hernquist, L., Cox, T. J., & Kereš, D. 2008, ApJS, 175, 356
- Hopkins & Hernquist (2009) Hopkins, P. F., & Hernquist, L. 2009, ApJ, 694, 599
- Houck et al. (2004) Houck, J. R., Roellig, T. L., van Cleve, J., et al. 2004, ApJS, 154, 18
- Kormendy & Richstone (1995) Kormendy, J., & Richstone, D. 1995, ARA&A, 33, 581
- LaMassa et al. (2012) LaMassa, S. M., Heckman, T. M., Ptak, A., et al. 2012, ApJ, 758, 1
- Laurent et al. (2000) Laurent, O., Mirabel, I. F., Charmandaris, V., et al. 2000, A&A, 359, 887
- Lutz et al. (1998) Lutz, D., Spoon, H. W. W., Rigopoulou, D., Moorwood, A. F. M., & Genzel, R. 1998, ApJ, 505, L103
- Magnelli et al. (2011) Magnelli, B., Elbaz, D., Chary, R. R., et al. 2011, A&A, 528, A35
- Magorrian et al. (1998) Magorrian, J., Tremaine, S., Richstone, D., et al. 1998, AJ, 115, 2285
- Marconi & Hunt (2003) Marconi, A., & Hunt, L. K. 2003, ApJ, 589, L21
- Mullaney et al. (2011) Mullaney, J. R., Alexander, D. M., Goulding, A. D., & Hickox, R. C. 2011, MNRAS, 414, 1082
- Murphy et al. (2011) Murphy, E. J., Chary, R.-R., Dickinson, M., et al. 2011, ApJ, 732, 126
- Netzer et al. (2007) Netzer, H., Lutz, D., Schweitzer, M., et al. 2007, ApJ, 666, 806
- O’Dowd et al. (2009) O’Dowd, M. J., Schiminovich, D., Johnson, B. D., et al. 2009, ApJ, 705, 885
- Peeters et al. (2004) Peeters, E., Spoon, H. W. W., & Tielens, A. G. G. M. 2004, ApJ, 613, 986
- Rigopoulou et al. (1999) Rigopoulou, D., Spoon, H. W. W., Genzel, R., et al. 1999, AJ, 118, 2625
- Sanders et al. (1988) Sanders, D. B., Soifer, B. T., Elias, J. H., et al. 1988, ApJ, 325, 74
- Schawinski et al. (2010) Schawinski, K., Urry, C. M., Virani, S., et al. 2010, ApJ, 711, 284
- Schweitzer et al. (2006) Schweitzer, M., Lutz, D., Sturm, E., et al. 2006, ApJ, 649, 79
- Scoville et al. (2007) Scoville, N., Aussel, H., Brusa, M., et al. 2007, ApJS, 172, 1
- Shi et al. (2007) Shi, Y., Ogle, P., Rieke, G. H., et al. 2007, ApJ, 669, 841
- Silverman et al. (2008) Silverman, J. D., Green, P. J., Barkhouse, W. A., et al. 2008, ApJ, 679, 118
- Smith et al. (2007) Smith, J. D. T., Draine, B. T., Dale, D. A., et al. 2007, ApJ, 656, 770
- Spoon et al. (2007) Spoon, H. W. W., Marshall, J. A., Houck, J. R., et al. 2007, ApJ, 654, L49
- Stern et al. (2012) Stern, D., Assef, R. J., Benford, D. J., et al. 2012, ApJ, 753, 30
- Treister et al. (2012) Treister, E., Schawinski, K., Urry, C. M., & Simmons, B. D. 2012, ApJ, 758, L39
- Tremaine et al. (2002) Tremaine, S., Gebhardt, K., Bender, R., et al. 2002, ApJ, 574, 740
- Treyer et al. (2010) Treyer, M., Schiminovich, D., Johnson, B. D., et al. 2010, ApJ, 719, 1191
- Urry & Padovani (1995) Urry, C. M., & Padovani, P. 1995, PASP, 107, 803
- Voit (1992) Voit, G. M. 1992, MNRAS, 258, 841
- Weedman et al. (2005) Weedman, D. W., Hao, L., Higdon, S. J. U., et al. 2005, ApJ, 633, 706
- Wright et al. (2010) Wright, E. L., Eisenhardt, P. R. M., Mainzer, A. K., et al. 2010, AJ, 140, 1868
- Zabludoff et al. (1996) Zabludoff, A. I., Zaritsky, D., Lin, H., et al. 1996, ApJ, 466, 104


| Ramp Duration (in sec) Cycles | ||||||
|---|---|---|---|---|---|---|
| ID | Object Name | aaRedshift from SDSS DR7 | SL2 | SL1 | LL2 | LL1 |
| (1) | (2) | (3) | (4) | (5) | (6) | (7) |
| 1 | SDSS J020258.94002807.5 | 0.339 | 604 | 602 | 1206 | 1206 |
| 2 | SDSS J021447.00003250.6 | 0.349 | 605 | 602 | 1208 | 1208 |
| 3 | SDSS J023700.30010130.5 | 0.344 | 604 | 602 | 1205 | 1205 |
| 4 | SDSS J074621.06+335040.8 | 0.284 | 602 | 144 | 1202 | 1203 |
| 5 | SDSS J075045.00+212546.3 | 0.408 | 602 | 143 | 1202 | 1202 |
| 6 | SDSS J075521.30+295039.2 | 0.334 | 605 | 602 | 1207 | 1208 |
| 7 | SDSS J075549.56+321704.1 | 0.420 | 606 | 602 | 1209 | 1209 |
| 8 | SDSS J081018.67+250921.2 | 0.263 | 142 | 62 | 143 | 143 |
| 9 | SDSS J105816.81+102414.5 | 0.275 | 603 | 146 | 1205 | 1205 |
| 10 | SDSS J115355.58+582442.3 | 0.319 | 605 | 602 | 1204 | 1205 |
| 11 | SDSS J124833.52+563507.4 | 0.266 | 142 | 62 | 142 | 142 |
| 12 | SDSS J145640.99+524727.2 | 0.277 | 602 | 142 | 145 | 146 |
| 13 | SDSS J154534.55+573625.1 | 0.268 | 602 | 142 | 146 | 304 |
| 14 | SDSS J170046.95+622056.4 | 0.276 | 603 | 143 | 305 | 307 |
| 15 | SDSS J212843.42+002435.6 | 0.346 | 604 | 602 | 1206 | 1206 |
| 16 | SDSS J231055.50090107.6 | 0.364 | 604 | 602 | 1205 | 1205 |
| PAH 6.2 µm | PAH 11.3 µm | Morphology | ||||||||
|---|---|---|---|---|---|---|---|---|---|---|
| ID | FluxaaObserved-frame flux in the units of W cm-2 . The 3 upper limits are provided for nondetections. | EWbbRest-frame equivalent width in the units of µm. | FluxaaObserved-frame flux in the units of W cm-2 . The 3 upper limits are provided for nondetections. | EWbbRest-frame equivalent width in the units of µm. | Silicate 9.7 µmccSilicate strength at 9.7 µm defined by Hao et al. (2007). | f5.5ddIntegrated continuum flux from rest-frame 5.3-5.8 µm in the units of W cm-2 . | f15eeIntegrated continuum flux from rest-frame 14-16 µm in the units of W cm-2 . | ffWISE mid-infrared colors (i.e., ) in the units of magnitude. | Classification | |
| (1) | (2) | (3) | (4) | (5) | (6) | (7) | (8) | (9) | (10) | |
| 1 | 0.137 | 0.057 | 0.207 | 0.105 | 0.022 | 1.600 | 3.070 | 1.059 | Indeterminate | |
| 2 | 0.228 | 0.221 | 0.187 | 0.218 | 0.102 | 0.514 | 1.310 | 0.799 | Elliptical | |
| 3 | 0.153 | 0.259 | 0.185 | 0.473 | 0.076 | 0.311 | 0.482 | 0.586 | Spiral | |
| 4 | 0.103 | 0.038 | 0.108 | 0.171 | 0.015 | 0.466 | 0.753 | 0.877 | Elliptical | |
| 5 | 0.139 | 0.035 | 0.150 | 0.204 | 0.126 | 0.879 | 0.994 | 0.867 | Elliptical | |
| 6 | 0.194 | 0.425 | 0.158 | 0.504 | 0.047 | 0.210 | 0.372 | 0.599 | Spiral | |
| 7 | 0.062 | 0.126 | 0.070 | 0.216 | 0.055 | 0.278 | 0.517 | 0.776 | Spiral | |
| 8 | 0.376 | 0.089 | 0.170 | 0.089 | 0.117 | 0.992 | 1.480 | 0.926 | Elliptical | |
| 9 | 0.118 | 0.034 | 0.066 | 0.187 | 0.203 | 0.237 | 0.302 | 0.756 | Elliptical | |
| 10 | 0.065 | 0.034 | 0.037 | 0.031 | 0.160 | 0.295 | 0.231 | 0.830 | Elliptical | |
| 11 | 0.405 | 0.039 | 0.199 | 0.126 | 0.174 | 0.803 | 1.720 | 0.786 | Elliptical | |
| 12 | 0.158 | 0.124 | 0.124 | 0.271 | 0.008 | 0.241 | 0.402 | 0.656 | Spiral | |
| 13 | 0.079 | 0.054 | 0.108 | 0.162 | 0.104 | 0.710 | 1.290 | 0.832 | Spiral | |
| 14 | 0.094 | 0.103 | 0.109 | 0.446 | 0.207 | 0.173 | 0.335 | 0.623 | Spiral | |
| 15 | 0.062 | 0.026 | 0.033 | 0.123 | 0.040 | 0.438 | 0.354 | 0.849 | Elliptical | |
| 16 | 0.136 | 0.253 | 0.162 | 0.397 | 0.123 | 0.287 | 0.579 | 0.606 | Spiral | |