Position angle changes of inner-jets in a sample of blazars
Abstract
We have carried out the Gaussian model-fitting to the 15 GHz VLBA cores for a sample of blazars from the MOJAVE database, analyzed the correlations in the model-fitted parameters and studied the variability properties for different group of sources. We find that the Fermi LAT-detected blazars have on average higher position angle changes of cores than the LAT non-detected blazars, and that the LAT-detected ones largely associate with more variable cores in flux density.
keywords:
Active galactic nuclei: blazars – radio continuum: variability – -ray: Fermi-LAT1 Model-fit and statistical analysis
We define a sample of 104 blazars that have been monitored for more than 10 years with the VLBA at 15 GHz till end of 2011 and have at least 15 epoch data sets with good time coverage, from the MOJAVE database (Lister et al. 2009). The 104 blazars all show prominent core-jet features in the 15 GHz VLBA images. We have model-fitted to the ‘core’ component of the natural-weighted 15 GHz VLBA images for each blazar, with a two-dimensional elliptical Gaussian model in the AIPS task ‘JMFIT’, to obtain the position angle (PA) of the major axis of the elliptic Gaussian component, the integrated flux-density (IF) of the Gaussian component, and the de-convoluted major and minor axis scales of the Gaussian component. We consider that the core component of 15 GHz VLBA image is an ‘inner-jet’ rather than a true core, and the inner-jet could be modelled with an elliptical Gaussian component with its major axis along the inner-jet orientation or the inner-jet ridge-line on average, thus reflecting the inner-jet position angle. As demonstrated by Liu et al. (2012), the model-fitted position angles of cores are not correlated at all with the position angles of the VLBA restoring beams.
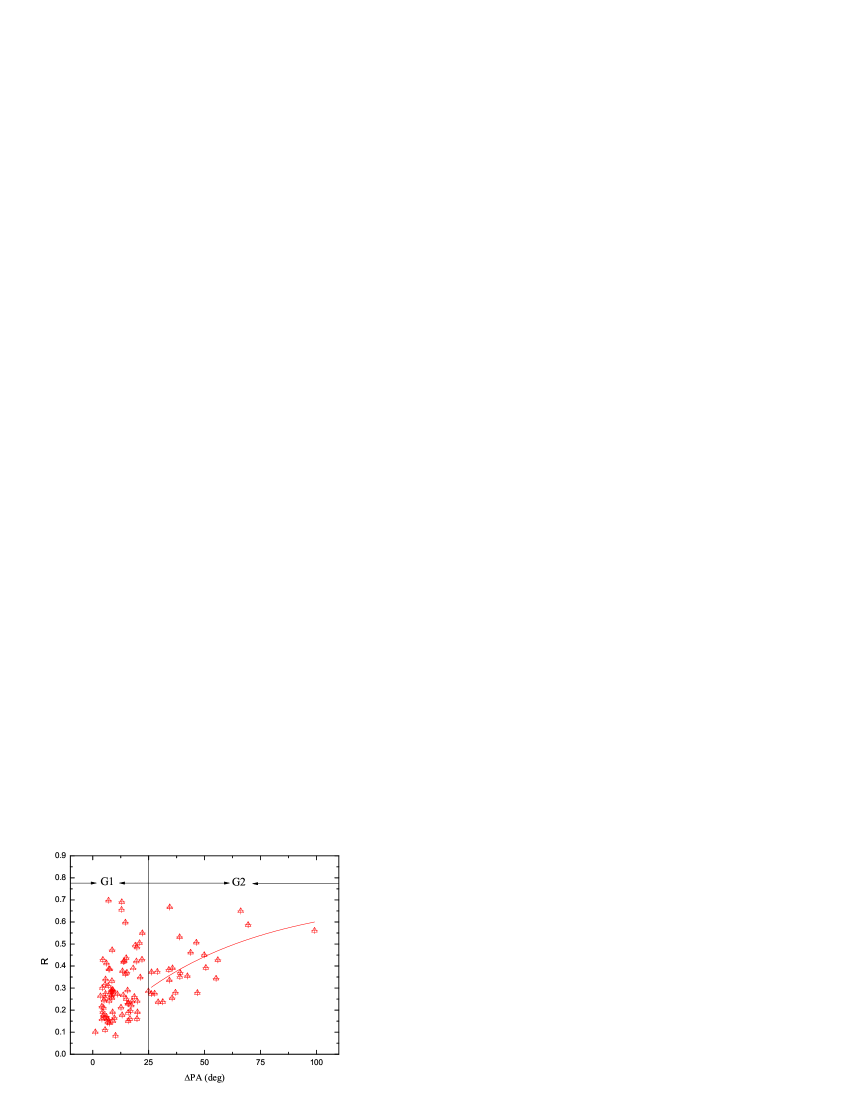
We define PA as the difference between the median and minimum of the PA, and use it as a measure of the position angle changes of inner-jet. It is expected that the Gaussian model-fitted PA of inner jet could be arbitrary when the minor/major ratio of the Gaussian component is close to unity, but this error in PA cannot be properly estimated by the model-fit task itself (see Condon 1997). To test this, we define an average of the minor/major ratio for each blazar core, R, and find a positive correlation between PA and R for PA, which supports that the error in the model-fitted PA is proportional to the minor/major ratio of core. In the regime of smaller PA and/or smaller R, this effect is not significant, e.g. there seems to be no significant correlation between PA and R for PA. For simplicity, we divide the 104 sources into group 1 for PA and group 2 for PA (G1 and G2, respectively, as shown in Fig. 1), and we only consider the group 1 in the following, since the group 2 could have relatively larger errors in inner-jet position angles. The G1 contains 57 Quasars and 21 BL Lac objects, of which 58 blazars are Fermi LAT-detected and 20 blazars are the LAT non-detected. To analyze possible correlation between the IF and the PA for the G1, we define a significant linear correlation as an absolute value of linear correlation coefficient0.40 at confidence of 95%. About 25% (20 out of 78) blazars show significant linear correlations between IF and PA. The details are shown in Table 1. The columns are (1) source type; (2) source count; (3),(4) number (fraction) of sources having positive, negative correlation between IF and PA, and a ‘+’ or ‘-’ sign indicates a positive or negative correlation respectively. Non-ballistic counter-clockwise (or clockwise) helical jet models mainly basing on the geometric beaming effect could respectively explain the positive correlation (or the negative correlation) between the IF and the PA of inner-jets of the blazars (Liu et al. 2012).
| 1 | 2 | 3 | 4 |
|---|---|---|---|
| Class | N | Positive corr. | Negative corr. |
| Blazars | 78 | +12(15%) | -8(10%) |
| Quasars | 57 | +8(14%) | -8(14%) |
| BL Lacs | 21 | +4(19%) | -0(0%) |
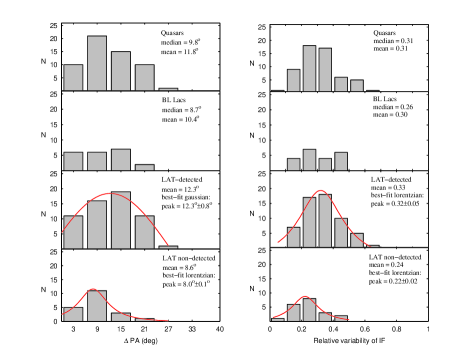
We also study the long-term variability of the parameters: PA and IF. The distributions of the PA for quasars, BL Lacs, the LAT-detected and the LAT non-detected are shown in Fig. 2 (left). Gaussian or Lorentzian function fittings are used for the histogram distribution in order to obtain the peak value. The Kolmogorov-Smirnov (K-S) tests for 57 quasars and 21 BL Lacs suggest that the two distributions are not significantly different; there appears to be a peak at higher PA in the BL Lacs than in the quasars, but not significantly. The K-S tests for 58 LAT-detected and 20 LAT non-detected indicate a low probability (p 0.012) for these two samples being drawn from same parent population. It displays that the source distribution peaks at PA of in the LAT-detected is higher than the peak of PA () in the LAT non-detected, suggesting that the -ray blazars mostly have a larger PA of inner-jet than the non--ray blazars.
|
|
Source counts versus the ‘relative variability of IF’ (defined as
long-term rms-variation divided by the mean of IF) are displayed in
Fig. 2 (right). The K-S tests for 57 quasars and 21 BL
Lacs suggest that the two distributions are not significantly
different. The K-S tests for 58 LAT-detected and 20 LAT
non-detected indicate a low probability (p 0.005) for these
two samples being drawn from same parent population. It displays
that the source distribution peaks at the relative variability of
in the LAT-detected is higher than the peak of
in the relative variability of the LAT non-detected,
suggesting that the -ray blazars mostly have a larger
relative variability of inner-jet than the non--ray blazars.
Acknowledgements
We thank the anonymous reviewer for helpful comments and suggestions on the manuscript. This research has made use of data from the MOJAVE database that is maintained by the MOJAVE team (Lister et al., 2009, AJ, 137, 3718). The work is supported by the National Natural Science Foundation of China (Grant No.11273050) and the 973 Program of China (2009CB824800).
References
- [1] Condon, J. J. 1997, Publications of Astronomical Society of the Pacific., 109, 166
- [2] Lister, M. L., Aller, H. D., Aller, M. F., et al. 2009, Astron. J., 137, 3718
- [3] Liu, X., Mi, L.-G., Liu, B.-R., Li, Q.-W. 2012, Astrophys. Space Sci., 342, 465