Timing and spectral study of the Be XRB IGR J11305–6256: Swift discovers the orbital period and a soft X-ray excess.
Abstract
IGR J11305-6256 is one of the numerous sources discovered through the INTEGRAL scan of the Galactic Plane. Thanks to the Swift-BAT survey, that allows the frequent sampling of any sky region, we have discovered in the hard X-ray emission of this source a modulation with a period of d. The significance of this periodic modulation is 4 standard deviations in Gaussian statistics. We interpret it as the orbital period of the binary system. We derive an orbital separation between IGR J11305-6256 and its companion star of corresponding to times the radius of the companion star. The broadband XRT-BAT (0.3150 keV) spectrum is described either by the sum of a black-body and a cut-off power-law or by a partially absorbed cut-off power-law. The temporal and spectral characteristics of the source indicate its possible association with the class of persistent, but faint, Be X-ray binary systems.
keywords:
X-rays: binaries – X-rays: individual: IGR J11305-6256. Facility: Swift1 Introduction
During the last decade, the IBIS/ISGRI telescope (Ubertini et al., 2003) on board the INTEGRAL gamma-ray satellite (Winkler et al., 2003) has discovered several new Galactic sources, thanks to the hard X-ray window of the telescope (2080 keV) that allows to unveil the presence of highly absorbed objects that appear too faint in the soft X-ray energies, and thanks to the wide field of view () and to the scan monitoring program of the Galactic plan that favored the capture of transient episodes from previously unknown objects. Moreover, since November 2004 the Swift satellite (Gehrels et al., 2004), with its Burst Alert Telescope (BAT, Barthelmy et al., 2005) has been performing a continuous monitoring of the hard X-ray sky with different observational features with respect to ISGRI: the observation of large sky areas thanks to a field of view of 1.4 steradian (half coded) and several switches of the satellite pointing direction within a day. These characteristics allow to observe up to of the entire sky every day, with a duty cycle of 10 to 20% for each direction. This resulted of paramount importance to monitor the variability of the sources and to achieve good statistics for broad band spectral analysis. In particular for the high mass X-ray binaries (HXMBs) class, it has led to a sensible increase of orbital period detections (e.g. , 2009, 2010a, 2010b, 2010c, 2010d; Corbet et al., 2010e; , 2010; Cusumano et al., 2010; La Parola et al., 2010; D’Aì et al., 2011a), and to discover absorption features in their hard X-ray spectra (D’Aì et al., 2011b).
In this Letter we analyze the soft and hard X-ray data collected by Swift on IGR J11305-6256.
IGR J11305-6256 is a transient source discovered by the IBIS/ISGRI telescope in the Carina region, with a flux of 8 mCrab in the 20–60 keV band (Produit et al., 2004). A Swift-XRT observation allowed the accurate localization of IGR J11305-6256 (RAJ2000 = 11h 31m 06.5s, Dec, error radius: 6″) and confirmed the association with the blue giant star HD 100199 (of spectral type B0 IIIe, Garrison et al., 1977), located at a distance of 3 kpc (Masetti et al., 2006). The X-ray source position was further refined through a Chandra observation (RAJ2000 = 11h 31m 06.95s, Dec, with position uncertainty , Tomsick et al., 2008). The Chandra data showed a weakly absorbed () flat power law () spectrum, with a 0.3-10 keV unabsorbed flux of erg cm-2 s-1, corresponding to a luminosity of erg s-1, at a distance of 3 kpc. This Letter is organised as follows. Section 2 describes the Swift data reduction. Section 3 reports on the timing analysis. Section 4 describes the broad band spectral analysis. In Section 5 we briefly discuss our results.
2 Data reduction
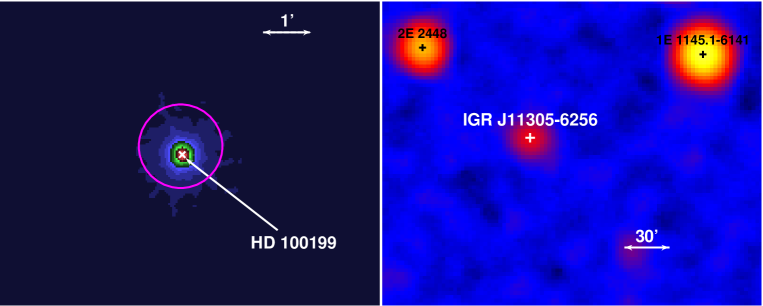


Swift-XRT (Burrows et al., 2005) observed IGR J11305-6256 five times between November and December 2005. The source was always observed in photon counting mode (Hill et al., 2004). Table 1 reports the log of these observations with the most relevant details. XRT data were calibrated, filtered and screened using the standard procedures included in the XRTDAS package HEAsoft 6.0.4. For each observation we extracted source events and spectra from a circular region of 20 pixel radius (1 pixel = 2.36”) centered on the source position as determined with xrtcentroid, adopting standard grade filtering 012. Fig.1 (left) shows the 0.210 keV XRT image. The event arrival times were converted to the solar system barycentre (SSB) time with the task barycorr. The background spectra were built using the same grade selection and selecting events in an annular region centered on the source with radii of 40 and 70 pixels to avoid contamination from the source point spread function wings. The source spectra of each observation were summed to obtain a single spectrum, and the same was done for the background spectra. The ancillary files were combined using addarf weighting them by the exposure times of the relevant spectra. Finally, spectra were re-binned with a minimum of 20 counts per energy channel to allow the use of the statistics. The spectra were analyzed using the spectral redistribution matrices and the ancillary response file v.011 (suitable for data collected with CCD substrate voltage ).
| Obs | Obs ID | rate | ||||
|---|---|---|---|---|---|---|
| (MJD) | (s) | (s) | c/s | |||
| 1 | 35098001 | 53627.01 | 81703 | 6007 | 0.46 | 0.33 |
| 2 | 35224002 | 53636.33 | 12118 | 1048 | 0.54 | 0.38 |
| 3 | 35224003 | 53690.03 | 82708 | 15899 | 0.98 | 0.43 |
| 4 | 35098002 | 53725.67 | 23856 | 3658 | 0.28 | 0.14 |
| 5 | 35098003 | 53728.00 | 19014 | 5127 | 0.30 | 0.13 |
The raw BAT survey data of the first 88 months of the Swift mission were retrieved from the HEASARC public archive111http://heasarc.gsfc.nasa.gov/docs/archive.html and processed with the batimager software (Segreto et al., 2010), that performs screening and mosaicking of the survey data and produces background subtracted spectra and light curves for each detected source. Fig.1 (right) shows the 15150 keV significance sky map (exposure time of 17.7 Ms) centered on IGR J11305-6256, where the source is detected with a maximum significance of 26.7 standard deviations. The light curve for timing analysis was extracted in the same energy range. The time tag of each bin was corrected to the solar system barycentre (SSB) by using the task earth2sun. The official BAT spectral redistribution matrix222http://heasarc.gsfc.nasa.gov/docs/heasarc/caldb/data/swift/bat/index.html was used for spectral analysis. Quoted errors are given at 90% confidence level for a single parameter, unless otherwise stated.
3 Timing analysis
In order to search for long periodicities in the emission of IGR J11305-6256, we exploited the 15150 keV BAT light curve using the folding technique (Buccheri & Sacco, 1985): we searched in the 0.5500 days period range, with a period resolution of PT, where P is the trial period, is the number of phase bins used to build the profile and T Ms is the data time span. The average count rate in each profile bin has been evaluated weighting the rates by the inverse square of their statistical error, which is appropriate when dealing with a large spread in the error values. This happens in the BAT data because the source is typically observed at several off-axis angles, thus introducing a large spread in the source signal-to-noise ratio (SNR), uncorrelated with the source count rate.
Fig. 2 (a) shows the periodogram where a strong feature at P d (the error is the period resolution at P0) emerges with . Other relevant peaks are visible for periods corresponding to multiples of P0. The pulsed profile evaluated at P0 with T MJD is shown in Figure 2 (b). The periodogram is characterised by an increasing strong red noise for higher period values, caused by the long term variability of the source. For this reason the significance of the periodicity at P0 cannot be evaluated relying on the statistics, and an alternative method shall be used. We proceeded according to the following steps.
-
•
We modeled the ascending trend of the distribution fitting it with a 2nd order polynomial and we created a new distribution (z) subtracting the best fit from the distribution. The z value at is .
-
•
We built the histogram of the z distribution (Figure 2, c) extracting the z values only from the period range 60–200 days and excluding the interval around .
-
•
We fitted the histogram values for with an exponential function. The resulting best fit model is shown in Fig. 2 (c).
-
•
We evaluated the area under the histogram: we summed the area of each single bin from its left boundary up to ; beyond we integrated the best fit exponential model up to infinity.
-
•
We evaluated the integral of the best-fit exponential function beyond 173.4 and normalised it to the total area of the histogram.
The result () is the probability of chance occurrence of a z value equal to or larger than 405 (or a equal to or larger than 261.8) and it corresponds to a significance for the detected feature of standard deviations in Gaussian statistics.
Fig. 3 shows the BAT 15150 keV light curve sampled at time intervals equal to P0. The source shows a strong long term variability. Significant X-ray emission was observed up to mid 2007 ( MJD 54400), then the source weakened to an intensity level averaged over P0 roughly consistent with the background.
IGR J11305-6256 has been always detected in the XRT pointed observations. Table 1 reports the source count rate and the orbital phase of each observation evaluated with respect to P0 and Tepoch. The source intensity varies between 0.1 and 0.4 counts/s and these variations result uncorrelated to the P0 modulation shown in Fig. 2 (b). The timing analysis on the XRT data has to cope with two main issues: the read-out time of the XRT-PC data (=2.5073 s) and the fragmentation of the observation into several snapshots with different duration and time separation. These effects introduce systematic features in the results of the timing analysis that can mask the significance of any real source modulation. Therefore we performed a folding analysis for each XRT observation on the events arrival times randomized within the XRT-PC time resolution bin. Moreover, we produced the periodogram relevant to each snapshot with exposure time higher than 500 s searching in the period range s: the periodograms obtained from snapshots belonging to the same observation were finally summed. We did not find any significant feature in the resulting five periodograms. We repeated this analysis selecting snapshot lasting more than 1000 s and searching for modulations up to 250 s. Again, no significant features emerged above the white noise.

4 Spectral analysis
In order to have the best available SNR spectrum, we merged all the XRT spectra from the observations listed in Table 1 and we accumulated a hard X-ray BAT spectrum over the 88-month of monitoring. We preliminarily checked that the variability of the spectral parameters was lower than the constraints derived by a fit error determination on the single observations of Table1. To this aim, the background subtracted spectra of the XRT observations were fitted simultaneously with a model consisting of an absorbed power-law. Forcing the spectral parameters to common values for the five datasets and allowing only a multiplicative constant to weight for different fluxes, we obtained similar residuals.
Several BAT spectra were produced selecting the data in different time intervals (MJD intervals 5347053832, 5383254436, and 5443656006; see Fig. 3) and on three different orbit phase intervals (0.190.56, 0.560.87, and 0.871.19, see Fig. 2-b). These spectra were fitted with a power-law model and, as above, forcing a common photon index for all the spectra. The best fit residuals show the same trend for all the datasets, with best fit photon index .
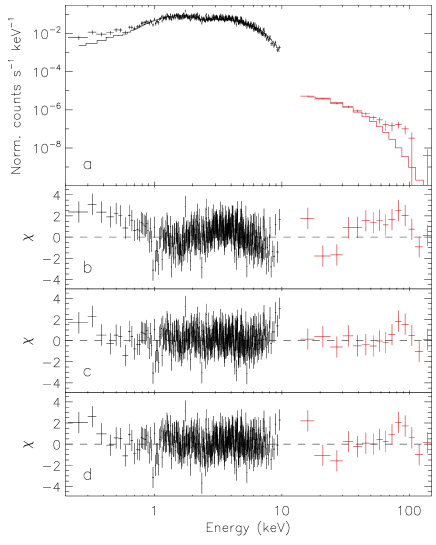
The broad band average spectrum of IGR J11305-6256 (XRT: 0.310 keV; BAT: 15150 keV) is plotted in Fig. 4 (a). We introduced a multiplicative factor in the model to account for the non-simultaneity of the BAT and XRT spectra and for any inter-calibration uncertainty. The factor is kept fixed to 1 for the XRT data and left free to vary for the BAT data. First we tried an absorbed power-law with a high-energy cut-off (model 1). The reduced is 504.4 (with 389 dof) with residuals below 1 keV strongly suggesting the presence of other continuum components. Therefore, we added to the power-law emission a black-body component at a temperature of 1.6 keV (model 2), obtaining a significant improvement of the fit residuals (reduced = 371.5 for 387 dof). In order to evaluate the statistical significance of this improvement we built 100000 simulated XRT spectra using the best fit parameters of model 1 and the rate uncertainties of the observed XRT data. The simulated spectra were fitted together with the BAT spectrum both with model 1 and model 2 obtaining a value of as the highest difference in the values for the two models. This results corresponds to a chance probability to obtain the decrement in as measured in the observed XRT+BAT source data lower than , that corresponds to a significance larger than standard deviations in Gaussian statistics. In the 0.5100 keV energy range the fluxes of the black-body component and of the power-law emission are 3.410-11 and 4.010-11 erg cm-2 s-1, respectively (assumed with respect to the XRT data). Alternatively, we also explored a scenario where the continuum X-ray emission (modeled with only a cut-off power-law) is partially absorbed by local neutral matter (pcfabs in Xspec; model 3). This model gave a statistically similar result (reduced = 0.97 for 386 dof), compared to the blackbody + cutoff powerlaw. We present in Table 2, the best-fitting parameters for the spectral models that have been considered, while data and residuals in units of sigmas are shown in Fig.4.
| Parameter | cutoff | bb+cutoff | pcfabs*cutoff |
|---|---|---|---|
| (model 1) | (model 2) | (model 3) | |
| N 1 ( cm-2) | 0.32 0.05 | 0.13 0.08 | 0.260.06 |
| N 2 ( cm-2) | 2.60.6 | ||
| 0.430.08 | 1.00.3 | 1.200.17 | |
| (keV) | 12.01.7 | 23 | 235 |
| ( ph keV-1cm-2s-1 at 1 keV) | 1.50.1 | 0.40.2 | |
| kTBB (keV) | 1.600.06 | ||
| BBody radius (km) | 0.190.02 | ||
| 0.490.08 | 3.4 | ||
| / dof | 503 / 388 | 369 / 386 | 374 / 386 |
5 Discussion
We have presented in this work the spectral and timing results from the complete set of Swift observations of IGR J11305-6256. The source is an accreting Be XRB, whose X-ray activity has turned to quiescence in recent years. Analyzing the long-term BAT light curve, we found evidence at 4 for the orbital period of the system to be 120.8 days. The third Kepler’s law allows us to derive the semi-major axis of this binary system:
| (1) |
where is the mass of the neutron star, is the mass expected for the spectral type of the companion star and is its expected radius (Lang, 1992). Such a large orbital separation is indeed common in Be XRBs. Considering the whole class of Be XRB, the long orbital period would suggest also very long spin periods and high eccentricity (, 2011). However, the folded light curve shows a smooth modulation with the orbital phase, and suggests that accretion may not be clocked with a periastron passage, as typical for classical highly-eccentric Be XRBs.
The broadband data collected by pointed Swift observations and by the long-term BAT monitoring indicated that the spectrum cannot be described with an absorbed power-law with a high-energy cut-off as in the case of most low-luminosity accreting high-mass/Be X-ray binaries. The fit is sensibly improved when a thermal black-body component is added to the model, or when the X-ray emission is only partially absorbed. In the first scenario, we may be observing thermal emission from the accreting magnetic caps of the neutron star, the derived black-body radius being compatible with a small portion of the surface of the NS. The black-body temperature (1.6 keV) is also within the expected range for other similar Be XRB sources for which this component was clearly detected (La Palombara et al., 2013), but it is sensibly lower than the typical temperatures for soft excesses found in other HMXBs, where the emission may be related to the reprocessed emission at the magnetospheric boundary or by diffuse gas around the X-ray system (Hickox et al., 2004). However, all the Be XRBs that have shown presence of this component are also X-ray pulsars with a high modulated fraction. Lack of evidence in the Swift XRT data of any pulsation below 250 s may point to very long periods that can be detected only accumulating observations with very long exposures.
Another scenario, that is statistically equivalent, explains the deviations in the soft part of the spectrum as due to the presence of a neutral absorber that partially covers the X-ray emission. The covered fraction is very high () and the relative column density (2.61022 cm-2) is sensibly higher than the whole column density due to the ISM (0.261022 cm-2). This scenario requires that the X-ray source may be embedded (but not completely) in a dense stellar wind of the companion star, or that part of the outer atmosphere of the companion is stripped, rapidly cooled and dispersed along the NS orbit. In many HMXBs this scenario has been often invoked (see e.g. Naik et al., 2011), but rarely for Be XRBs, due to the fact that Be stars are less efficient in driving strong winds. Another important finding that would corroborate this scenario, would be the detection of a strong fluorescent iron line, that should be imprinted in the circum-stellar matter. To this aim, a high signal-to-noise at the 67 keV range observation would be needed.
Acknowledgments
This work has been supported by ASI grant I/011/07/0.
References
- Barthelmy et al. (2005) Barthelmy, S. D., et al. 2005, Space Science Reviews, 120, 143
- Buccheri & Sacco (1985) Buccheri, R., & Sacco, B. 1985, Data Analysis in Astronomy, 15
- Burrows et al. (2005) Burrows D. N., et al., 2005, SSRv, 120, 165
- (4) Corbet, R. H. D., & Krimm, H. A. 2009, The Astronomer’s Telegram, 2008, 1
- (5) Corbet, R. H. D., Krimm, H. A., & Skinner, G. K. 2010, The Astronomer’s Telegram, 2559, 1
- (6) Corbet, R. H. D., Krimm, H. A., Barthelmy, S. D., et al. 2010, The Astronomer’s Telegram, 2570, 1
- (7) Corbet, R. H. D., Barthelmy, S. D., Baumgartner, W. H., et al. 2010, The Astronomer’s Telegram, 2588, 1
- (8) Corbet, R. H. D., Barthelmy, S. D., Baumgartner, W. H., et al. 2010, The Astronomer’s Telegram, 2598, 1
- Corbet et al. (2010e) Corbet, R. H. D., Barthelmy, S. D., Baumgartner, W. H., et al. 2010, The Astronomer’s Telegram, 2599, 1
- (10) Corbet, R. H. D., & Krimm, H. A. 2010, The Astronomer’s Telegram, 3079, 1
- Cusumano et al. (2010) Cusumano, G., La Parola, V., Romano, P., et al. 2010, MNRAS, 406, L16
- D’Aì et al. (2011a) D’Aì, A., La Parola, V., Cusumano, G., et al. 2011, A&A, 529, A30
- D’Aì et al. (2011b) D’Aì, A., Cusumano, G., La Parola, V., et al. 2011, A&A, 532, A73
- Garrison et al. (1977) Garrison, R. F., Hiltner, W. A., & Schild, R. E. 1977, ApJS, 35, 111
- Gehrels et al. (2004) Gehrels, N., et al. 2004, ApJ, 611, 1005
- Hickox et al. (2004) Hickox, R. C., Narayan, R., & Kallman, T. R. 2004, ApJ, 614, 881
- Hill et al. (2004) Hill, J. E., Burrows, D. N., Nousek, J. A., et al. 2004, SPIE, 5165, 217
- Lang (1992) Lang, K. R. 1992, Astrophysical Data I. Planets and Stars, X, 937 pp. 33 figs.. Springer-Verlag Berlin Heidelberg New York,
- La Palombara et al. (2013) La Palombara, N., Mereghetti, S., Sidoli, L., Tiengo, A., & Esposito, P. 2013, arXiv:1301.5120
- La Parola et al. (2010) La Parola, V., Cusumano, G., Romano, P., et al. 2010, MNRAS, 405, L66
- Masetti et al. (2006) Masetti, N., Pretorius, M. L., Palazzi, E., et al. 2006, A&A, 449, 1139
- Naik et al. (2011) Naik, S., Paul, B., Kachhara, C., & Vadawale, S. V. 2011, MNRAS, 413, 241
- Produit et al. (2004) Produit, N., Ballet, J., & Mowlavi, N. 2004, The Astronomer’s Telegram, 278, 1
- (24) Reig, P. 2011, Ap&SS, 332, 1
- Segreto et al. (2010) Segreto, A., Cusumano, G., Ferrigno, C., La Parola, V., Mangano, V., Mineo, T., & Romano, P. 2010, A&A, 510, A47
- Tomsick et al. (2008) Tomsick, J. A., Chaty, S., Rodriguez, J., Walter, R., & Kaaret, P. 2008, ApJ, 685, 1143
- Ubertini et al. (2003) Ubertini, P., Lebrun, F., Di Cocco, G., et al. 2003, A&A, 411, L131
- Winkler et al. (2003) Winkler, C., Courvoisier, T. J.-L., Di Cocco, G., et al. 2003, A&A, 411, L1