CMS Collaboration
CMS Measurements of the
Higgs-like Boson
In the
Two Photon Decay Channel
Abstract
CMS reports on the recently updated, preliminary results with the full datasets of 2011 and 2012 in the analysis of the Higgs-like Boson at 125 GeV. Utilizing 5.1 of 7 TeV data and 19.6 of 8 TeV data, a signal strength of times the Standard Model (SM) expectations with a mass of GeV is observed. The significance of this resonance with respect to the background only prediction is . The cut-based cross-check analysis observes signal strength of times the SM expectations with a significance of at 124.5 GeV.
I Analysis Motivation
On the fourth of July, 2012, the discovery of a new particle was announced Discovery . A previously unobserved particle was discovered in two channels near 125 GeV, while searching for this Higgs boson, a particle central to the SMSM1 ; SM2 ; Higgs1 ; Higgs2 . One of the channels in which this particle is observed is in a two photon resonance. CMS has improved, expanded, and updated the analysis of the two photon channel, which is one of the two channels in which the discovery was made. This update contains CMS’s first preliminary results on the entire datasets from 2011 and 2012.
II Analysis Description
The decay signature sought in this analysis is a small, narrow resonance on top of a large, monotonically decreasing background. This analysis has two basic features: background estimates from fits to the data and, categorization of data and monte carlo signal.
Since the data is dominated by background, it is possible to fit 3rd to 5th order polynomials to the data for background estimates. A thorough bias study was performed to ensure that potential bias, calculated using numerous, varied underlying shape assumptions, would be less than 20% of the uncertainty from the polynomial fits.
The other general feature of the analysis is categorization of events. Events with different and resolution are best used when used with similar events. In order to optimally categorize a Boost Decision Tree (BDT) is used. The BDT takes several inputs and gives a single output, which is used to categorize events.
In addition, there are several final state signatures which are indicative of the production mechanism of the boson. These events feature extra high transverse momentum objects which can be tagged. An additional category, which has higher than normal , is created for each tagged class.
II.1 Vertex Selection and Vertex Probability
On average, events from the 2012 dataset contain 20 interactions. The challenge for this analysis is to determine the vertex accurately in order to improve the mass resolution of the reconstructed di-photon. Since there are no tracks associated to photons, except in the case of reconstructed conversions, obtaining the correct vertex is not straightforward, particularly for di-photons with low transverse momentum.
A BDT takes information from conversions, recoil between vertices’ tracks and the di-photon system, and the sum of vertices’ track transverse momentum to sort the reconstructed vertices. The one with the highest score is selected to be used in the mass calculation.
A second BDT is trained after selecting the vertex to determine the probability of having chosen the vertex correctly. This BDT uses information from the chosen vertex, as well as the second and third ranked vertices to determine a probability of accurate selection. This probability is measured from efficiency in simulation and is fully validated using Z boson events decaying to two muons where the muon tracks have been removed.
II.2 Photon Identification MVA (Multi-Variate Analysis)
Distinguishing real photons from fake reconstructed photons, which are mainly jets, is a very important aspect of this analysis. There are two main types of variables which are used for this purpose: shower topology and isolation. There are numerous shower topology variables, in which the profile of fake photons differs that of real photons. Isolation variables are powerful because real photons typically do not have very many particles in the immediate vicinity of the main energy deposit of the photon.
These variables, along with a variable correlated with number of simultaneously recorded interactions and the detector location of the photons, are given as input to a BDT. The output, referred to as Photon ID MVA, is validated and shape-corrected using Z boson decay to 2 electrons where the electrons are treated as photons. In figure the distributions of the Photon ID MVA for data and monte carlo for Z boson events are shown.
II.3 Di-Photon MVA
This BDT, referred to as Di-Photon MVA, takes several inputs: di-photon kinematics, per event resolution estimates for right and wrong vertex assumptions, the vertex probability, the Photon ID MVA scores of both selected photons, and the detector location of the photons. The Di-Photon MVA is used to categorize events into four optimized bins.
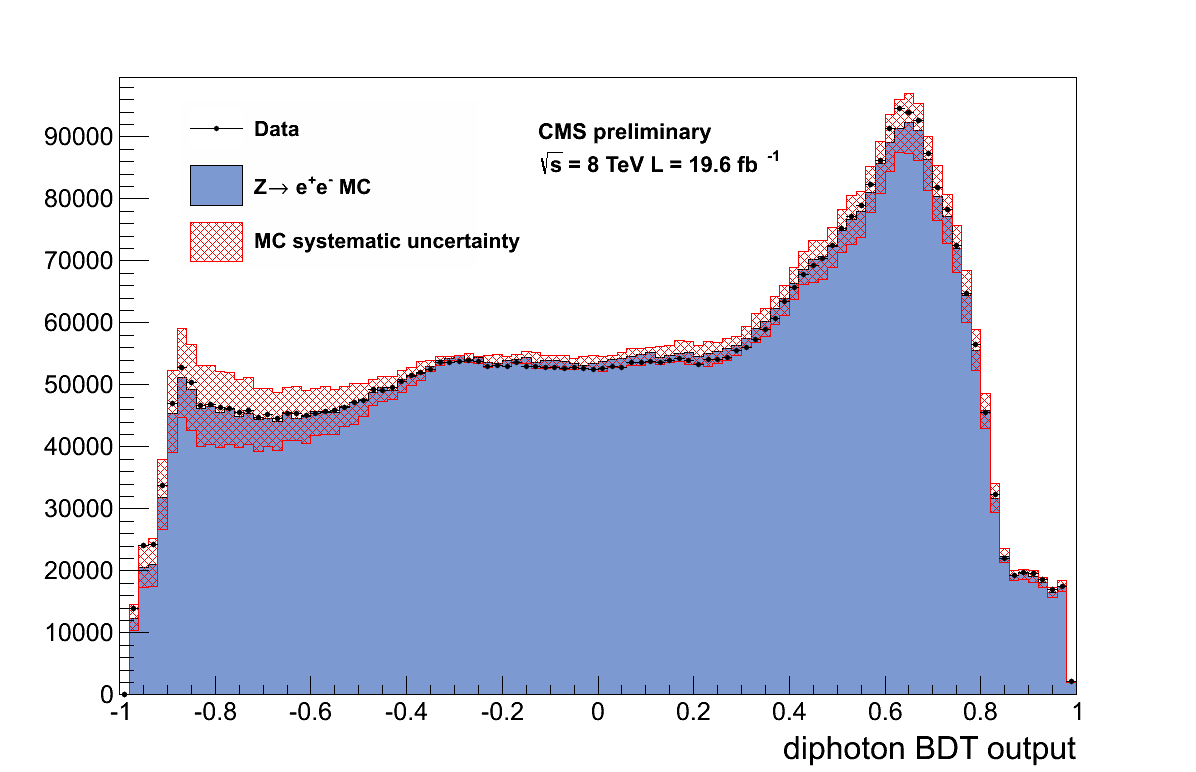
The Di-Photon MVA is validated using Z boson to two electron events where the electrons are treated like photons. In figure 1 the Di-Photon MVA is shown for the Drell-Yan samples in data and in simulation. Agreement within systematic error is shown.
II.4 Exclusive Channels
The dominant production mechanism of SM higgs is gluon fusion. However, The SM production of higgs via Vector Boson Fusion (VBF) and Higgsstrahlung (VH) is non-negligible. Higgs produced via these mechanisms contain high transverse momentum objects, which can be tagged. In this analysis several tagged categories have been made to utilize these additional objects.
The di-jet tags and the most powerful is of these tags, which are intended to tag the two forward jets from VBF production. A BDT is used to categorize the events with two jets and there are two categories. This BDT uses mostly jet kinematics, some di-jet plus di-photon kinematics and some photon kinematics. These two categories account for nearly 20% of the sensitivity of the analysis.
In addition to the di-jet tagged categories, there are three other categories, which intend to tag the leptonic decays of vector bosons, which produce higgs via associated production (Higgsstrahlung). The three tags of muons, electrons and MET greatly reduce the uncertainty of the measured coupling of the higgs to the vector bosons.
II.5 Cut-based Analysis
In addition to the full analysis outlined already, a simple, robust, cut-based analysis is performed in parallel. It utilizes the main features of the main analysis, which are categorization and polynomial background fits to the data, but it uses cut-based photon selection and categorization based on the detector location of the photons and their shower shapes.
There are analogous exclusive tags in the cut-based analysis. The di-jet tag categories use a cut-based approach with the same inputs as the di-jet MVA in the main analysis. The muon, electron, and MET tags are nearly identical except for the cut-based selection of the photons.
II.6 2011 Data Analysis
The 2011 dataset is analyzed separately and is identical to that in the discovery paper Discovery . For the untagged categories, the same strategy is used with a BDT trained on 7 TeV monte carlo. The only exclusive channel is a single, cut-based, di-jet tag. The cut-based analysis also uses an analogous strategy and uses the same cut-based, di-jet tag as the MVA analysis.
III Results - 2011 and 2012 Data
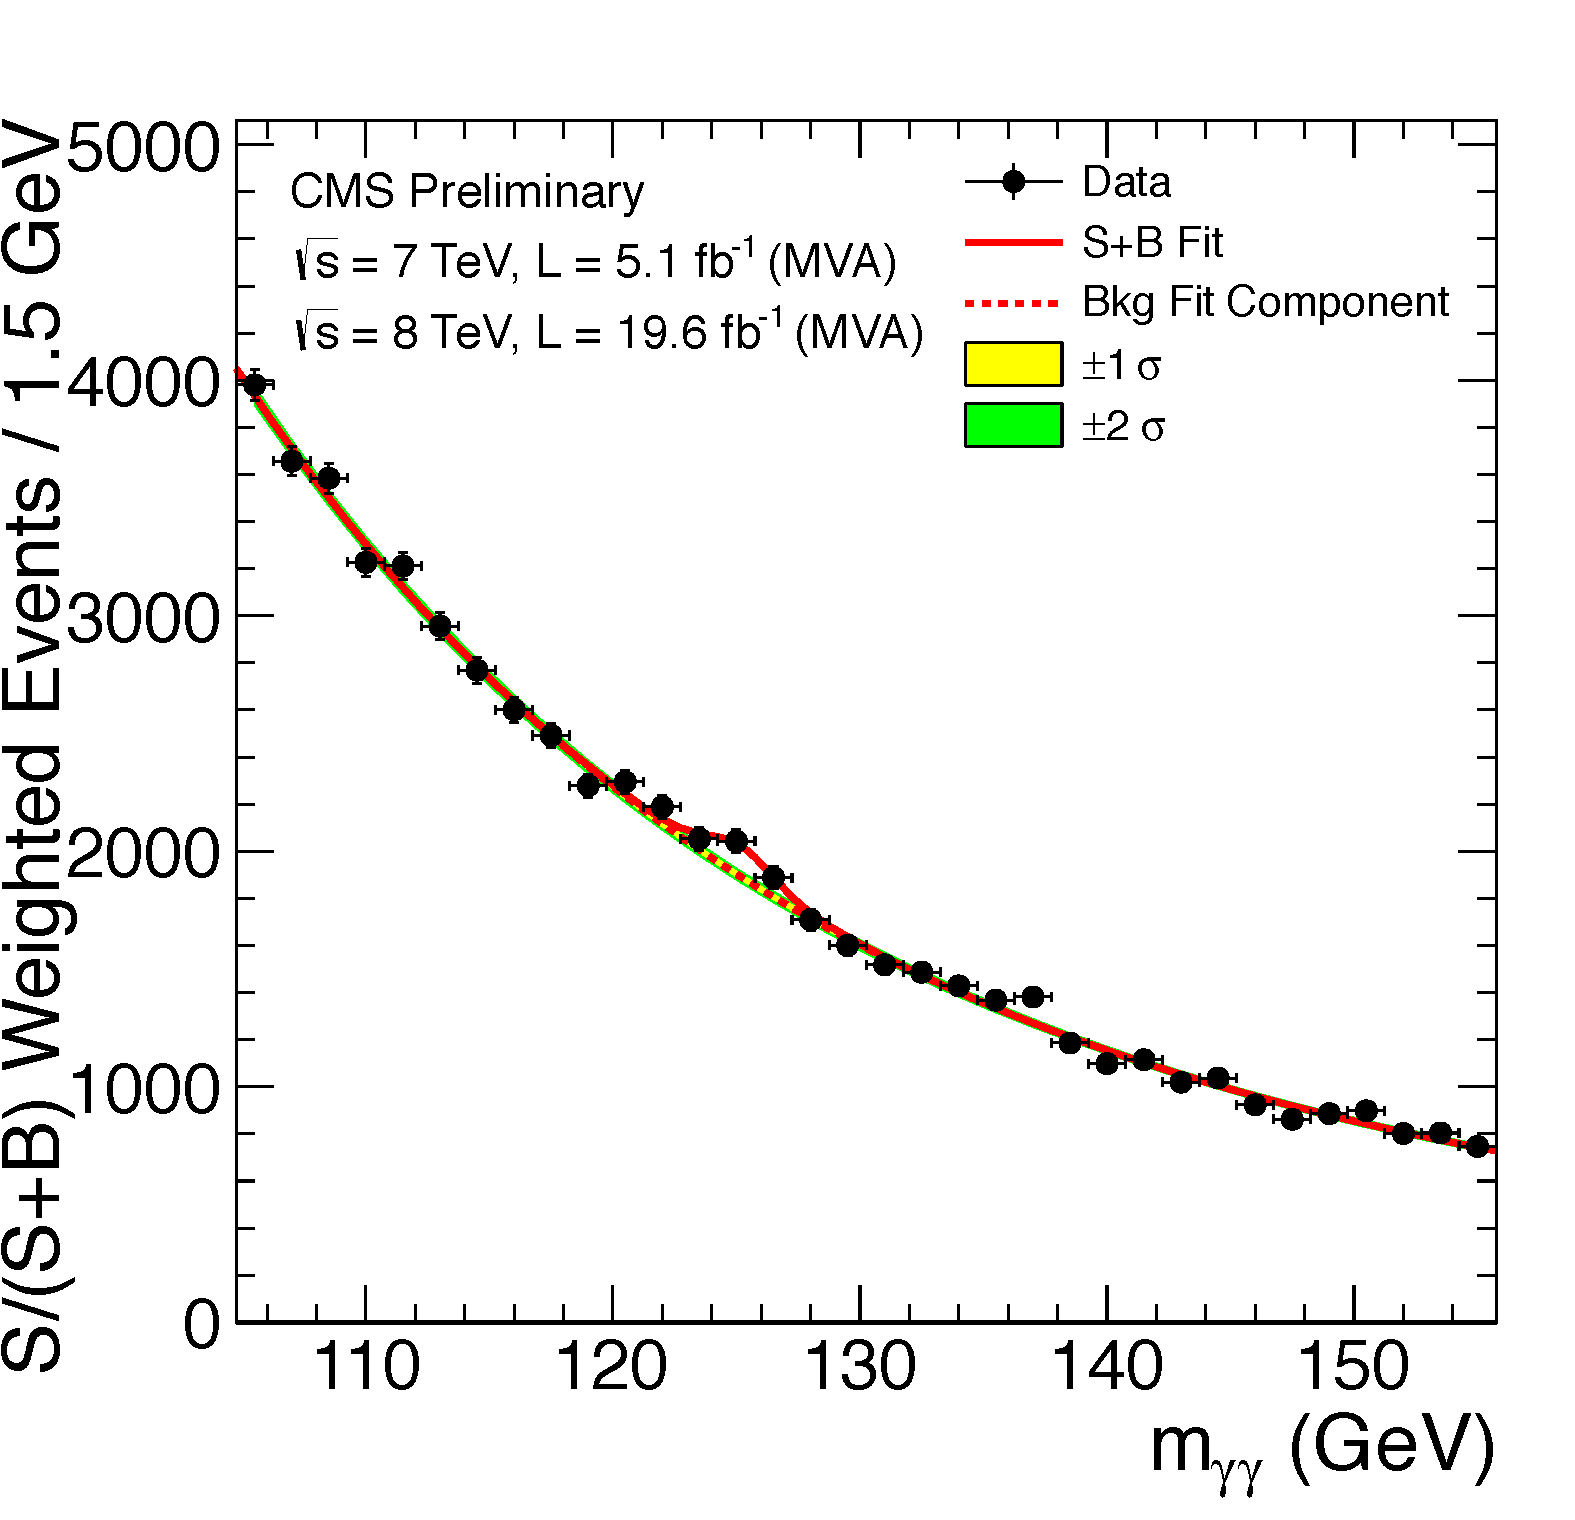
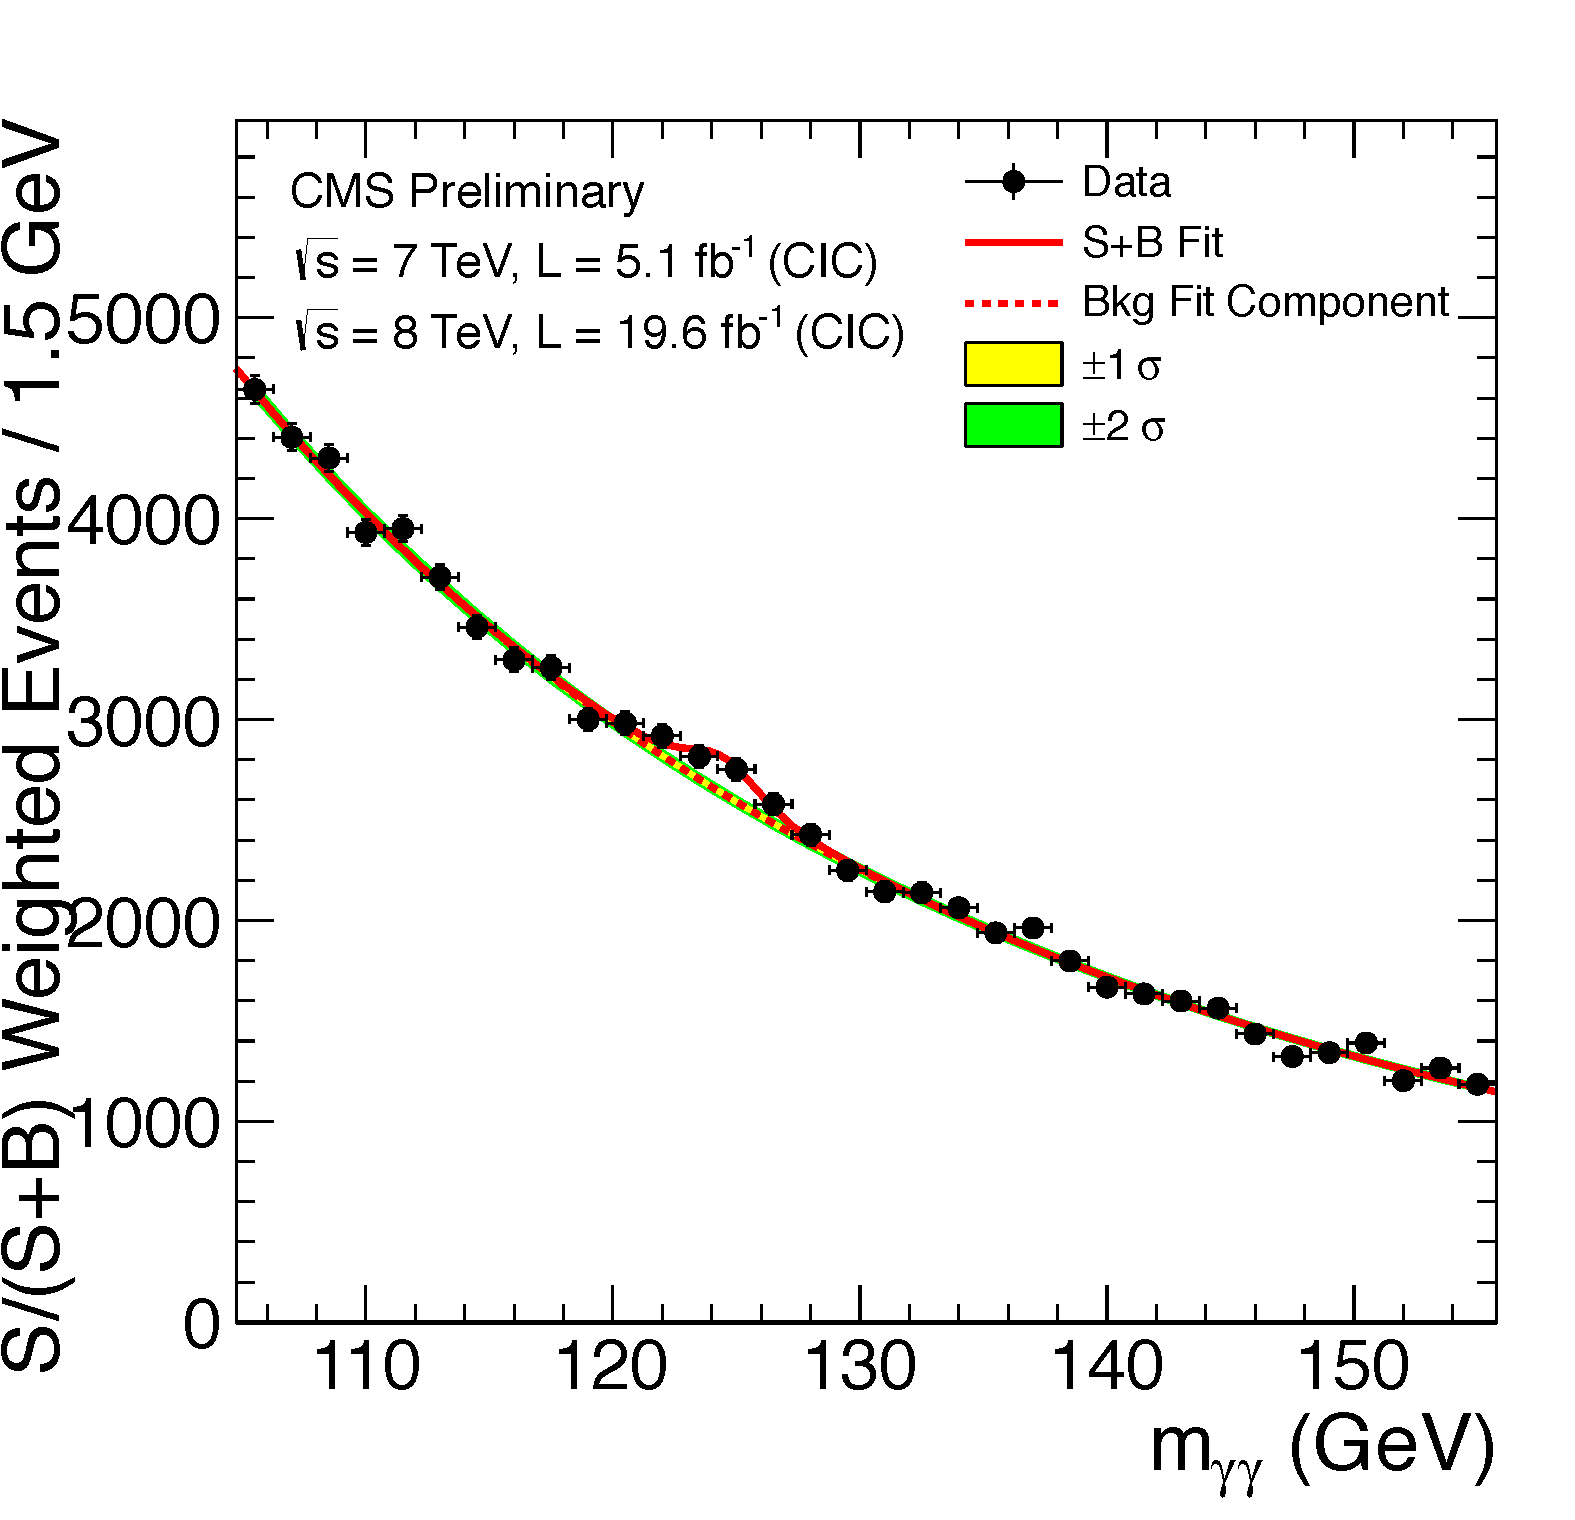
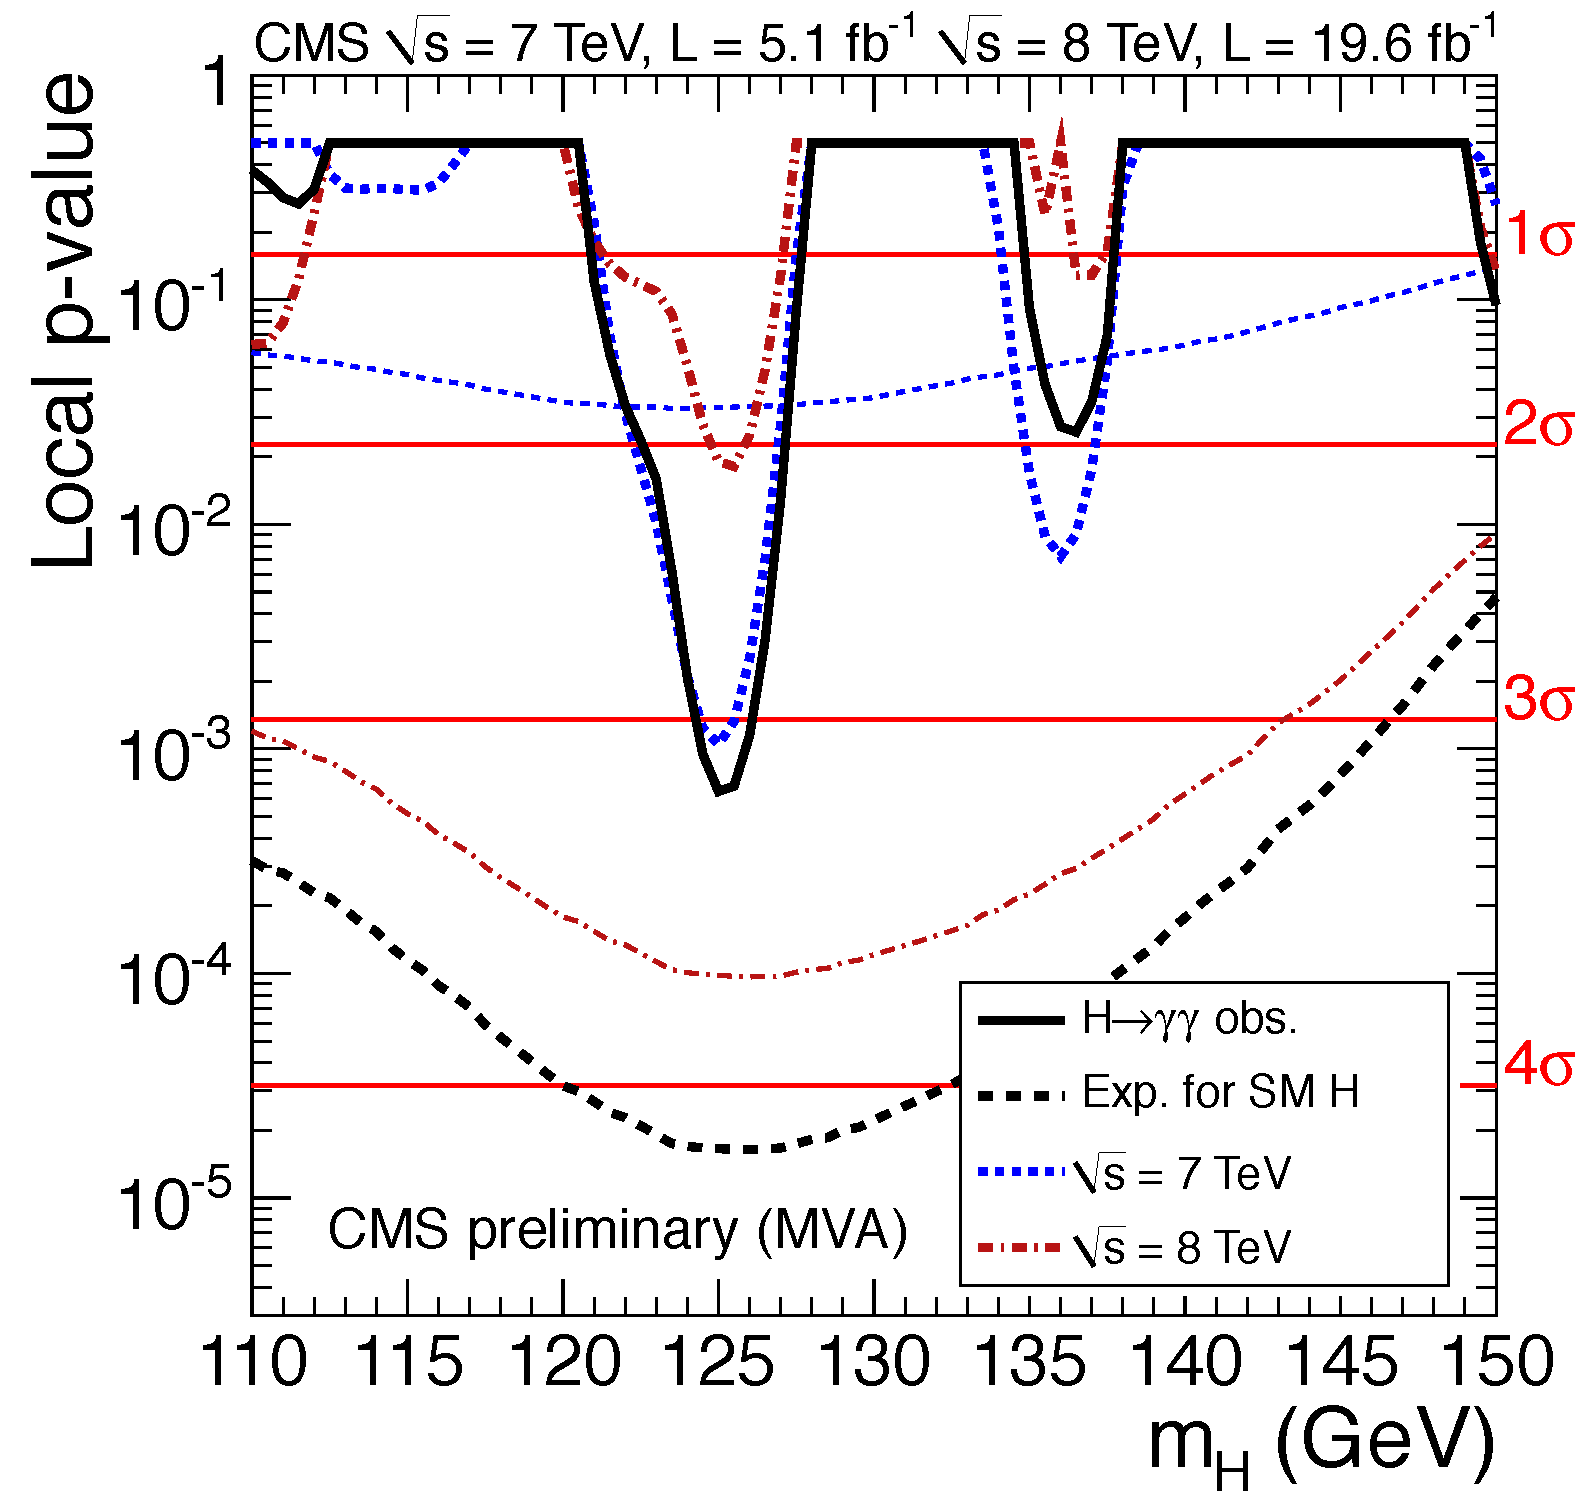
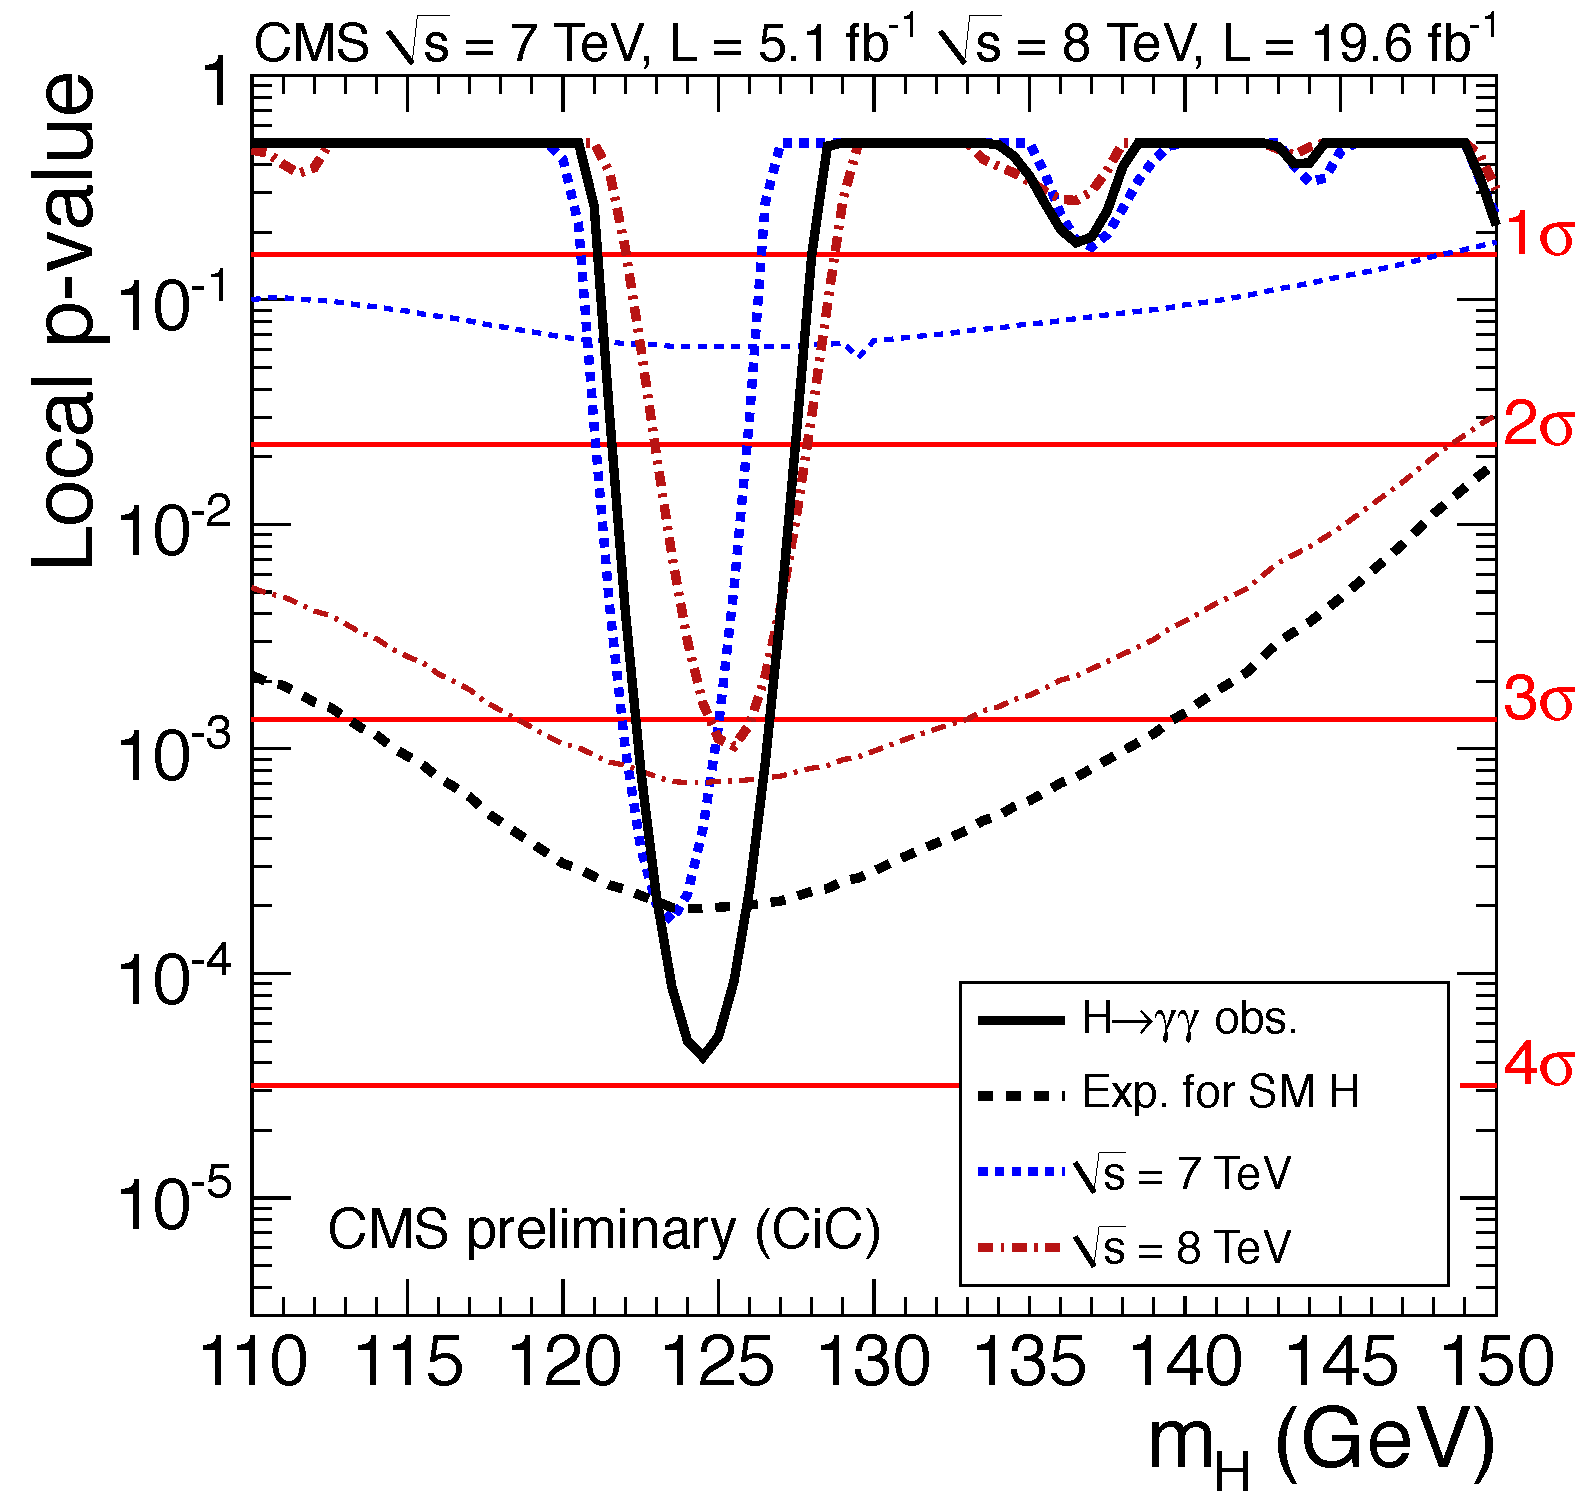
The S/(S+B) weighted distributions of data in the MVA and cut-based analyses are shown in figure 2. The expected and observed significance is in figure 3 for the two analyses. At 125 GeV, the expected significance is and the observed is in the main analysis. At 124.5 GeV, the expected significance is and the observed is in the cut-based analysis.
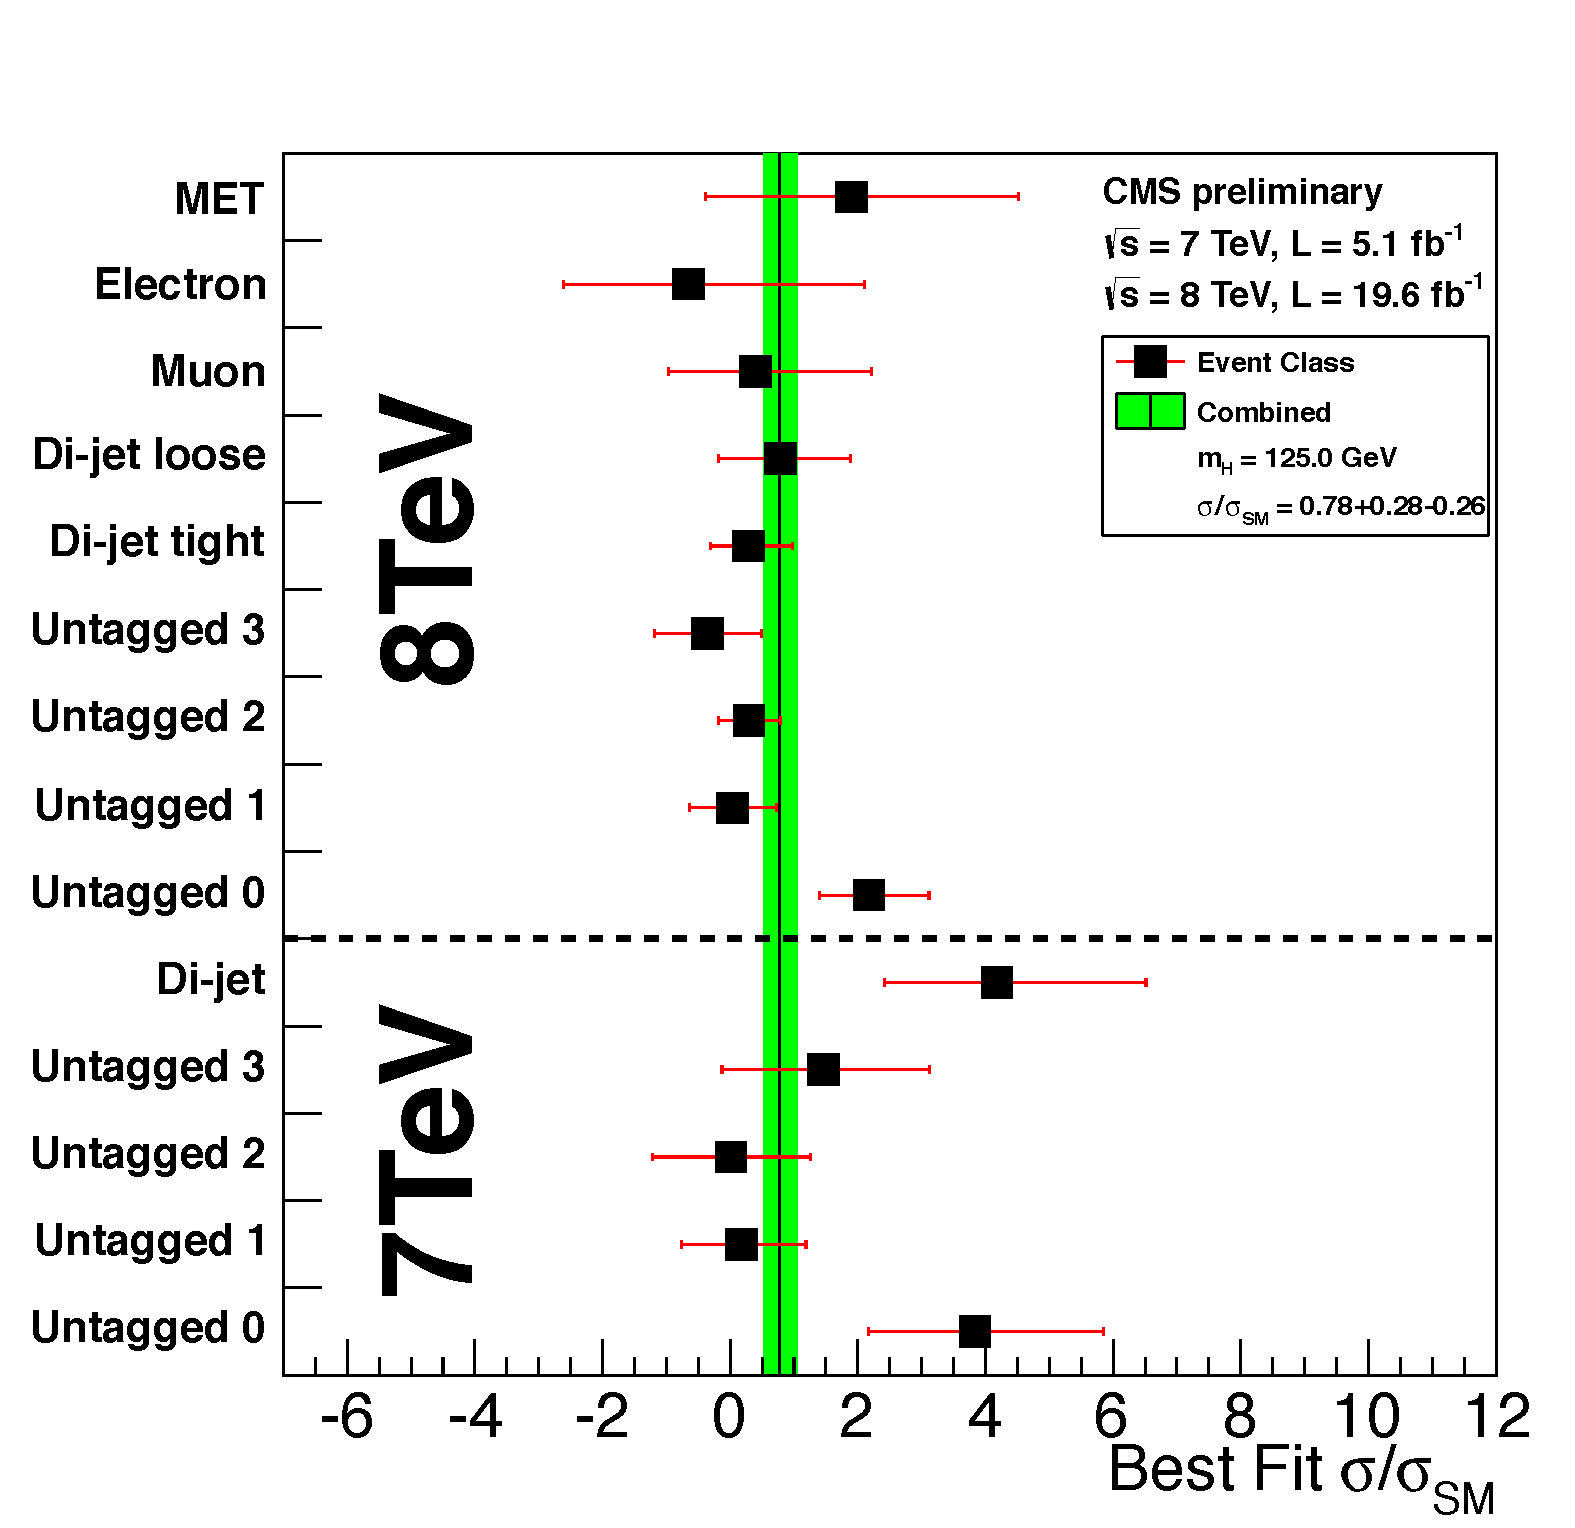
In figure 4 is the channel compatibility of each of the categories and the combination is in green. In the 2011 data one can see the large excess in untagged 0 and di-jet tag. In the 2012 data a large excess is visible in untagged 0 as well.
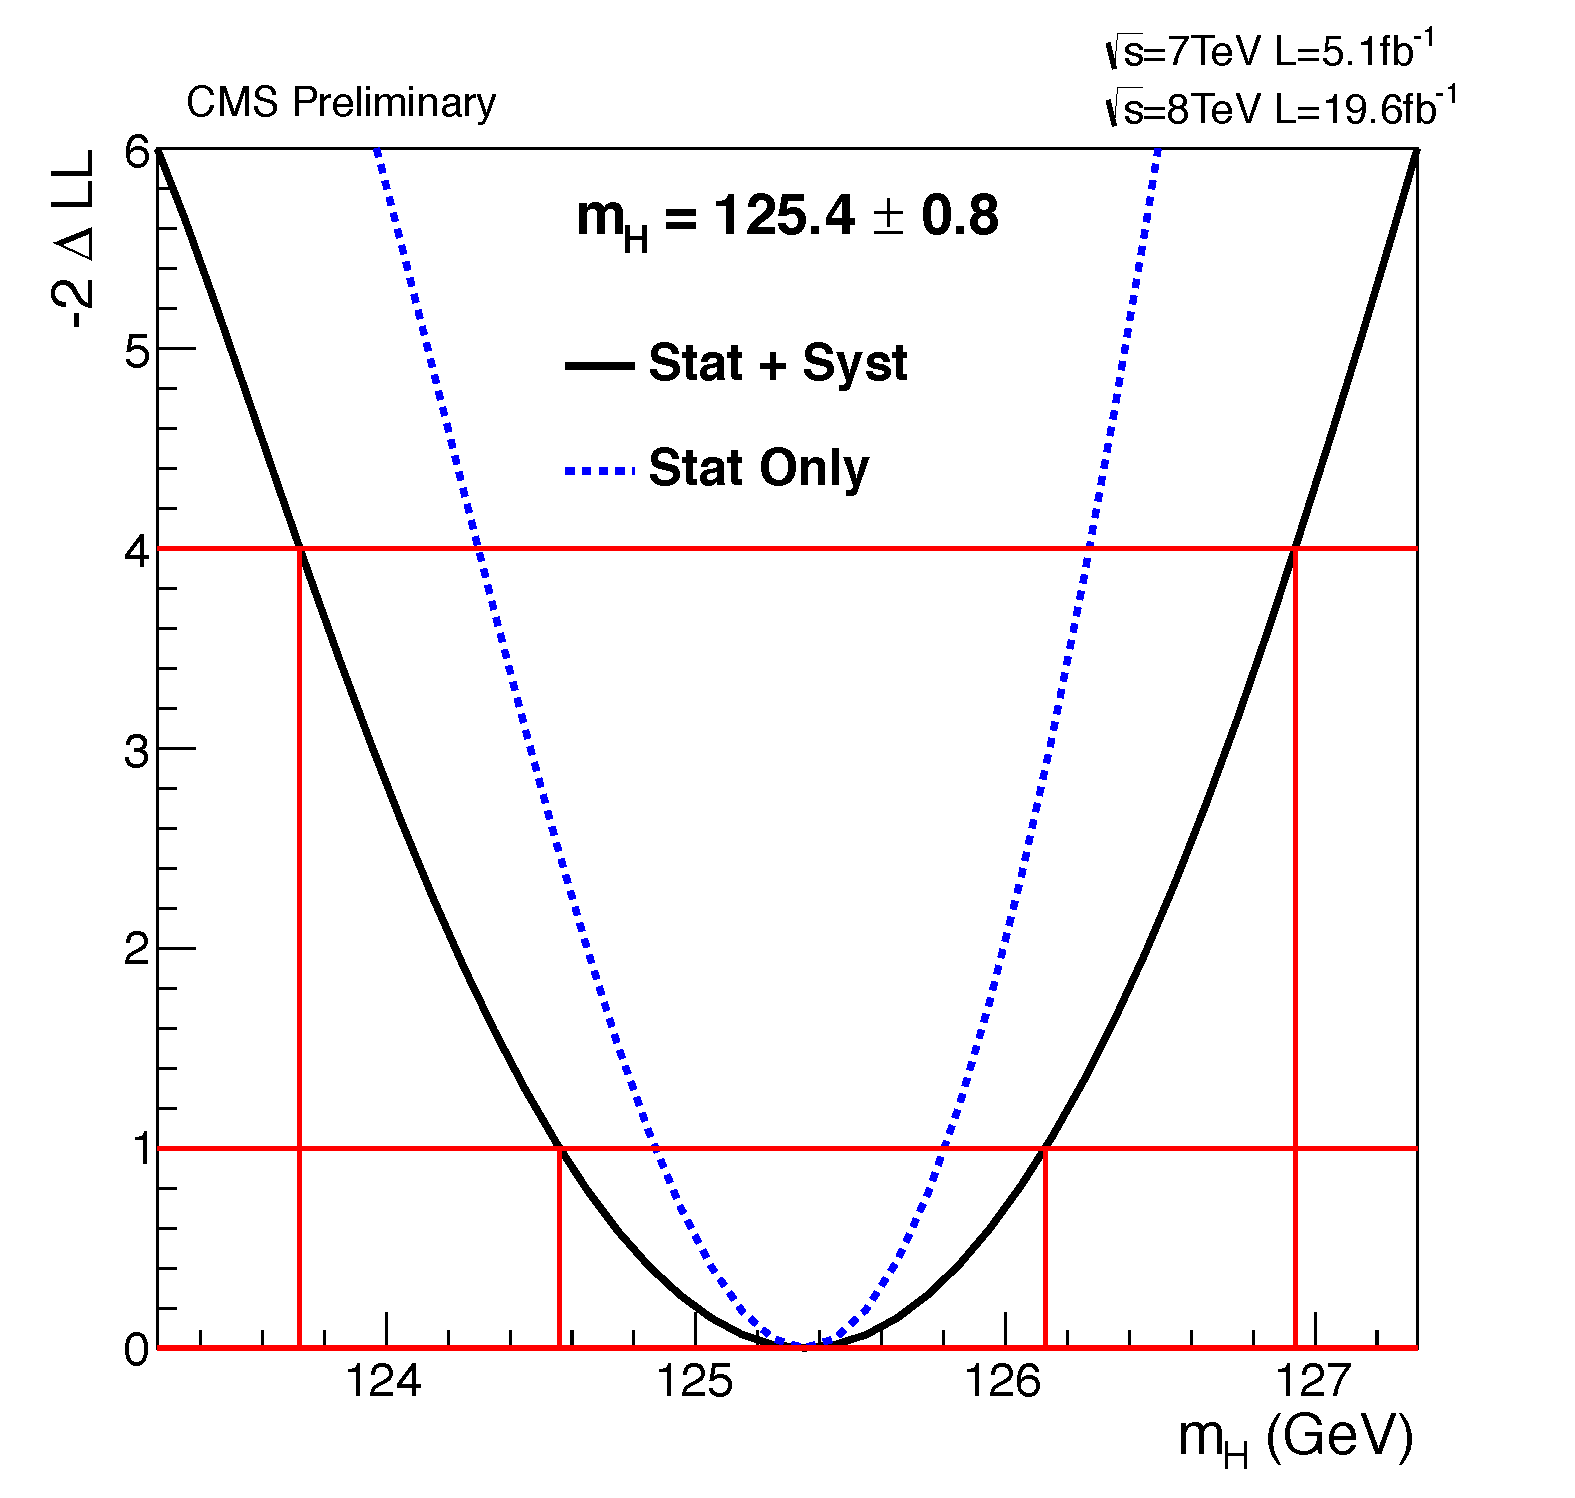
An important property of the observed boson is its mass. In this decay channel there is very good mass resolution. The two main systematics that limit this measurement are the differences between electrons and photons, and the uncertainty in energy scale which is extrapolated from the mass of the Z boson to the mass of the observation. The combined systematic from these two has been estimated to be 0.47%. The mass of the higgs-like particle has been measured at be GeV and the measurement is shown in figure 5.
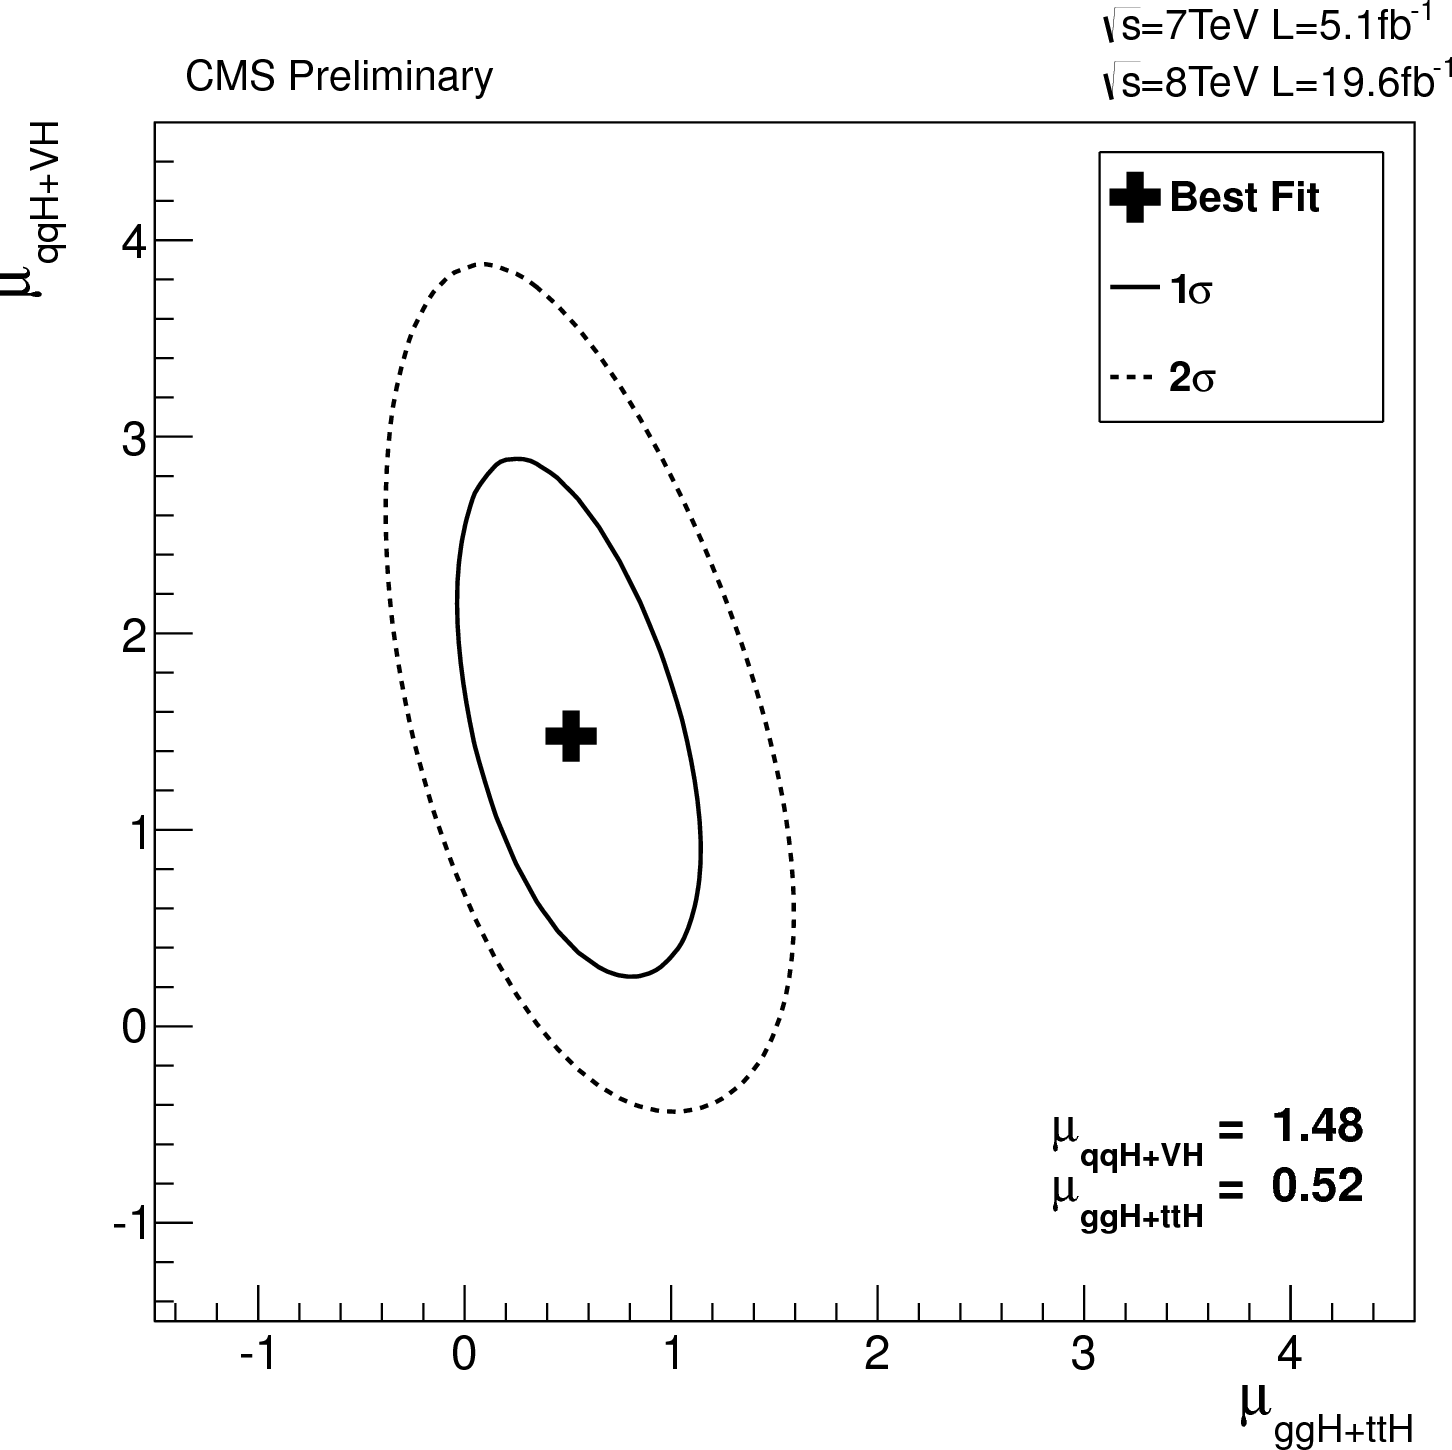
Finally, a two dimensional scan of the signal strength was performed. One dimension is the signal strength of gluon fusion production plus H production, and the other is the VBF plus VH production. In figure 6 the scan shows best fit values of with the SM prediction being which is within of the best fit. Thus, the observed boson is compatible with a SM higgs boson.
IV Conclusions
The results of the search for a Standard Model Higgs Boson decaying into two photons have been updated using data obtained from and of pp collisions at TeV and at TeV, respectively. The selected events have been subdivided into classes according to indicators of mass resolution and predicted signal-to-background ratio, and the results of a search in each class have been combined.
An excess of events above the expected SM background has been observed for a Higgs boson mass hypothesis of 125 GeV, where the expected limit is 0.48 times the SM expectation. The local significance of this excess is 3.2. This result constitutes further evidence for the existence of a new massive state that decays into two photons. The mass of the observed boson is measured to be GeV. For a Higgs boson mass hypothesis of 125.0 GeV, the best fit signal strength is times the SM Higgs boson cross-section.
References
- (1) CMS Collaboration, CMS-PAS-HIG-12-020 Observation of a new boson with a mass near 125 GeV, CERN, 2012.
- (2) S. Weinberg, “A Model of Leptons”, Phys. Rev. Lett. 19 (1967) 1264.
- (3) A. Salam, “Elementary Particle Theory”, p. 367. Almquist and Wiksells, Stockholm, 1968.
- (4) F. Englert and R. Brout, “Broken symmetries and the masses of gauge bosons”, Phys. Rev. Lett. 13 (1964) 321.
- (5) P. W. Higgs, “Broken symmetry and the mass of gauge vector mesons”, Phys. Rev. Lett. 13 (1964) 508.
- (6) CMS Collaboration, Updated Measurements of the Higgs-like Boson at 125 GeV in the Two Photon Decay Channel CMS-PAS-HIG-13-001 (2013).