Discovery of an extra hard spectral component in the high-energy afterglow emission of GRB 130427A
Abstract
The extended high-energy gamma-ray ( 100 MeV) emission occurred after the prompt gamma-ray bursts (GRBs) is usually characterized by a single power-law spectrum, which has been explained as the afterglow synchrotron radiation. The afterglow inverse Compton emission has long been predicted to be able to produce a high-energy component as well, but previous observations have not revealed such a signature clearly, probably due to the small number of 10 GeV photons even for the brightest GRBs known so far. In this Letter, we report on the Fermi Large Area Telescope (LAT) observations of the 100 MeV emission from the very bright and nearby GRB 130427A. We characterize the time-resolved spectra of the GeV emission from the GRB onset to the afterglow phase. By performing time-resolved spectral fits of GRB 130427A, we found a strong evidence of an extra hard spectral component that exists in the extended high-energy emission of this GRB. We argue that this hard component may arise from the afterglow inverse Compton emission.
Subject headings:
gamma rays: bursts — gamma rays: observations1. Introduction
One of the major scientific objectives of the Fermi Gamma-ray Space Telescope before launch is to characterize the spectrum of gamma-ray bursts (GRBs) over 7 decades of photon energies, i.e., from 8 keV to over 100 GeV, both during the prompt emission phase and the afterglow phase (see, e.g., Band et al., 2009). Determining where a GRB spectrum ends at high energies has important implications on GRB physics. The Fermi Large Area Telescope (LAT) observations of GRBs over the past few years have proved very fruitful, and results are summarized in the first LAT GRB catalog and references therein (Ackermann et al., 2013a). Major results include the establishment of the temporally extended GeV emission from many LAT-detected GRBs.
The spectrum of the extended emission above 100 MeV is usually characterized by a single power law. However, due to the steeply decreasing photon flux from GRBs above 10 GeV, the LAT has by now only detected a handful of 10 GeV photons from GRBs; the most energetic of all observed photons from GRBs is the 33 GeV photon emitted 82 s after the Fermi’s Gamma-ray Burst Monitor (GBM) trigger of GRB 090902B (Abdo et al., 2009). An extra hard spectral component during the prompt phase has been detected in cases like GRB 090902B and GRB 090926A (Abdo et al., 2009; Ackermann et al., 2011). It is, however, yet unclear whether the single power-law spectrum extends above 10 GeV or there is any extra spectral components or even cutoffs in the GeV emission well after the prompt phase. This lack of information is mostly due to the limited photons statistics above a few GeV, where a single power-law spectrum seems to adequately describe the 100 MeV spectra observed so far.
The widely discussed scenario for this temporally extended GeV emission is the afterglow synchrotron model, where electrons are accelerated by external forward shocks and produce GeV photons via synchrotron radiation (e.g. Kumar & Barniol Duran 2009, 2010; Ghisellini et al. 2009; Wang et al. 2010). This model works well for high-energy emission above 100 MeV. However, since the synchrotron radiation has a maximum photon energy (typically MeV in the rest-frame of the shock), it is hard to explain the 10 GeV photons detected during the afterglow phase (Piran & Nakar 2010; Barniol Duran & Kumar 2011; Sagi & Nakar 2012; Wang et al. 2013). Recently, Wang et al. (2013) suggested that these GeV photons detected from some LAT GRBs could originate from the synchrotron self-Compton (SSC) emission of the early afterglow if the circum-burst density is sufficiently large, or from external inverse Compton processes in the presence of central X-ray emission (Wang et al., 2006). The afterglow inverse Compton scenario has been proposed for a while and has been extensively studied (Mészáros & Rees, 1994; Zhang & Mészáros, 2001; Sari & Esin, 2001; Fan et al., 2008). The external inverse Compton scenario (e.g. scattering off X-ray flare photons) has been supported by the simultaneous detections of X-ray flares (by Swift) and GeV emission (by Fermi LAT) in GRB 100728A (Abdo et al., 2011; He et al., 2012; Zhang et al., 2011).
Recently, based on similar theoretical arguments, Fan et al. (2013) suggested that inverse Compton scattering plays a crucial role in giving rise to the 10 GeV photons from GRB 130427A that arrive 100 s after the GRB onset. In this Letter, we make use of the publicly available LAT data to derive the basic characteristics of the GeV emission from GRB 130427A. We derive the time-resolved spectra during the afterglow phase and to study the presence of any inverse Compton spectral component.
2. Properties of GRB 130427A
GRB 130427A triggered several space instruments: Swift/BAT (Maselli et al., 2013), Fermi Gamma-Ray Telescope (Zhu et al., 2013a; von Kienlin et al., 2013), Konus-Wind (Golenetskii et al., 2013), SPI-ACS/INTEGRAL (Pozanenko et al., 2013), and AGILE (Verrecchia et al., 2013). Three RAPTOR full-sky persistent optical monitors also recorded the event (Wren et al., 2013). We adopt the GBM trigger time, i.e., 07:47:06.42 UT on April 27, 2013, as throughout this work (von Kienlin et al., 2013).
The burst duration, , is about 138s as measured by the Gamma-Ray Burst Monitor (GBM) onboard Fermi in the energy range 50–300 keV. Most notably, the energy fluence as measured in the prompt emission phase is around 210-3 erg cm-2, putting GRB 130427A as the GRB with the highest fluence in the mission life of both Fermi/GBM and Konus-Wind (von Kienlin et al., 2013; Golenetskii et al., 2013), as well as the burst having the highest fluence measured by the LAT during the prompt phase.
Swift’s X-ray Telescope (XRT) began data-taking of the burst at s and found the X-ray afterglow at the position R.A. , Dec. (J2000), with an error circle of radius (90% confidence level; Kennea et al., 2013). This position is used in the analyses presented in this Letter. The flux faded steeply initially as a power law with an index of and, after a break at s, as (Evan et al., 2013). The redshift of the burst was found to be (Flores et al., 2013; Levan et al., 2013; Xu et al., 2013). At this distance, its isotropic energy is erg (Kann & Schulze, 2013), making it the most energetic GRB yet detected at .
The angle of the GRB position is about 47∘ from the LAT boresight when GBM was triggered and the GRB remains within the LAT field-of-view (FoV) until around s (Zhu et al., 2013a). The GeV emission can be detected up to about one day after the burst, although the GRB position had been occulted by the Earth several times over such period (Zhu et al., 2013b).
The LAT emission from GRB 130427A lasts well beyond the prompt emission period until about one day after the GRB onset. This is the longest GeV afterglow emission ever recorded for a GRB. Furthermore, the GeV photons that GRB 130427A emits contain some of the most energetic -rays from GRBs. A total of twelve 10 GeV photons were recorded in the first 700 s after the burst onset, including a 95.3 GeV photons arriving at s. At , this photon has an intrinsic photon energy (energy as measured at the source frame) of 128 GeV, the highest ever known from a GRB. Such a long duration and high photon energy may simply due to the proximity of GRB 130427A, as compared to other bright LAT GRBs, since the observed energy of a photon is the intrinsic photon energy divided by a factor of , and the late GeV afterglow of a far-away GRB 130427A-like could be below the sensitivity level of the LAT. The photon-photon attenuation of multi-GeV photons by the extragalactic background light would only strengthen this distance-only argument. On the other hand, the unique physical conditions in the jet and/or the environment of GRB 130427A might still play a role in giving rise to the large number of 10 GeV photons and the very high photon energy that they possess.
3. LAT data analysis and results
3.1. Spectral analysis
GRB spectra are expected to change over time, so we performed time-resolved spectral analysis of the LAT data. The Fermi Science Tools v9r27p1 package was used to reduce and analyze the data between 100 MeV and 100 GeV. Using the “P7TRANSIENT”-class data would increase the effective collection area, and thus the photon statistics, by 50–100% above 100 MeV, compared to the event class “P7SOURCE_V6” (Ackermann et al., 2012). Nevertheless, since our focus is in the extended GeV emission that lasts for about one day, for simplicity we made use of the events classified as “P7SOURCE” for all analyses. The instrument response functions “P7SOURCE_V6” were used. To reduce the contamination from Earth albedo -rays, we excluded events with zenith angles greater than 100∘.
We then performed unbinned maximum-likelihood analyzes (gtlike) of a 20-ROI centered at the Swift/XRT position to characterize the spectra of the 100 MeV -rays from the GRB onset to the afterglow phase. The Galactic diffuse emission (gal_2yearp7v6_v0.fits) and the isotropic diffuse component (iso_p7v6source.txt), as well as sources in the second Fermi catalog were included in the background model. However, an isotropic component turns out to be enough to model the background photons in the time bins before s, due to the dominance of the GRB emission over other sources in the ROI during these short-duration intervals.
Firstly, we performed analysis for the whole energy range (i.e., 100 MeV to 100 GeV), assuming a single power law spectrum for the LAT photons from the GRB. Four time intervals from the prompt to afterglow phases were used. We found that the photon indices, for all time bins (see Table 1). However, it is expected that GeV spectra might change over time in the 1-day period. We therefore divided the LAT energy range into five energy bins, and performed likelihood analyzes for each bin, letting the photon index of the GRB to be free in each energy bin. We plot the flux given by the analysis of each bin in Fig. 1. It is apparent that the 100 MeV to 100 GeV spectra are indeed not well described by single power laws in some time intervals.
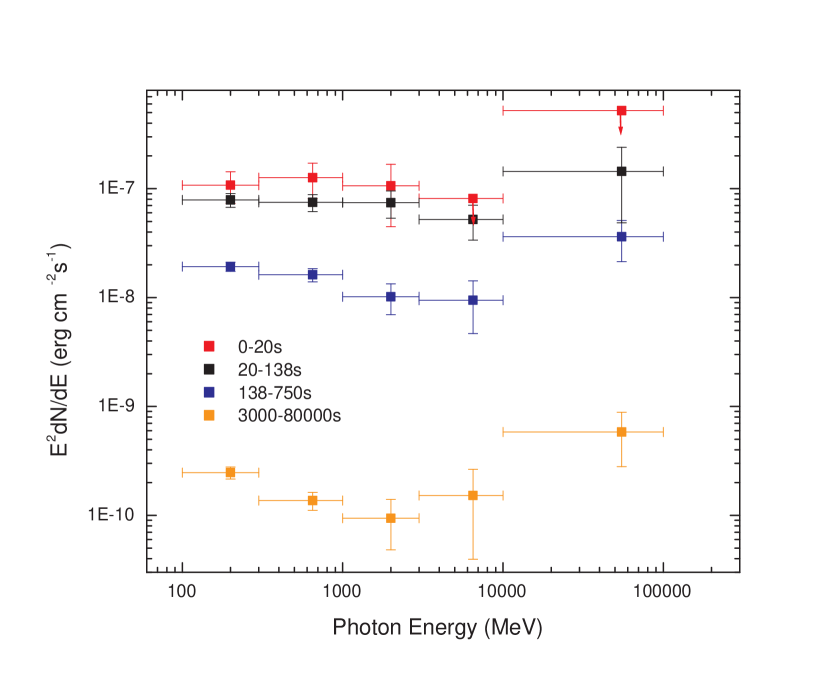
We therefore employed the broken power-law model (BPL). The results are shown in Table 1. It was found that the BPL fits the data better than a single PL at a significance level of 2.5–2.9 for the latter two time intervals (i.e., after 138 s), consistent with a visual inspection of Fig. 1. Fitting the data from 138s to 80ks with a BPL gives an improvement over a PL at a significance level of 3.5. We hence conclude that a soft (), low-energy spectral component below 1 GeV co-exists with a hard () component at energies higher than a few GeV after s . It is possible that the high-energy hard component already exists at the latter phase of the prompt emission, but our analysis found that a single power law fits the data as good as a broken power law in the second time interval, i.e., 20–138 s. An attempt to fit the data using the smooth broken power law, which contain an additional free parameter, did not provide constraining spectral fits.
| Power Law (PL) | Broken Power Law (BPL) | Improvement of BPL over PLaa calculated as | |||
|---|---|---|---|---|---|
| (sec) | () | () | (GeV) | () | |
| 0–20 | 2.00.2 | ||||
| 20–138 | 1.90.1 | ||||
| 138–750 | 2.10.1 | 2.20.1 | 1.40.2 | 4.32.0 | 2.5 |
| 3000–80,000 | 2.10.1 | 2.60.7 | 1.40.2 | 1.10.9 | 2.9 |
| 138–80,000 | 2.10.1 | 2.30.2 | 1.40.1 | 2.51.1 | 3.5 |
3.2. Energy dependent light curves
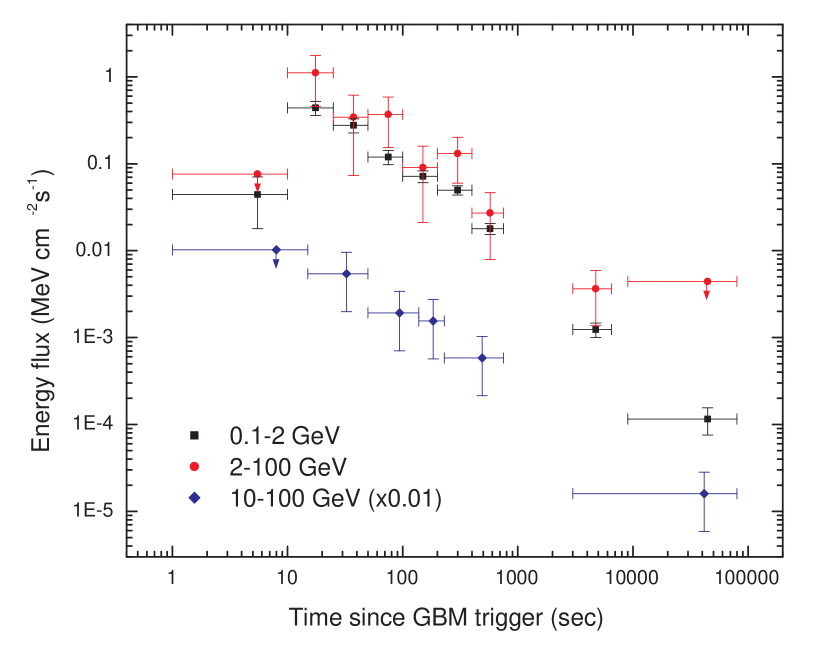
To further investigate the time evolution of the two spectral components, we generated two light curves using unbinned likelihood analyses using photons below and above 2 GeV, respectively, as shown in Fig. 2. The dividing line at 2 GeV was chosen to be roughly equal to the break energy, , found in the BPL model after s (c.f. Table 1). The time bins were chosen to ensure enough photon statistics in both bands (especially in the 2–100 GeV band). The low-energy (0.1–2 GeV) light curve can be described by a single power law decay with an index , while the high-energy (2–100 GeV) light curve can be described by a single power law decay with an index .
During the last time range, i.e., 9 ks–80 ks after the burst, the likelihood analysis at energies 2–100 GeV formally returns a test-statistic value of 28 (corresponding to a detection significance of about 5; Mattox et al., 1996), but the LAT only detected two photons above 2 GeV at that time, one of them having an energy 32 GeV, so we conservatively put an upper limit here. Assuming a photon index of 1.4 as derived from the broken-power fit in the 3 ks–80 ks time interval (see Sect. 3.1), the upper limit of the energy flux 2 GeV during 9 ks–80 ks is the one shown in Fig. 2. If we assume a very steep 2.8 (i.e., extrapolating the PL index found in a spectral analysis of the 0.1–2 GeV range during 9 ks–80 ks), the upper limit would become 3.410-4 MeV cm-2s-1. However, we believe the spectral index is more likely to be hard based on the spectral studies in Sect. 3.1. On the other hand, the detection of the single 32 GeV photon corresponds to an energy flux of 910-5 MeV cm-2s-1.
3.3. The 10 GeV photons
Even compared to the four brightest LAT GRBs (GRB 080916C, GRB 090510, GRB 090902B, and GRB 090926A) known so far, GRB 130427A is still peculiar in that it radiated over a hundred 1 GeV photons and a dozen photons at energies above 10 GeV. We dedicate this section to the 10 GeV photons emitted from GRB 130427A.
We present a list of 10 GeV photons associated with GRB 130427A during the prompt and afterglow phases. First we selected all photons within an ROI of 3∘ centered on GRB 130427A in the 80 ks after the burst. Following the formulation of Kerr (2011), a probability, , that a photon is associated with GRB 130427A (instead of coming from the background) was assigned to each photon, assuming the simple power law model as shown in Table 1. The arrival times and energies of those photons of energy 10 GeV with 99.5% are shown in Table 2. We note that the energy resolution of 10–100 GeV photons (i.e. 68% containment of the reconstructed incoming photon energy) is on the order of 10% (Ackermann et al., 2012).
We also produced a light curve using 10 GeV photons only. Due to the small number of 10 GeV photons, we follows the formulation of Feldman & Cousins (1998) to derive confidence levels based on the number of detected photons above 10 GeV in each time interval. Given the smaller photon statistics at these energies, longer time intervals are used, as compared to those in the light curves at lower energies as given in Sect. 3.2. Over the past four and a half years, the number of 10 GeV photons that was detected from an ROI of radius one degree (which is roughly the point-spread-function of a 10 GeV photon) centered on the GRB position is only 11. The expected number of background photons is therefore very close to zero in short time ranges. The exposure was then calculated using the tool gtexposure which is not sensitive to the assumed photon index. A large uncertainty is related to the conversion of the number of photons to the energy it corresponds, in which one has to assume a photon index at 10 GeV. Based on the results from spectral analysis, we assume for those time bins before 230s, and for those after 230s. We note that the energy flux thus calculated is increased by a factor of 2.3 when is changed from 2.0 to 1.4.
The 10–100 GeV light curve, as plotted in Fig. 2, can be described by a single power law decay with an index .
| arrival time (since , in sec) | energy (GeV) |
|---|---|
| 18.4 | 72.6 |
| 22.9 | 10.3 |
| 47.3 | 27.5 |
| 64.2 | 11.2 |
| 80.2 | 12.3 |
| 84.5 | 25.8 |
| 140.8 | 21.2 |
| 213.7 | 11.4 |
| 217.2 | 14.9 |
| 242.8 | 95.3 |
| 256.0 | 47.3 |
| 610.3 | 41.4 |
| 3409.6 | 38.5 |
| 6062.3 | 18.6 |
| 34365.9 | 32.0 |
4. Discussion
In the afterglow synchrotron emission scenario (Kumar & Barniol Duran 2009, 2010; Ghisellini et al. 2010; Wang et al. 2010), the photon spectrum is characterized by a single power-law with and the flux decays as , where is the electron distribution index. The GeV emission in GRB130427A is well consistent with this picture, taking .
The hard spectral component () above GeV in GRB130427A should have another origin. A natural scenario for this hard spectral component is the afterglow SSC emission, in which a spectrum is expected above the peak frequency of the SSC spectrum (i.e. , Sari & Esin 2001), where the two break frequencies are given by (Wang et al. 2013)
| (1) |
and
| (2) |
is the Compton parameter for electrons of energy (i.e., the cooling Lorentz factor in the electron distribution) and . Here and are, respectively, the equipartition factor for shock energy in electrons and the magnetic field, is the blast wave energy, and is the number density of the circum-burst medium. For , the expected photon index is , which is consistent with the observed photon index above the break. The broken power-law spectrum may indicate that the SSC component is dominant only at energies above several GeV and the synchrotron component is dominant below that. This is possible since the synchrotron radiation has a maximum photon energy, which is thought to be below 10 GeV at hundreds of seconds after the burst (Piran & Nakar 2010; Sagi & Nakar 2012; Lemoine 2013; Wang et al. 2013).
The flux of the SSC component decreases as when falls below the observed frequency (Sari & Esin 2001),
| (3) |
So the flux above 10 GeV is expected to decay after the shock deceleration time s (where is the initial bulk Lorentz factor of the forward shock), and with a slope of (for ), which is consistent with the observed decay slope.
In this work, we have discovered an extra hard spectral component above a few GeV from GRB 130427A that exists from 100 s up to one day after the GRB onset. This means that the afterglow spectrum of a GRB may extend to the very high energy -ray range, i.e., 100 GeV. In fact, the redshift of GRB 130427A, , puts it at a distance whose very high energy -rays could have been detected (Xue et al., 2009). GRB observations using current or future generations of the Imaging Atmosphere Cherenkov Telescopes (IACTs), such as H.E.S.S. II, MAGIC II, VERITAS, and CTA, not only minutes but hours after the prompt emission phase is thus crucial to study such a hard spectral component in more details, thanks to their much larger effective collection area than the LAT.
References
- Abdo et al. (2009) Abdo, A. A. et al. (Fermi/LAT collaboration) 2009, ApJ, 706, L138
- Abdo et al. (2010) Abdo, A. A. et al. (Fermi/LAT collaboration) 2010, ApJ, 716, 1178
- Abdo et al. (2011) Abdo, A. A. et al. (Fermi/LAT collaboration) 2011, ApJ, 734, L27
- Ackermann et al. (2011) Ackermann, M. et al. (Fermi/LAT collaboration) 2011, ApJ, 729, 114
- Ackermann et al. (2012) Ackermann, M. et al. (Fermi/LAT collaboration) 2012, ApJS, 203, 4
- Ackermann et al. (2013a) Ackermann, M. et al. (Fermi/LAT collaboration) 2013a, preprint[arXiv:1303.2908]
- Ackermann et al. (2013b) Ackermann, M. et al. (Fermi/LAT collaboration) 2013b, ApJ, 763, 71
- Band et al. (2009) Band, D. L., Axelsson, M., Baldini, L., et al. 2009, ApJ, 701, 1673
- Evan et al. (2013) Evans, P. A., Page, K. L., Maselli, A., Mangano, V., Capalbi, M., Burrows, D. N. 2013, GCN Circ. 14502
- Fan et al. (2008) Fan, Y.-Z., Piran, T., Narayan, R., & Wei, D.-M. 2008, MNRAS, 384, 1483
- Fan et al. (2013) Fan, Y.-Z. et al. 2013, submitted, preprint[arXiv:1305.1211]
- Feldman & Cousins (1998) Feldman, G. J. & Cousins, R. D. 1998, Phys. Rev. D, 57, 3873
- Flores et al. (2013) Flores, H. et al., 2013, GCN Circ. 14491
- Ghisellini et al. (2010) Ghisellini, G., Ghirlanda, G., Nava, L., & Celotti, A. 2010, MNRAS, 403, 926
- Golenetskii et al. (2013) Golenetskii, S., et asl. 2013, GCN Circ. 14487
- He et al. (2012) He, H.-N., Wu, Zhang, B.-B., Wang, X. Y., Li, Z. & Mészáros, P. 2012, ApJ, 753, 178
- Kann & Schulze (2013) Kann, D. A. & Schulze, S. 2013, GCN Circ. 14580
- Kennea et al. (2013) Kennea, J. A. 2013, GCN Circ. 14485
- Kerr (2011) Kerr, M. 2011, ApJ, 732, 38
- von Kienlin et al. (2013) von Kienlin, A., 2013, GCN Circ. 14473
- Kumar & Barniol Duran (2009) Kumar, P. & Barniol Duran, R. 2009, MNRAS, 400, L75
- Kumar & Barniol Duran (2010) Kumar, P. & Barniol Duran, R. 2010, MNRAS, 409, 226
- Lemoine (2013) Lemoine, M. 2013, MNRAS, 428, 845
- Levan et al. (2013) Levan, A. J., Cenko, S. B., Perley, D. A., & Tanvir, N. R. 2013, GCN Circ. 14455
- Maselli et al. (2013) Maselli, A., Beardmore, A. P., Lien, A. Y., Mangano, V., Mountford, C. J., Page, K. L., Palmer, D. M., & Siegel, M. H. 2013, GCN Circ. 14448
- Mattox et al. (1996) Mattox, J. R., et al. 1996, ApJ, 461, 396
- Mészáros & Rees (1994) Mészáros, P. & Rees, M. 1994, MNRAS, 269, L41
- De Pasquale et al. (2010) De Pasquale, M., et al. 2010, ApJ, 709, L146
- Piran & Nakar (2010) Piran, T., & Nakar, E. 2010, ApJ, 718, L63
- Pozanenko et al. (2013) Pozanenko, A., Minaev, P., & Volnova, A. 2013, GCN Circ. 14484
- Sagi & Nakar (2012) Sagi, E., & Nakar, E. 2012, ApJ, 749, 80
- Sari & Esin (2001) Sari, R. & Esin, A. A. 2001, ApJ, 548, 787
- Tam et al. (2012) Tam, P. H. T., Kong, A. K. H., & Fan, Y.-Z. 2012, ApJ, 754, 117
- Verrecchia et al. (2013) Verrecchia, F., et al. 2013, GCN Circ. 14515
- Wang et al. (2006) Wang, X. Y., Li, Z., & Mészáros, P. 2006, ApJ, 641, L89
- Wang et al. (2010) Wang, X.-Y., He, H.-N., Li, Z., Wu, X.-F., & Dai, Z.-G. 2010, ApJ, 712, 1232
- Wang et al. (2013) Wang, X.-Y., Liu, R.-Y., & Lemoine, M. 2013, arXiv:1305.1494
- Wren et al. (2013) Wren, J., Vestrand, W. T., Wozniak, P., & Davis, H. 2013, GCN Circ. 14476
- Xu et al. (2013) Xu, D., et al. 2013, GCN Circ. 14478
- Xue et al. (2009) Xue, R. R., Tam, P. H., Wagner, S. J., Behera, B., Fan, Y. Z., Wei, & D. M. 2009, ApJ, 703, 60
- Zhang & Mészáros (2001) Zhang, B., & Mészáros, P., 2001, ApJ, 559, 110
- Zhang et al. (2011) Zhang, B.-B., et al. 2011, ApJ, 730, 141
- Zhu et al. (2013a) Zhu, S., Racusin, J., Kocevski, D., McEnery, J., Longo, F., Chiang, J., & Vianello, G. 2013a, GCN Circ. 14471
- Zhu et al. (2013b) Zhu, S., Racusin, J., Kocevski, D., McEnery, J., Longo, F., Chiang, J., & Vianello, G. 2013b, GCN Circ. 14508
- Zou et al. (2009) Zou, Y.-C., Fan, Y.-Z., & Piran, T. 2009, MNRAS, 396, 1163