Probe the 2 and 1 state level inversion with electron-nucleus scattering
Abstract
The neutron-rich even-even nuclei 26-40Mg, 28-46Si, 30-48S, and 32-56Ar are calculated with the RMF model and the phase-shift electron scattering method. Results show that level inversion of the 2 and 1 proton states may occur for the magnesium, silicon, sulphur, and argon isotopes with more neutrons away from the stability line. Calculations show that the variation of the central charge densities for 30-48S, and 32-56Ar are very sensitive to the 2 and 1 proton state level inversion, and the level inversion can lead to a large measurable central charge depletion to the charge density distributions for the neutron-rich isotopes. Calculations also show that the charge density differences between the isotopes with and without central charge depletion can reveal not only the level inversion of the 2 and 1 proton states but also the behavior of the proton wave functions of both states. The results can provide references for the possible study of the nuclear level inversion and nuclear bubble phenomenon with electron scattering off short-lived nuclei at RIKEN or/and GSI in the future. In addition, direct nuclear reaction 44S(n, d)43P or 44S(3H, )43P might also be a possible way to study the 2 and 1 proton state level inversion.
Keywords: s-d level inversion, electron-nucleus scattering, RMF model, nuclear bubble, phase-shift analysis
pacs:
25.30.Bf, 21.10.Ft, 21.10PcI Introduction
One of the hotly debated problem in nuclear physics is the existence of the nuclear level inversion and the related nuclear phenomena in exotic nuclei wim1 ; www1 . The problem of nuclear level inversion has been studied for many years both theoretically and experimentally and great progress has been achieved Ots1 ; Ots2 ; Ots3 ; Uts ; Pov ; Cau . However, there are still some problems to which the solutions are not really clear. For instance, the real causes for the nuclear level inversion are not completely known yet and some results given by different models or experiments do not agree with each other. Another unsolved problem, the nuclear bubble phenomenon, is also related to the nuclear level inversion. The nuclear bubble phenomenon has also been studied for many years with a variety of nuclear models wil46 ; sie67 ; Swi83 ; Dec03 . The majority opinion is that one of the main causes for the nuclear bubble formation is the s-d level inversion. However, we haven’t detected any nuclear bubbles yet. Do the nuclear bubbles really exist? If so, is the main cause the s-d level inversion? The clarification of these problems pleads for further elaborate experimental investigation on the level inversion and the related nuclear phenomena. In terms of the modern quantum theory, level inversion will lead to the change of the nucleon distribution, so a very good method to probe the level inversion could be to measure the nucleon distributions in exotic nuclei. Electron scattering has proven to be an excellent tool for measuring the charge density distributions and proton distributions of nuclei hof56 ; hof57 ; Don84 ; sic01 . Therefore, in this paper we focus on exploring the feasibility of studying the s-d level inversion with electron-nucleus scattering experiments.
In recent years, based on the development of the RI beam technology, some new facilities for electron scattering off short-lived nuclei have been constructed at different laboratories. For instance, the double storage rings of MUSES sud01 ; sud04 ; sud05 ; mot05 at RIKEN in Japan has made it possible to perform the electron scattering experiments by storing the radioactive ion beams in one ring and storing the electron beams in another. A new novel internal target for electron scattering on unstable nuclei, the SCRIT (self-confining radioactive isotope ion target), has also been developed and gained exciting success at RIKEN wak08 , and the first demonstrative experiment of electron scattering off short-lived nucleus 133Cs has been performed in 2009 sud001 . In addition, a similar electron-ion collider at GSI in Germany int02 ; sim07 ; rub06 has also been constructed. Very recently, great progress in parity-violating electron-nucleus scattering has been made at the Thomas Jefferson National Accelerator Facility in the United States abr001 . In parallel with the development of the new facilities and experimental researches, theoretical studies on electron scattering off exotic nuclei have also developed and some new results have been obtained Gar ; Ant ; Sar ; Kar ; Zai1 ; Roc ; Zai2 ; yan001 ; Ma001 . We believe that the theoretical results will provide useful references for experimental studies and that the newly built facilities will provide good opportunities for further studying the nuclear level inversion and the nuclear bubble problems with electron-nucleus scattering experiments in the future.
The possible appropriate candidate nuclei for studying the s-d level inversion and the proton bubble phenomenon could be the isotopes 30-48S and 32-56Ar, since their outmost protons just move in the 2 or/and 1 states, and this will make the proton distributions of these nuclei more sensitive to the s-d level inversion than those of the others. Along with the sulfur and argon isotopes the magnesium and silicon isotopes 26-40Mg and 28-46Si are also chosen for discussion and comparison. We will calculate the variations of the 2s1/2 and 1d3/2 proton state energy levels and the variation of the level gap between the two states with respect to the change of the neutron number to find the possible 2 and 1 state level inversion. We also calculate the charge density distributions, the elastic electron scattering form factors and cross sections to further investigate the influences of the 2 and 1 state level inversion so as to study if the 2 and 1 state level inversion and the proton bubbles can be detected with electron nucleus scattering.
The method that we use is the combination of the RMF nucleus structure theory and the phase shift analysis method for electron-nucleus scattering. The RMF theory is currently a widely used model in the calculations of stable as well as unstable nuclei wal1 ; wal2 ; wal3 ; gam1 ; hor1 ; ma1 ; ren3 ; ren4 ; Sug1 ; Jia1 ; tod1 . Therefore, we use this theory to investigate the energy levels and the proton occupation probabilities and produce the charge density distributions. Phase shift analysis is a very stable method in calculating the electron-nucleus scattering process in a wide range of incident energies Yenn001 ; Gar ; Ant ; Sar ; Kar ; Zai1 ; Roc ; Zai2 ; yan001 ; Ma001 , so we use this method to calculate the cross sections and form factors.
The paper is organized in the following way. Section II is a brief review of the formalism of the phase shift analysis method for elastic electron scattering. Section III is the numerical results and discussions. A summary is given in Section IV.
II Formalism
The elastic electron scattering process can be described by the Dirac equation Rose
| (1) |
where and are the Dirac matrices, and p are the energy and momentum of the incident electrons, and is the rest mass of the electron. is the potential between the electron and the nucleus. To obtain the differential cross section of the elastic electron scattering, we must solve the above Dirac equation. In the following we introduce the phase-shift analysis method. The details of this method can be found in many quantum physics literatures Yenn001 ; yan001 ; Ma001 , so we only give a brief review of it.
For a spherical scalar potential , the wave function of the Dirac equation can be expanded in terms of a series of spherical spinors with definite angular momenta Bjorken
| (4) |
where is the upper-component radial wave function, is the lower-component one, and are the spherical spinors. The functions and satisfy
| (5) | |||
| (6) |
After determining the asymptotic behavior of , we can express the upper and lower radial wave functions at large distances as
| (7) | |||
| (8) |
where and are the regular and irregular Dirac spherical Coulomb functions. The symbols and stand for the upper and lower components and is the phase shift.
By solving the coupled radial equations Eqs. (5) and (6) with the asymptotic conditions defined by Eqs. (7) and (8), we can obtain the spin-up () and spin-down () phase shifts for the partial wave with orbital angular momentum . Then we can determine the direct scattering amplitude by
| (9) |
and the spin-flip scattering amplitude by
| (10) |
where and are the Legendre polynomials and associated Legendre functions, respectively. The differential cross section for the elastic electron-nucleus scattering can be obtained as follows
| (11) |
After the differential cross sections are obtained, the charge form factors squared can be calculated by dividing the differential cross sections with the Mott cross section
| (12) |
where
| (13) |
For high-energy electron scattering off light nuclei, the recoil of the target nucleus must be taken into account. We do this by dividing the differential cross sections by the factor Sic2
| (14) |
where is the mass of the nucleus and is the energy of the incident electrons. Another correction that should be considered is the attraction felt by the electrons, although this effect is not very strong for light nuclei. We do this with the standard method in electron scattering, that is to replace the momentum transfer with the effective momentum transfer
| (15) |
in our calculation, where = 1.07A1/3 and is the mass number of the nucleus.
In numerical calculations, we take as
| (16) |
where is the charge densities that are obtained by folding the point proton densities, which are calculated from the RMF model, with the proton charge density distribution gre1
| (17) |
where = 18.29 fm2 = 0.71 GeV2 ( = 0.197 GeV fm = 1). The corresponding rms charge radius of the proton is = 0.81 fm.
The center-of-mass effect is also taken into account in the calculation. The correction to the binding energy due to the center-of-mass fluctuations is included by subtracting Rein1 , a non-relativistic estimation of the kinetic energy of the center-of-mass, from the total energy. The center-of-mass fluctuations also have effect on the charge form factors. This effect is taken into account by multiplying the form factors with the following factor Rein2
| (18) |
where can be estimated from the kinetic energy of the center-of-mass.
The RMF model has been developed into a standard nuclear structure theory and has been extensively used to describe the properties of the ground and low excited states both for stable and unstable nuclei. The details for the RMF model can be found in many articles such as wal1 ; wal2 ; wal3 ; gam1 ; hor1 ; ma1 ; ren3 ; ren4 ; Sug1 ; Jia1 ; tod1 . We will not redundantly depict them here.
III Numerical results and discussions
We first give the RMF model results. With the NL-SH parameter set, we calculated the single nucleon state energy levels and their occupation probabilities. The numerical results for the 1, 2 and 1 proton states which are involved in our discussions are listed in Table 1. By careful study, it is found from Table 1 that the energy levels and occupation probabilities have two features. The first one is that for each nuclei the energy level of the 1 state is much lower than those of the 2 and 1 states, and this consequently leads to a much greater proton occupation probability of the 1 state than those of the 2 and 1 states. For 26-40Mg, the 1 state occupation probabilities are approximately 0.65, so the proton occupation number in 1 state is nearly 4. Whereas for the 2 and 1 states, the occupation probabilities are less than 0.03, which corresponds to a proton occupation number of less than 0.18. Thus, for the ground states of 26-40Mg the outmost 4 protons will move in the 1 state. For 28-46Si, the 1 state occupation probabilities are approximately 0.95, which corresponds to nearly 6 protons. Whereas for the 2 and the 1 state, the occupation probabilities are less than 0.09 and 0.06, respectively, and the occupation number of protons are also very small, just 0.18 in 2 state and 0.24 in 1. Therefore, the outmost 6 protons in 28-46Si move only in the 1 state. The occupation probabilities are too small for protons to stay in the 2 and 1 states. For 30-48S and 32-56Ar, by the similar analysis, we can also derive that the 1 state are all completely filled. Nevertheless, the 2 and 1 states each is not completely empty both because the total number of protons are more than the lower states can accommodate and because both states each has a relatively large occupation probability.
| nuclide | |||||||
| Mg | 26Mg | -11.165 | -4.022 | -2.526 | 0.65061 | 0.02669 | 0.01807 |
| 28Mg | -13.411 | -6.518 | -5.035 | 0.65068 | 0.02662 | 0.01785 | |
| 30Mg | -15.668 | -8.783 | -7.744 | 0.65064 | 0.02487 | 0.01864 | |
| 32Mg | -17.881 | -10.838 | -10.351 | 0.65089 | 0.02223 | 0.01938 | |
| 34Mg | -19.976 | -12.704 | -12.715 | 0.65140 | 0.01957 | 0.01963 | |
| 36Mg | -22.005 | -14.488 | -15.013 | 0.65172 | 0.01724 | 0.02002 | |
| 38Mg | -23.971 | -16.206 | -17.258 | 0.65183 | 0.01525 | 0.02059 | |
| 40Mg | -25.880 | -17.867 | -19.444 | 0.65178 | 0.01356 | 0.02130 | |
| Si | 28Si | -10.838 | -3.513 | -2.072 | 0.94509 | 0.08339 | 0.04526 |
| 30Si | -13.169 | -5.899 | -4.658 | 0.94651 | 0.07822 | 0.04563 | |
| 32Si | -15.447 | -8.138 | -7.350 | 0.94716 | 0.06952 | 0.04894 | |
| 34Si | -17.650 | -10.269 | -9.914 | 0.94776 | 0.0612 | 0.05212 | |
| 36Si | -19.816 | -12.141 | -12.315 | 0.94964 | 0.05038 | 0.05450 | |
| 38Si | -21.569 | -13.719 | -14.265 | 0.95087 | 0.04362 | 0.05587 | |
| 40Si | -23.466 | -15.375 | -16.393 | 0.95162 | 0.03670 | 0.05807 | |
| 42Si | -25.027 | -16.848 | -18.139 | 0.95208 | 0.03295 | 0.05913 | |
| 44Si | -25.994 | -18.028 | -19.182 | 0.95279 | 0.03373 | 0.05757 | |
| 46Si | -26.740 | -19.034 | -19.958 | 0.95369 | 0.03558 | 0.05519 | |
| S | 30S | -10.337 | -3.288 | -2.069 | 0.98090 | 0.53283 | 0.2657 |
| 32S | -12.624 | -5.551 | -4.542 | 0.98162 | 0.50663 | 0.27762 | |
| 34S | -14.898 | -7.633 | -7.177 | 0.98203 | 0.42434 | 0.31809 | |
| 36S | -17.049 | -9.690 | -9.622 | 0.98231 | 0.36378 | 0.34789 | |
| 38S | -19.155 | -11.448 | -11.933 | 0.98310 | 0.2785 | 0.3892 | |
| 40S | -21.242 | -13.105 | -14.242 | 0.98365 | 0.19231 | 0.43134 | |
| 42S | -23.246 | -14.701 | -16.476 | 0.98388 | 0.12962 | 0.46225 | |
| 44S | -24.948 | -16.174 | -18.362 | 0.98398 | 0.09915 | 0.47724 | |
| 46S | -25.818 | -17.392 | -19.251 | 0.98442 | 0.11707 | 0.46755 | |
| 48S | -26.520 | -18.478 | -19.936 | 0.98490 | 0.14663 | 0.45197 | |
| Ar | 32Ar | -9.862 | -3.055 | -2.189 | 0.98605 | 0.78843 | 0.62985 |
| 34Ar | -12.158 | -5.129 | -4.617 | 0.98662 | 0.74984 | 0.6482 | |
| 36Ar | -14.406 | -7.069 | -7.130 | 0.98700 | 0.67273 | 0.68614 | |
| 38Ar | -16.489 | -9.167 | -9.392 | 0.98722 | 0.64734 | 0.69845 | |
| 40Ar | -18.604 | -10.840 | -11.659 | 0.98802 | 0.55036 | 0.7456 | |
| 42Ar | -20.700 | -12.390 | -13.938 | 0.98893 | 0.43304 | 0.80272 | |
| 44Ar | -22.695 | -13.883 | -16.144 | 0.98977 | 0.33355 | 0.85107 | |
| 46Ar | -24.505 | -15.318 | -18.143 | 0.99044 | 0.26838 | 0.88252 | |
| 48Ar | -25.455 | -16.679 | -19.175 | 0.99021 | 0.29548 | 0.8693 | |
| 50Ar | -26.251 | -17.986 | -20.039 | 0.98984 | 0.34176 | 0.84674 | |
| 52Ar | -27.121 | -19.219 | -21.085 | 0.98949 | 0.36164 | 0.83733 | |
| 54Ar | -28.089 | -20.447 | -22.354 | 0.98907 | 0.35210 | 0.84277 | |
| 56Ar | -29.091 | -21.657 | -23.687 | 0.98864 | 0.33208 | 0.85348 |
The second feature is that for the isotopes with relatively smaller neutron numbers the energy level of the 2 state is lower than that of the 1 state, and with the increase of the neutron number the 2 and 1 state levels both decrease, however the 1 state energy lowers more rapidly than that of the 2 state and, as a result, this leads to the level inversion of the 2 and 1 states for some neutron-rich isotopes away from the stability line. In order to show more clearly the trend of variation of the energy levels of the 2 and 1 states
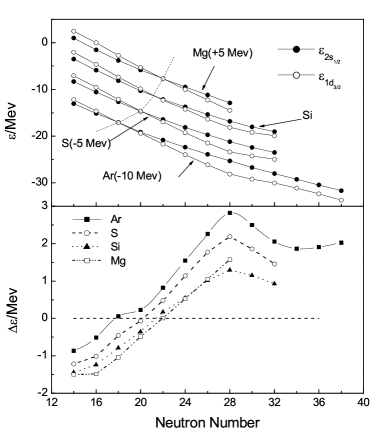

with respect to the increase of the neutron number, we have plotted the 2 and the 1 state energy levels and and the level gap in Figure 1. The upper panel of Figure 1 shows that for each of the four isotones with neutron number the energy level of the 2 state is lower than that of the 1 state, but as the neutron number increases, the 2 and 1 state energy levels both become lower and closer. As the neutron number increases still more, the energy level curves cross each other and the level inversion of the 2 and 1 states occurs. From the lower panel of Figure 1 we can see that for magnesium, silicon and sulphur, the possible level inversion occurs for the isotopes with . For argon, the possible level inversion occurs for the isotopes with . In the following paragraphs, it can be found that both features are very important in accounting for the variation of the charge density distributions of these nuclei.
In addition to the above two features, Figure 1 seems also to reveal that the intersection of the 2 and 1 state level curves has the tendency to move towards the isotopes with relatively smaller neutron numbers with the increase of the proton number, as the dashed curves indicate in the upper and lower panels of the figure. This may mean that for an isotonic chain in the s-d shell region the level inversion of the 2 and 1 states occur more easily for the proton-rich isotones. For instance, on the isotonic chain the nucleus 36Ar may have the 2 and 1 state level inversion, while 30Mg, 32Si, 34S may not.
In Figure 2 and 3 we present the charge density distributions calculated by using the RMF model with the NL-SH parameter set. For the sake of clearness, we did not give all the results of the nuclei listed in Table 1 here. The charge density distribution curves given in Figure 2 and 3 are typical of the charge distribution shapes of the nuclei considered. It can be found from Figure 2 that the charge density distributions of the five magnesium isotopes each shows a noticeable depression around the center, and the shapes of the charge distributions are very similar. These features also hold true for the charge density distributions of the silicon isotopes. While for sulphur and argon isotopes, the results in Figure 3 show different features. For sulphur, the isotopes 42S and 46S each has a significant central charge density depletion, but 30S, 32S and 34S only show a slight depression. The central depression gets more and more noticeable as we go from 30S to 46S, and the charge density distribution around the center varies from nearly flattened to considerably depressed. For the argon isotopes the similar conclusion can also be drown from Figure 3. Thus for sulphur and argon, unlike magnesium and silicon, the charge density distributions are not similar for each isotope. The shapes of the charge distributions show an outstanding change around the center as the neutron number increases.
The similarity of the charge density distributions between the magnesium isotopes and between the silicon isotopes can be explained in terms of the shell theory based on the results in Table 1. In fact, the similarity of the charge density distributions reveals that the isotopes do not have much difference in proton configuration. This is consistent with the results given in Table 1. As has been discussed in the previous paragraphs, the proton configurations for the ground states of the magnesium isotopes should be the same, i.e. . Although the RMF model results show that the level inversion of the 2 and the 1 states may occur for the magnesium isotopes with , their proton configurations keep unaffected, since the 2 and 1 states are empty in the ground states. Since the shape of the wave function of a proton is determined by its orbit, the same proton configurations must correspond to the wave functions of the same shape. Thus, it follows that the shapes of the proton wave functions are the same for the magnesium isotopes. Therefore, it is not curious that the shapes of charge density distributions of the magnesium isotopes are similar, since the charge density distribution of a nucleus is determined by the wave functions of the protons. Likewise, the similarity of the shapes of the charge density distributions for the silicon isotopes can be explained.

Now we turn to the central depletion of the charge density distributions. We know that the radial wave functions of the , , and states have no nodes, so the square of the wave functions each has only one peak. For the state wave function, the peak is always at the center, but for the , and state wave functions, the peaks are always away from the center. Since the state always has the lowest energy, the state will not be empty for any nuclei in the ground states. Therefore, the state will guarantee that no nuclei in the ground states can be

completely hollow in the central region. However, the nuclear central charge depletion is still possible. On the one hand, this is because that the number of the protons which can move in the state is limited, at most 2; and on the other hand, this is because the peaks of the squared wave functions of the , and states are away from the center with up to 12 protons. If the peaks of the squared the wave functions of the , and states overlap or mostly overlap, the center depletion will probably happen. The magnesium and silicon isotopes are this kind of nuclei with the , and states nearly full of protons and the peaks of their squared wave functions overlapping in a large part, and this leads to the charge density depletions at the center.
For sulphur and argon, as we have pointed out in the previous paragraphs that with the increase of the neutron number the charge density distributions of the isotopes vary outstandingly in the central region. Why do the charge distribution shapes of these isotopes around the center get depressed with an increasing neutron number? One reason is that the level inversion of 2 and 1 states occurs as the neutron number increases. As we have known that a particle prefers to move in a lower energy state, so the energy level inversion of 2 and 1 states will greatly influence the occupation number of the outmost protons in the two states. The effect can be clearly seen in Table 1. For sulphur, from 30S to 48S, the proton occupation number of the 2 state decreases from 1.07 to 0.20, while that of the 1 state increases from 1.06 to 1.91. The variations of the proton occupation numbers of the 2 and 1 states for the argon isotopes are similar. Another reason is that the squared wave function of the 2 state has a main peak at the center, whereas the squared wave function peak of the 1 state is away from the center. The occupation of 2 state by protons will enlarge the central charge densities, but the filling of the 1 state by protons will increase the charge densities away from the center. Thus, it is the combination of both the causes that leads to the variations of the charge density distributions for the sulphur and argon isotopes presented in Figure 3.

The above discussion also shows that the variation of the central charge densities, i.e. the depression of the charge densities, is quite a good reveal of the combined effect of the 2 and 1 state level inversion and the behavior of the 2 and the 1 state wave functions at the center. In Figure 4 we present two samples of the charge density differences between two sulphur and between two argon isotopes. The results show that the charge density differences between 32S and 42S and between 36Ar and 48Ar are large enough, especially near the center, to be observable experimentally Cele1 . Therefore, it can be possible to detect the 2 and 1 state level inversion and study the behavior of the wave functions of 2 and 1 states experimentally by measuring the charge density differences between the sulphur isotopes and between the argon isotopes. A feasible and precise way of measuring nuclear charge densities is elastic electron nucleus scattering hof56 ; hof57 ; Don84 ; sic01 . Especially with the application of new technology of measurement and the advent of the new-generation electron-nucleus collider, not only has the measurement become more precise, but the experiments of electron scattering off short-lived nuclei have also become reality. Thus, we believe that with the further development of new experimental technologies in the future it could be possible to study the s-d level inversion by measuring the charge density distributions of the exotic nuclei with elastic electron nucleus scattering experiments.

To provide useful references for experimental research and comparison between theoretical results and experimental data, we give the phase shift analysis calculations of the charge form factors for some candidate sulphur and argon isotopes. Figure 5 is the theoretical charge form factors for the sulphur isotopes 30S, 32S, 34S, 38S, 42S and 46S, and Figure 6 gives the theoretical charge form factors for the argon isotopes 32Ar, 36Ar, 40Ar, 44Ar, 48Ar, 52Ar and 56Ar. It can be seen from both figures that the charge form factors shift upward and inward noticeably as the neutron number increases, and the largest shifts appear near the maximums and minimums. Above all, the shifts of the form factors between the isotopes with and without central charge density depression, for instance those between 42S and 32S, are large enough and can possibly be measured with elastic electron-nucleus scattering on the new generation electron-nucleus collider, and hence the charge density differences can be extracted. In addition to the charge form factors, we further calculated the differential cross section differences , where
| (19) |
The upper panel of Figure 7 shows the differential cross section differences between 34,38,42S and their stable isotope 32S, and the lower panel between 40,48,56Ar and their stable isotope 36Ar. Because of the 2 and 1 state level inversion, the charge density distributions of 38,42S


and 48,56Ar have central depletions, while those of 32S and 36Ar have not. It can be noted from Figure 7 that the differential cross section differences between the isotope with central charge density depression and the stable one without central charge density depression are considerably large and measurable. This also reveals that the charge density differences shown in Figure 4 are observable and can possibly be measured with elastic electron-nucleus scattering experiments. The level inversion of 2 and 1 and central charge density depression can further be investigated by analyzing and comparing the experimental charge density distributions with the theoretical results. In addition, the comparison of the theoretical results with experimental data can be a new test of the effectiveness of the RMF model in describing unstable nuclei.
To guarantee that the theoretical results of electron-nucleus scattering are valid, we have tested our calculations with stable nuclei 32S, 28Si, 24Mg with electron-nucleus scattering experimental data available Sic1 . In the calculations, the charge density distributions for 32S, 28Si, 24Mg are produced by the RMF model with the NL-SH parameter set. Figure 8 is the comparison of the calculated results and the experimental data. It can be found from the figure that the theoretical differential cross sections agree well with the experimental data except some slight discrepancies in the large scattering angle region for incident energy Mev. This shows that the theoretical calculations of the electron-nucleus scattering are reliable, as well as that the RMF model is effective and reliable to stable nuclei.
In addition to elastic electron nucleus scattering, another possible way to investigate the 2 and 1 level inversion by experiment is the pick-up or stripping nuclear reaction experiments. The RMF model calculations show that 43P, with a magic neutron number, may have the 2 and 1 level inversion. If this true, then for the ground and first excited states of 43P the single proton should be in the 1 state and the 2 state, respectively. Then, as a result, the corresponding ground-state and first-excited-state spin and parity of 43P should be and . Thus, if we can measure the spin and parity of 43P and compare them with the ground-state spin and parity of the stable isotope 31P (), perhaps we will know if there exists 1 and 2 energy level inversion in 43P. A possible method might be to conduct pick-up or stripping nuclear reaction and -decay experiments with nuclei 44S and 43P by using the RIB technology in the future. For instance, if we could produce 44S with the RIB technology and bombard 44S with a mono-energetic neutron beam to produce 43P and deuterons (2H) or bombard 44S with a mono-energetic triton (3H) beam to produce 43P and the -particles 4He, the excited energies, spin and parity might be deduced from the measurements of the energy distribution and the angular distribution of deuterons or -particles and also from the angular distributions of the photons resulting from the subsequent -decays of the excited states of 43P.
IV Summary
In summary, we calculated the energy levels, the proton occupation probabilities of the 1, 2 and 1 states for the even-even nuclei 26-40Mg, 28-46Si, 30-48S, 32-56Ar, as well as the charge density distributions of these nuclei by using the RMF model with the NL-SH parameter set. The calculations show that the level inversion of 2 and 1 states may occur for the magnesium, silicon, sulphur, and argon isotopes with more neutrons away from the stability line, and this will consequently leads to a large measurable central depletion to the charge density distributions for the neutron-rich sulphur and argon isotopes. The charge density differences between the isotopes with and without central charge density depletion can reveal not only the level inversion of the 2 and 1 states but also the behavior of the proton wave functions of both states. Electron-nucleus scattering is an excellent way in measuring the nuclear charge density distribution, so it is expected that the 2 and 1 state level inversion and the central charge depletion can possibly investigated experimentally with electron scattering off short-lived nuclei on the new-generation electron-nucleus collider in the future. For comparison and reference, we also calculated the charge form factors and differential cross section differences. In addition to electron-nucleus scattering experiments, if possible, we also propose to explore the possible level inversion of the 2 and 1 states with nuclear reaction 44S(n, d)43P or 44S(3H, )43P with the RIB technology in the future.
Acknowledgments
This work is supported by the National Natural Science Foundation of China (Grand No.11275138, 10975072, and 10675090) and by the Research Fund of Tianjin University of Technology and Education (Grand No. KJYB11-3).
References
- (1) Wimmer K, Kröll T, Krücken R et al. Phys. Rev. Lett. 2010, 105: 252501—252504
-
(2)
http://www.sciencedaily.com/releases/2007/08/070809130011.htm;
http://www.sciencedaily.com/releases/2011/02/110202143800.htm - (3) Otsuka T, Fujimoto R, Utsuno Y et al. Phys. Rev. Lett. 2001, 87: 082502—082509
- (4) Otsuka T, Suzuki T, Fujimoto R et al. Phys. Rev. Lett. 2005, 95: 232502—232509
- (5) Otsuka T, Matsuo T, Abe D. Phys. Rev. Lett. 2006, 97: 162501—162504
- (6) Utsuno Y, Otsuka T, Glasmacher T et al. Phys. Rev. C, 2004, 70: 044307—044314
- (7) Poves A, J. Retamosa. Phys. Lett. B, 1987, 184: 311—315
- (8) Caurier E, Nowacki F, Poves A. Eur. Phys. J. A, 2002, 15: 145—150
- (9) Wilson H A. Phys. Rev. 1946, 69: 538—538
- (10) Siemens P, Bethe H A. Phys. Rev. Lett. 1967, 18: 704—706.
- (11) Swiatecki W J. Phys. Scr. 1983, 28: 349—355
- (12) Decharge J, Berger J F, Girod M et al. Nucl. Phys. A, 2003, 716: 55—86
- (13) Hofstadter R. Rev. Mod. Phys. 1956, 28: 214—254.
- (14) Hofstadter R. Annu. Rev. Nucl. Sci. 1957, 7: 231—316
- (15) Donnelly T W, Sick I. Rev. Mod. Phys. 1984, 56: 461—566
- (16) Sick I. Prog. Part. Nucl. Phys. 2001, 47: 245—318
- (17) Suda T, Maruyama K, Tanihata I. RIKEN Accel. Prog. Rep. 2001, 34: 49—49
- (18) Wakasugi M, Suda T, Yano Y. Nucl. Inst. Meth. A, 2004, 532: 216—223
- (19) Suda T, Wakasugi M. Prog. Part. Nucl. Phys. 2005, 55: 417–425
- (20) Motobayashi T. Recent achievements and perspectives in nuclear physics, in: Proceedings of the Vth Italy CJapan Symposium, Naples, 2005, 563
- (21) Wakasugi M, Emoto T, Furukawa Y et al. Phys. Rev. Lett. 2008, 100: 164801—164804
- (22) Suda T, Wakasugi M, Emotto T et al. Phys. Rev. Lett. 2009, 102: 102501—102504
- (23) An international accelerator facility for beams of ions and antiprotons, GSI report 2002; An international accelerator facility for beams of ions and antiprotons, GSI report 2006. http://www.gsi.de/GSI-Future/cdr/
- (24) Simon H. Nucl. Phys. A, 2007, 787: 102c—109c
- (25) Rubio B, Nilsson T. Nucl. Phys. News, 2006, 16: 5—11
- (26) Abrahamyan S, Ahmed Z, Albataineh H et al. Phys. Rev. Lett. 2012, 108: 112502—112507
- (27) Garrido E, Moya de Guerra E. Nucl. Phys. A, 1999, 650: 387—417; Phys. Lett. B, 2000, 488: 68—74
- (28) Antonov A N, Kadrev D N, Gaidarov M K et al. Phys. Rev. C, 2005, 72: 044307—044317
- (29) Sarriguren P, Gaidarov M K, Moya de Guerra E. Phys. Rev. C, 2007, 76: 044322—044336
- (30) Karataglidis S, Amos K. Phys. Lett. B, 2007, 650: 148—151
- (31) Wang Z, Ren Z. Phys. Rev. C, 2004, 70: 034303—034311; Phys. Rev. C, 2005, 71: 054323—054331
- (32) Roca-Maza X, Centelles M, Salvat F et al. Phys. Rev. C, 2008, 78: 044332—044347; Phys. Rev. C, 2013, 87: 014304—014317
- (33) Wang Z, Ren Z, Fan Y. Phys. Rev. C, 2006, 73: 014610—014619
- (34) Chu Y, Ren Z, Dong T et al. Phys. Rev. C, 2009, 79: 044313—044320
- (35) Ma E, Ma Y, Chen J et al. Chin. Phys. Lett. 2006, 23: 2695—2698
- (36) Walecka J D. Ann. Phys. (N.Y.), 1974, 83: 491—529
- (37) Walecka J D. Phys. Lett. B, 1980, 94: 293—297
- (38) Serot B D, Walecka J D. Adv. Nucl. Phys. 1986, 16: 1—327
- (39) Gambhir Y K, Ring P, Thimet A. Ann. Phys. (N. Y.), 1990, 198: 132—179
- (40) Horowitz C J, Serot B D. Nucl. Phys. A, 1981, 368: 503—528
- (41) Ma Z, Shi H, Chen B. Phys. Rev. C, 1994, 50: 3170—3173
- (42) Ren Z, Mittig W, Sarazin F. Nucl. Phys. A, 1999, 652: 250—270
- (43) Ren Z, Mittig W, Chen B. Ma Z. Phys. Rev. C, 1995, 52: R20—R22
- (44) Sugahara Y, Toki H. Nucl. Phys. A, 1994, 579: 557—572
- (45) Jiang W Z, Zhao Y L. Phys. Lett. B, 2005, 617: 33—39
- (46) Todd-Rutel B G, Piekarewicz J. Phys. Rev. Lett. 2005, 95: 122501—122504
- (47) Yennie D R, Ravenhall D G Wilson R N. Phys. Rev. 1954, 95: 500—512
- (48) Rose M E. Relativistic Electron Theory. New York: Wiley, 1961.
- (49) Bjorken J D Drell S D. Relativistic Quantum Mechanics. New York: McGraw-Hill, 1964.
- (50) Sick I, McCarthy J S. Nucl. Phys. A, 1970, 150: 631—654
- (51) Greiner W, Reinhardt J. Quantum Electrodynamics. Berlin Heidelberg: Springer-Verlag, 1992.
- (52) Reinhard P G, Rufa M, Maruhn J et al. Z. Phys. A, 1986, 323: 13—25
- (53) Reinhard P G. Rep. Prog. Phys. 1989, 52: 439—576
- (54) Celenza L S, Harindranath A, Shakin C M. Phys. Rev. C, 1985, 32: 2173—2175
- (55) Li G C, Yearian M R Sick I. Phys. Rev. C, 1974, 9: 1861—1877