Introducing the Eulalia and new Polana asteroid families: re-assessing primitive asteroid families in the inner Main Belt
Abstract
The so-called Nysa-Polana complex of asteroids is a diverse and widespread group studied by Cellino et al. (2001, 2002) as a dynamically linked asteroid family. It carries the name of two asteroids because it appears to be two overlapping families of different asteroid taxonomies: (44) Nysa is an E-type asteroid with the lowest number in the midst of a predominantly S-type cluster and (142) Polana is a B-type asteroid near the low-albedo B- and C-type cluster. The latter has been shown to be a very important source of primitive Near Earth Asteroids.
Using the data from the Wide-field Infrared Survey Explorer (WISE) mission we have re-analyzed the region around the Nysa-Polana complex in the inner Main Belt, focusing on the low-albedo population. (142) Polana does not appear to be a member of the family of low-albedo asteroids in the Nysa-Polana complex. Rather, the largest is asteroid (495) Eulalia. This asteroid has never before been linked to this complex for an important dynamical reason: it currently has a proper eccentricity slightly below the range of most of the family members. However, its orbit is very close to the 3:1 mean motion resonance with Jupiter and is in a weak secular resonance. We show that its osculating eccentricity varies widely () on short timescales (1 Myr) and the averaged value diffuses (between ) over long timescales (100 Myr). The diffusive orbit, low-albedo, taxonomic similarity and semimajor axis strongly suggests that despite its current proper eccentricity, (495) Eulalia could have recently been at an orbit very central to the family. Hierarchical Clustering Method tests confirm that at an eccentricity of 0.15, (495) Eulalia could be the parent of the family. The “Eulalia family” was formed between 900–1500 Myr ago, and likely resulted from the breakup of a 100–160 km parent body.
There is also compelling evidence for an older and more widespread primitive family in the same region of the asteroid belt parented by asteroid (142) Polana. This family, the “new Polana family”, is more extended in orbital elements, and is older than 2000 Myr.
1 Introduction
1.1 NEO origins
Near-Earth objects (NEOs) are temporary visitors in the region around the terrestrial planets, and significant work has gone into understanding their dynamical behavior and lifetimes. Gladman et al. (2000) and others found that NEOs have short lifetimes, only about 10 Myr on average. Gravitational perturbations from planets, collisions with the terrestrial planets, or loss into the Sun or ejection out of the Solar System limit their average lifetimes. Contrasted with the age of the Solar System, the much shorter NEO lifetimes suggest that today’s NEOs are simply the current incarnation of a constantly re-filled steady-state population. Cratering records (Grieve and Shoemaker 1994; Stöffler and Ryder 2001) find that the impact flux on the terrestrial planets and the Moon has been relatively constant on Gyr timescales, supporting the idea of a steady-state population.
The problem of how to refill NEO space from the seemingly static Main Asteroid belt was answered with the discovery that asteroids are quite mobile (Bottke et al. 2000, 2006). Thermal forces work via the Yarkovsky-effect to change asteroid’s semimajor axes over time (Farinella and Vokrouhlický 1999; Bottke et al. 2000, 2001; see also a review by Bottke et al. 2006). This discovery provided the key piece of physics needed to understand how Main Belt asteroids become NEOs. It had been known that some of the more powerful resonances located near, or in, the Main Asteroid belt could rapidly excite asteroid’s eccentricities, sending them onto planet-crossing orbits leading to their delivery to NEO orbits. The Yarkovsky effect showed how to efficiently get asteroids into these resonances.
The two most important resonances for this delivery process are readily visible in a plot of the asteroid belt. First, the 3:1 mean motion resonance (MMR) with Jupiter is located at heliocentric distance 2.5 AU, and is responsible for the large gap in the asteroid distribution at this semi-major axis. The other is the secular resonance, which occurs when the precession frequency of an asteroid’s longitude of perihelion is equal to the mean precession frequency of Saturn. This resonance is inclination dependent, and is very efficient at delivering low-inclination bodies to NEO orbits. It is the effective inner edge of the asteroid belt at 2.15 AU, and estimated to deliver 37% of all NEOs with (Bottke et al. 2002).
The inner Main Belt (IMB; AU) – bound by these two resonances – is a predominant source of NEOs. Dynamical models predict that 61% of the NEO population comes from there. The majority of the detected IMB asteroids, 4/5 those with , are on low-inclination orbits (). Although a compositional gradient is known to exist in the main belt, with low-albedo, primitive asteroids being predominant in the central (2.5 AU2.8 AU) and the outer asteroid belt (2.8 AU) (Gradie and Tedesco 1978; Mothé-Diniz et al. 2003; Masiero et al. 2011), the IMB contains numerous primitive asteroids (Campins et al. 2010; Gayon-Markt et al. 2012; Masiero et al. 2011). For instance, in a sample of WISE-studied asteroids limited to absolute magnitude , about 1/6 of these bodies in the IMB with measured albedos and sizes have geometric visible albedos , where we use as a simple way to separate low-albedo primitive bodies from more processed or igneous bodies typically with higher albedos.
Recent studies devoted to finding the origin of the primitive NEOs 1999 RQ36, 1999 JU3, and 1996 FG3 (baseline targets of the sample return space missions, OSIRIS-REx, Hayabusa-II, and Marco Polo-R) have found that each of these three bodies are almost certainly (90%) delivered from the IMB following the well-studied dynamical pathway from the Main Belt to NEO-orbits (Campins et al. 2010, 2012; Walsh et al. 2012; Bottke et al. 2000, 2002). Moreover, the current low inclination ( 8∘) orbits of these bodies is indicative of origins on similarly low inclination orbits in the Main Belt. Furthermore, Jenniskens et al. (2010), and Gayon-Markt et al. (2012) have idenified the IMB at low inclination ( 8∘) as the likely source (90%) of the NEO 2008 TC3, the asteroid whose impact produced the Almahata Sitta meteorites.
The work presented here develops the fundamental hypotheses to be tested by planned asteroid sample return missions. Dynamical evolution studies are critical to obtaining the maximum scientific benefit from these missions. Such studies support primary mission objectives to characterize the geologic and dynamic history of the target asteroids and provide critical context for their returned samples. In addition, cosmochemical analyses of e.g., cosmogenic isotope ratios, radionuclide abundances, and nuclear track densities will, in return, provide important constraints on the dynamical evolution of the parent asteroid. This synergy will result in improved understanding of the dynamical pathways that transform IMB objects into NEOs. Furthermore, the OSIRIS-REx mission specifically will provide the first ground-truth assessment of the Yarkovsky effect as it relates to the chemical nature and dynamical state of an individual asteroid. These studies will provide important input to models of the evolution of asteroid families by Yarkovsky drift and delivery to orbital resonances in the IMB.
1.2 Asteroid families and the Nysa-Polana complex
The landscape of the inner Main Belt is dominated by a handful of asteroid families and a diffuse population of “background” objects (see Fig. 1). Among primitive, low-albedo, bodies the largest known family is the low-albedo component of the Nysa-Polana complex, followed by the Erigone family and the Sulamitis family (Nesvorný 2010; Gayon-Markt et al. 2012; Campins et al. 2012). Following an asteroid break-up event, fragments are launched onto orbits that are distinct from, but similar to, the parent body. Specifically, their “proper orbital elements”, roughly the long-term average of their osculating orbital elements, remain linked over time (Zappalà et al. 1990, 1994; Knežević and Milani 2003). Smaller fragments are typically launched with higher velocity, creating a size-dependent spread in orbital elements. Over time the thermal Yarkovsky effect induces a size-dependent drift in semi-major axis, such that smaller bodies drift faster, and thus further, over time than the larger bodies. Therefore families of asteroids are identifiable in two ways: clustering in proper orbital element space, and correlated shapes in size vs. semimajor axis due to size-dependent Yarkovsky drift (see Vokrouhlický et al. 2006a and Bottke et al. 2006).
In the context of NEO-delivery, the size, age and location of an asteroid family are important properties. First, the larger the family, the more potential asteroids that can be delivered. Second, the age of a family determines how far it has spread by the Yarkovsky-effect, where older families can spread further. Finally, the location of the family determines how far its fragments must drift via the Yarkovsky effect to reach a resonance. As we find with the Nysa-Polana complex, a location very near a resonance makes locating the center and determining the age of the family much more difficult.
Not all asteroids are associated with a specific asteroid family. There are a similar amount of “background” objects in this region as there are members of an identified family (Gayon-Markt et al. 2012). This work will, however, focus on asteroid families for a few reasons. First, asteroid families imply a physical correlation between fragments. Thus, we may learn more about an interesting asteroid by studying a much larger and brighter parent body or a suite of associated family members. Second, families’ orbital elements evolve in a relatively simple way - objects drift in semimajor axis at a speed relative to the inverse of their size due to the Yarkovsky effect. This means that a family member that has drifted into a resonance can be followed by equal or smaller-sized members of the same family at the same time - delivery of objects can be correlated temporally.
The specific asteroid family targeted in this work is part of the larger Nysa-Polana complex (NPC) - which appears to be two overlapping asteroid families of different asteroid taxonomies. Their overlapping nature has made detailed study difficult, but now the large database of albedos measured by the WISE mission has made a study of each of the two componenets of the family possible (Masiero et al. 2011; Mainzer et al. 2011).
2 Identification of the Eulalia family
As suggested in works by Zappalà et al. (1995), Cellino et al. (2001, 2002), and Nesvorný (2010) one component of the Nysa-Polana complex consists of low-albedo objects belonging to C- or B-type taxonomies (see also Campins et al. 2010). This work will re-analyze the low-albedo population of the inner Main Belt (at low inclinations and moderate eccentricities) in order to find the center, the parent and the age of any low-albedo families in this region. The first target is the low-albedo component of the Nysa-Polana complex seeking to constrain the center and find the parent of the family, followed by an age estimate.
2.1 Data sources
We have used the calculated albedos from Masiero et al. (2011) to study asteroids observed by the NASA WISE mission in the IMB with low albedo. The WISE mission measured fluxes in 4 wavelengths 3.4, 4.6, 12 and 22 m, and combined with a NEATM thermal model calculated visible albedos, (), and diameters () for over 100,000 Main Belt asteroids. Not all asteroids were observed and not all observed asteroids were detected the same number of times. Therefore errors on albedo and diameter can vary from object to object, and also the sample of objects is not complete at any diameter. However, this work is not aiming to build a definitive list of family members, rather the aims are to better understand the family structure in the inner Main Belt. This database gives accurate measurements for a representative sample of bodies.
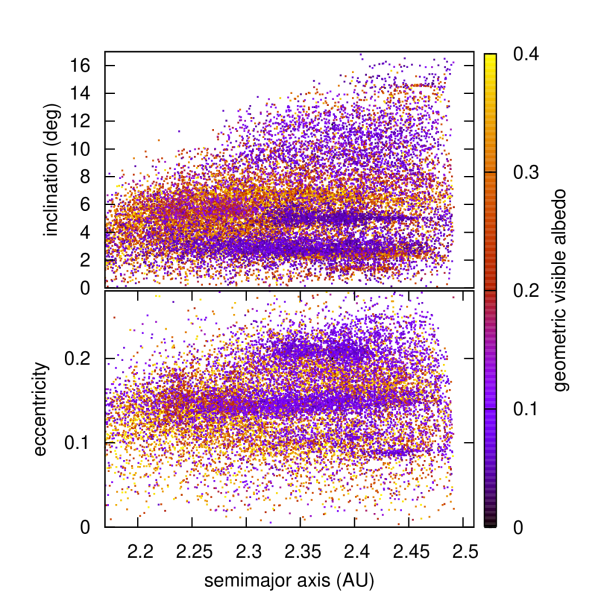
Within this dataset there are 6702 asteroids in the inner Main Belt ( AU AU) that are measured to have albedo, 0.1, by WISE and that also have synthetic proper orbital elements in the database of 318,112 objects as of May 2012 from the AstDyS database http://hamilton.dm.unipi.it/astdys (see also Knežević and Milani 2003). The Nysa-Polana complex (NPC) of asteroids is centered around and . Hence out of the entire IMB, we take a subset with orbital eccentricities with . This area is centered on the NPC, but contains a large portion of the entire IMB. The largest value in this dataset is .
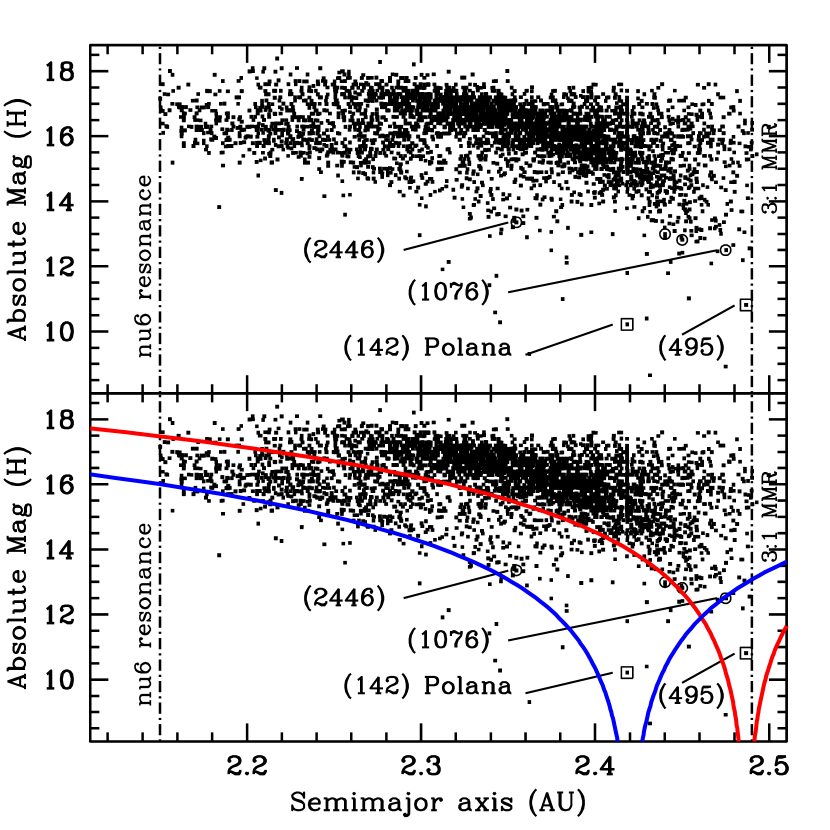
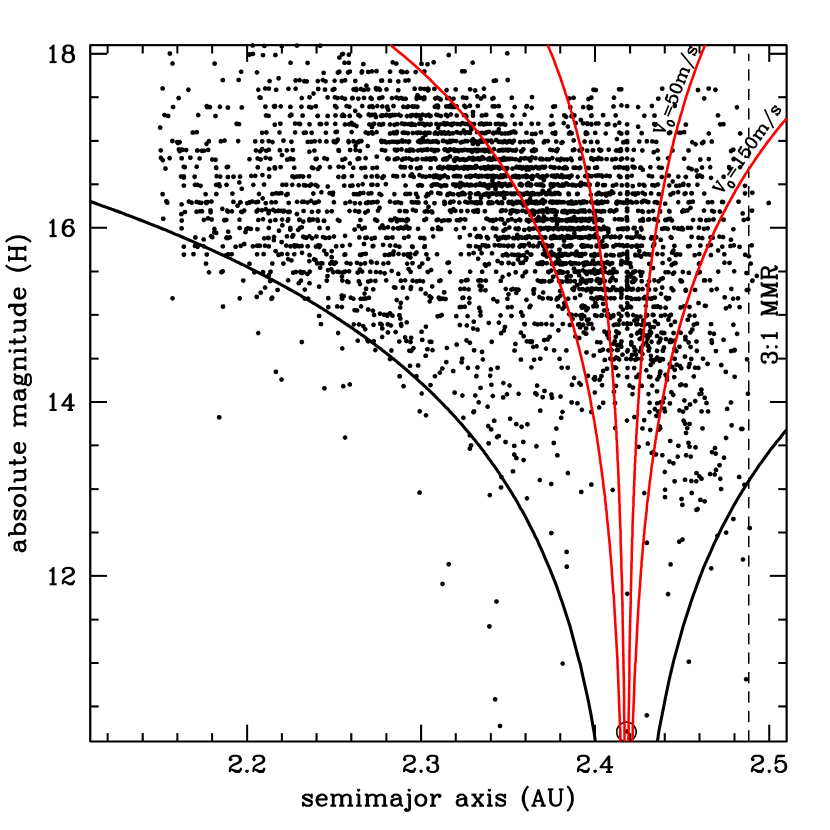
This subset of asteroids has a distinct “V-shape”, or rather half of a V-shape, in the distribution of the absolute magnitude as a function of (Fig. 2; see also Gayon-Markt et al. 2012). This V-shape is typical of asteroid families due to the size dependence of the Yarkovsky effect semimajor axis drift of the family members (see Vokrouhlický et al. 2006a or Bottke et al. 2006). This is expected since the selection of asteroids surrounding the Nysa-Polana complex should be dominated by low-albedo family members that are expected to show a correlation in semimajor axis and absolute magnitude. However, two half V-shapes are visible, indicating the possible presence of two families with asteroids of low albedo in the region. This section is focused on the higher density V-shape structure, with the other analyzed in Section 4.
2.2 The center of the low-albedo component of the Nysa-Polana complex
Identification and analysis of the low-albedo families in the inner Main Asteroid belt pose a few unique problems. First, half of the typical asteroid family “V”-shape is visible in Fig. 2, which suggests that the parent body is very close to the 3:1 mean motion resonance with Jupiter. So close, in fact, that we can assume that at least half of the family was immediately lost to the powerful resonance shortly after the formation of the family (though we do search for family members on the other side of the resonance). Second, the families are very extended, nearly reaching from the 3:1 to the , suggesting an old age and increasing the possibilities of interlopers and confusion in determining family membership. Lastly, there may be more than one family.
Typically, asteroid families are centered on a known parent body as determined by Hierarchical Cluster Method (HCM) fitting. With a known center the next variable to match is the age of the family which is determined by the width of the bounding envelope due to the size-dependent Yarkovsky drift of the asteroids. However, in this case, the shape of the asteroid distribution was not aligned with the previously proposed parent asteroid (142) Polana.
Given the uncertainty in both the center and boundaries of the family, we seek to constrain these one at a time. First, following Vokrouhlický et al. (2006a), the parameter can be used to normalize asteroid distance from a possible family center by their size. The Yarkovsky drift rate is inversely proportional to an asteroid’s diameter, so removing this measureable allows a search for clustering of drift distances from possible asteroid family centers. The parameter is defined
| (1) |
where is the absolute magnitude of the asteroid and is the distance an asteroid has drifted from its initial semimajor axis () over a time at a rate . This formulation of normalizes each asteroid by its size, as the Yarkovsky drift rate is inversely proportional to its size such that . For a simplistic asteroid family formation event where all bodies start with the same and similar spin axes, all family members will have the same , since this value normalizes their drift rate by their size. This is simplified by ignoring both the spin-axis evolution over time and different for each asteroid due to the dispersion of fragments following the family-forming impact.
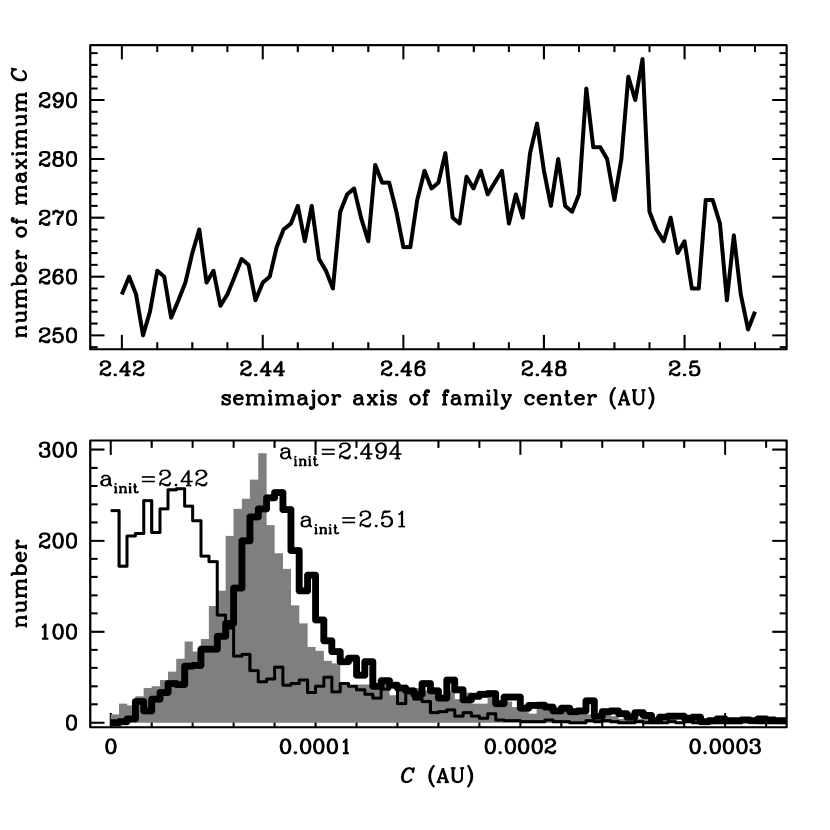
However, the parameter can help search for the center of the family. The distribution of for a given would be flat for a random distribution of asteroids. If a family is present that had correlated values due to their common semimajor axis drift times, then for an near the center of the family there will be a spike in values. Thus, the distribution can be re-calculated at different , seeking the value that provide the tightest clustering of . The search algorithm simply counted the number of asteroids in the maximum bin of AU, and the range of was selected to cover the centers suggested by Fig. 2. As was varied from 2.42–2.51 AU, a clear trend was observed, with a peak at AU (Fig. 3).
2.3 The diffusive orbit of (495) Eulalia
The previous section found the center of the family is best fit at AU, which is very close to the 3:1 MMR with Jupiter nominally located at 2.5 AU. In the selected subset of asteroids there is only one asteroid with AU AU with an absolute magnitude less than 12 and only three with less than 13. We have also searched known asteroids with proper elements in the same region, finding only a few with measured low albedo from IRAS or AKARI (asteroids 877 and 2159, Tedesco et al. 2002, Usui et al. 2011), but both have inclinations around 3.5∘, outside the boundaries of the estimated family. The only asteroid with suitable inclination, semimajor axis and absolute magnitude is (495) Eulalia, with an albedo =0.051 and a diameter km (Masiero et al. 2011). The synthetic proper orbital elements are AU, (Knežević and Milani 2003). The synthetic proper eccentricity of is well below the NPC family average, which is why it was never previously identified as a candidate parent for any of the Nysa-Polana complex.
However, the orbit of (495) Eulalia is extremely close the the 3:1 mean motion resonance (MMR) with Jupiter. The location of this resonance is nominally at 2.5 AU where a body has an orbital period 1/3 that of Jupiter. The location of the resonance is also a function of the small body’s orbital eccentricity, where larger eccentricities expands the location of the resonance in semimajor axis (see Wisdom 1993, 1995). The boundary of the resonance itself is not precise, rather the chaoticity of an orbit increases as it approaches the resonance. Therefore the precise behavior of (495) Eulalia over time cannot be estimated trivially (see also Guillens et al. 2002).
To estimate the chaotic affects on (495) Eulalia due to its location near the 3:1 MMR with Jupiter, its long-term evolution was modeled. Based on the published uncertainties for its current osculating orbital elements, we integrated 1000 clone particles (created from the 6D hyper-ellipsoid in the osculating elements space compatible with today’s orbit). The clones were integrated using the swift_mvs code, which is part of the SWIFT integration package (Levison and Duncan 1994). All 8 planets were included in the simulation, and each clone was treated as a test particle (feeling only the gravity of the planets). The simulations spanned 500 Myr (with some tests to 4 Gyr).
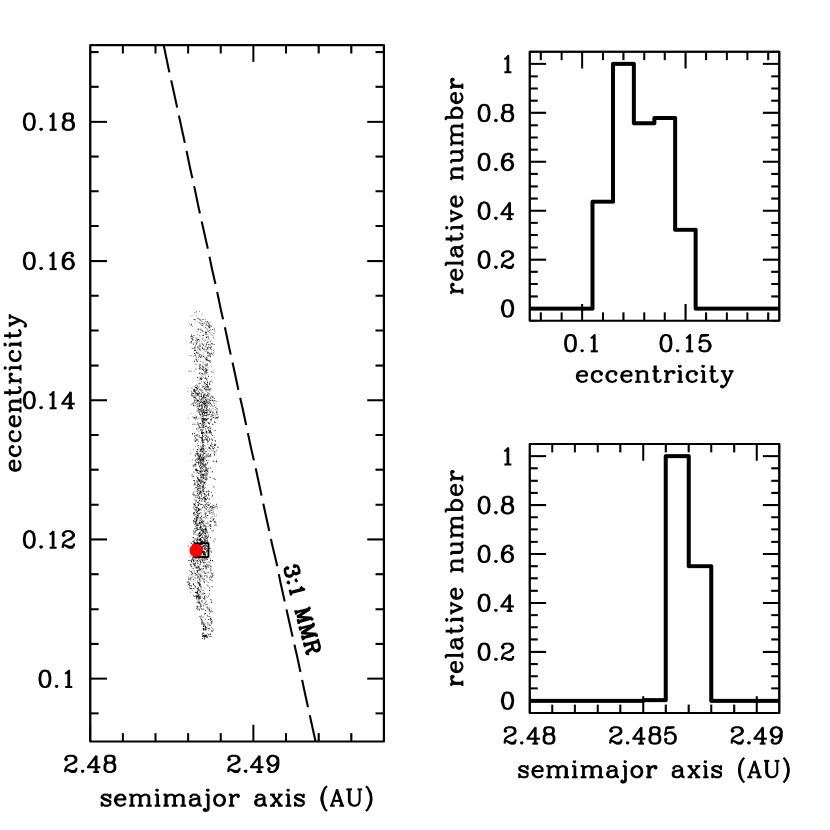
The specific behavior for any single particle at very short timescales (kyr) is dominated by the proximity to the 3:1 mean motion resonance (MMR) with Jupiter via the slow circulation of the principal resonance angle (where is the orbital frequency of an orbit and is the precession frequency of an orbit; see Fig. 4). On longer timescales the interaction with secular resonance results in the corresponding resonance angle librating about with a period of ky (where , and are the proper frequencies associated with the precession of the asteroid, Jupiter and Saturn respectively). This interaction, together with other secular terms of the asteroid’s orbit, is responsible for osculating eccentricity oscillations between 0.06–0.19.
To analyze long-term stability and orbital evolution the entire suite of particles was considered with averaged orbital elements over 10 Myr time periods as a proxy for proper elements. Each particle’s averaged elements was sampled every 10 Myr, creating a distribution mapping the time spent at different orbits - specifically at different eccentricities (Fig. 5). The semimajor axis of the 1000 clones is quite constant with – AU, while the average eccentricity diffuses between =0.11–0.15, with most of its time spent at =0.12. From the limited tests run to 4 Gyr we find some clones are lost to the 3:1 MMR; at 2 Gyr only 30% of the clones are lost and at 4 Gyr only about 60% of the clones are lost. So despite being chaotic, the gravitational-only orbit of (495) Eulalia is surprisingly stable for long timescales.
The role of thermal effects on the dynamics of Eulalia may be important given the putative old age of the family. At km its maximum drift rate over 1 Gyr is around 0.005 AU, which is larger than the diffusion found in semimajor axis in the long timescale integrations above. Also, given its precarious location very near the 3:1 MMR, a drift of 0.005 AU could change its long-term evolution dramatically, including a slightly different orbit at the time of a possible family-forming impact. A more realistic estimate of its potential drift rate depends heavily on its obliquity and various thermal properties. Its rotation rate and obliquity have been estimated at 29.21.0 hr and 88∘ (Binzel 1987). Increasing the accuracy of these measurements and estimating possible Yarkovsky drift scenarios, along with the possible role of the YORP effect and secular spin-orbit resonances, is beyond the scope of this work.
The conclusion of this test is that when searching for family membership using an HCM model, the proper eccentricity of (495) Eulalia should be tested at values between =0.11–0.15, as they are all possible given the asteroid’ s proximity to the 3:1 MMR.

2.4 Hierarchical Clustering Method Family Search around (495) Eulalia
If (495) Eulalia is the parent of a family caused by a collision, the family-forming collision could have happened when the asteroid had any of its allowable orbital eccentricities. Therefore a Hierarchical Clustering Method search for possible family members associated with (495) Eulalia, necessarily needs to be done varying its proper eccentricity111Note that we have also tested and verified family formation during a maximum of the secular eccentricity oscillation..
Family association was tested using the Hierarchical Clustering Method (see Bendjoya and Zappalà 2002 and references therein). HCM searches among asteroid’s proper orbital elements, as it is assumed that proper orbital elements are stable on very long timescales, with the exception of the drift in semimajor axis due to the Yarkovsky affect. The algorithm relies on the “standard metric” of Zappalà et al. (1990, 1995) to calculate a velocity difference between two asteroid orbits. It then connects bodies falling within a cut-off velocity (), where is typically m/s.
However, the region surrounding (495) Eulalia is particularly low-density, presumably due to its location directly adjacent to the 3:1 MMR. Even small Yarkovsky drifts to higher semimajor axis would drive an asteroid directly into the resonance, thus Eulalia presumably lost many of its closest neighbors long ago. The HCM search here relied on the the WISE-surveyed low-albedo asteroids, and has only 6702 objects in the database, as compared to over 100,000 IMB asteroids with synthetic proper elements. So, where typically a m/s is at risk of linking to a substantial fraction of the asteroid belt, here even m/s still only links asteroids with similar orbits. With (495) Eulalia as the parent, with its , HCM tests were run varying between m/s.

The HCM results for =0.14 and =0.15 show the traits of the typical asteroid family behavior, with a sharp jump in asteroid family membership numbers at a specific , followed by a slow increase thereafter (Fig. 6). This is not surprising, as the low-albedo component of the Nysa-Polana complex has a mean eccentricity of =0.152. Neither case, however, shows the characteristic jump in family membership number after exceeding the critical velocity cutoff for the family, as seen in many examples of Vokrouhlický et al. (2006a). It is more similar to the results for the large and old family Eos (Vokrouhlický et al. 2006b). The =0.15 case has the lowest jump in family numbers, at m/s, and thus =0.15 is the favored case.
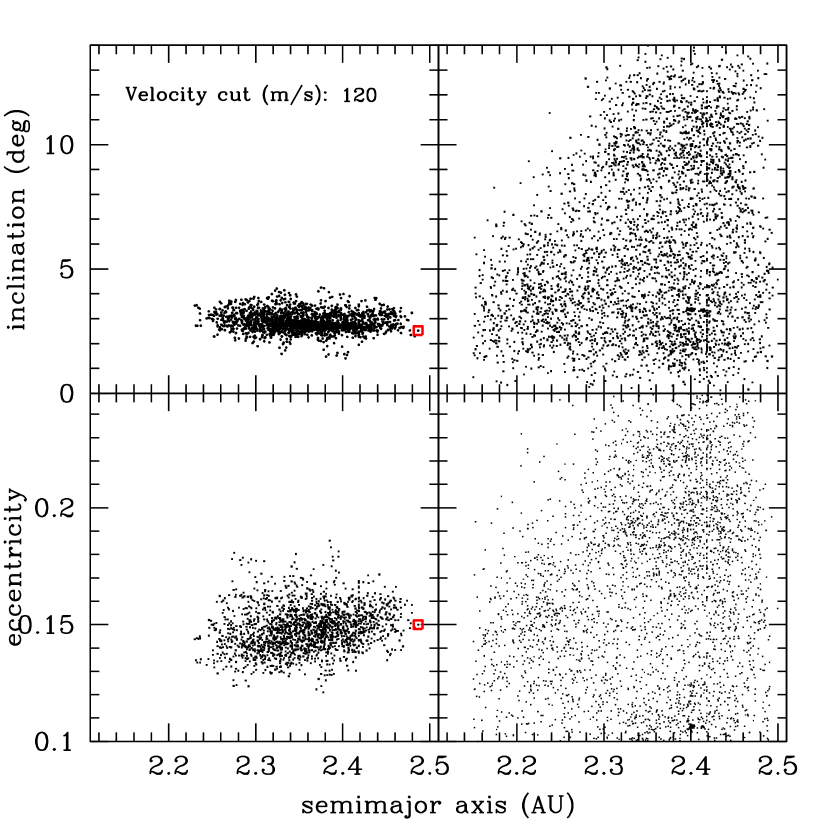
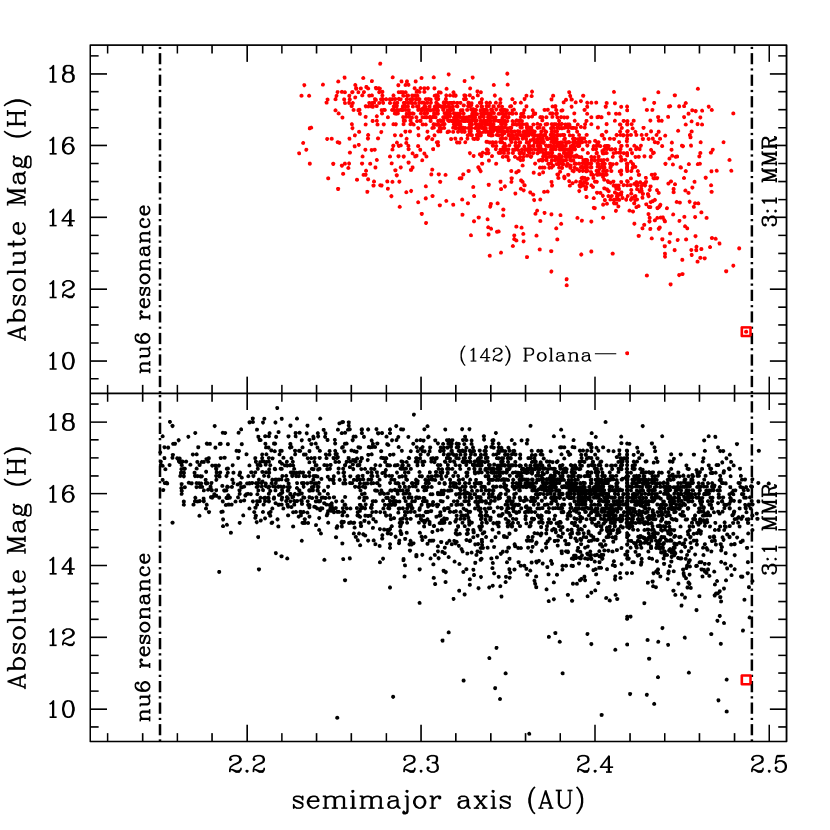
One outcome from the initial HCM results is the inclusion of asteroid (142) Polana in the family at m/s (Figs. 7 and 8). It seems very clear from the results in Fig. 2 that multiple families are overlapping and being selected by the HCM routine. This highlights the problems with differentiating membership between the two families for the bodies within the Yarkovsky envelopes of each. The inclusion of this secondary family will pose problems in later sections when the bounding envelope of the “V-shape” distribution is used to calculate the age of the family. In fact, by estimating the lower bound of the family in vs. space by the Yarkovsky drift curves, we can eliminate numerous interlopers that belong to another family, rather than the low-albedo part of the Nysa-Polana complex.
The slope of the cumulative distribution of absolute magnitude value for the HCM-determined family members is sometimes used to help select viable ranges of from an HCM search. This calculation was performed on the selected family at each increment in (see Fig. 9). This calculation follows Vokrouhlický et al. (2006a), by using the power-law of the form where . The results show no clear trend, and rather a low compared to what is found for some young (100s Myr) families such as Erigone (Vokrouhlický et al. 2006a) and is closer to the entire asteroid belt population with (Ivezić et al. 2001). Young families can have a range of size frequency distributions with slopes sometimes dramatically different than the background population. Over time collisional evolution will change the size frequency distribution eventually driving it to similar values as the background (Morbidelli et al. 2002; Bottke et al. 2005). In this case, where there is no distinction in the size frequency distribution from the background, this property cannot be used to either secure its selection as a family or to make a statement about its age.
We adopt asteroid (495) Eulalia as the parent of the low-albedo component of the Nysa-Polana complex - now referred to as the “Eulalia family”. Its proper semimajor axis at AU is adopted as the center of the family. In the next section we can determine the extent and age of the family by using the members found in this HCM clustering search, and we will use the family as defined by the HCM criteria with m/s, which by visual inspection was preferable to the m/s selection due to larger numbers without increasing the size of the family in , , or .

2.5 Age estimate for the Eulalia family
The age of the family can be estimated by the spreading in semimajor axis of family members over time, which is a function of an asteroid’s size, thermal properties and spin axis (Bottke et al. 2006). The size or absolute magnitude of many main belt asteroids is well measured through the combination of recent WISE results, years of optical surveys such as Sloan Digital Sky Survey (SDSS) and past infrared surveys such as IRAS and WISE (some potentially important biases in the absolute magnitude values are discussed in Section 4.). The thermal properties have been directly measured for only a few asteroids (see Delbó et al. 2007), but have been inferred for populations due to ensemble behavior for asteroid families with a range of ages (Bottke et al. 2006). The evolution of the spin axis of a body is related to its thermal properties and the thermal YORP-effect, and this behavior, though still being investigated, is constrained by asteroid family investigations (Vokrouhlický et al. 2006a; Bottke et al. 2006). Similarly, the initial distribution of fragment orbits following an asteroid impact provides an uncertain initial condition preceeding the family spreading.
Vokrouhlický et al. (2006a) have previously employed a complex fitting routine that simultaneously solves for family age, YORP reorientation timescales and strength, and a size-dependent initial velocity dispersion. Given the large extent of the Eulalia family, that at least half of the family is lost into the 3:1 MMR, and its location overlapping another primitive family, we focus here on the family boundaries in order to estimate family age. A more detailed method of the age determination, solving for YORP reorientation and the initial velocity disperion, will be presented in later works.
The distribution of asteroids was used to locate the center of the family, based on a cluster of similar values. A bounding value for the family can be used to estimate an age for the family, based on the maximum Yarkovsky drift timescales. Using the value we find,
| (2) |
where , and with being the maximum Yarkovsky drift rate for a diameter ignoring any spin axis variation. It will be useful to use , and combine them so that
| (3) |
where is AU/Myr for a 5 km asteroid in the inner Main Belt with a density of 2.5 g cm-3and thermal conductivity W m-1 K-1 (taken from Bottke et al. 2006). The formulation uses a km, so the nominal drift rate (in AU/Myr) is,
| (4) |
For an with km and a density of 1 g cm-3 the rate is AU/Myr. There is no published measurement of the density of any family members, so we selected our nominal value of 1 g cm-3 for simplicity and the few measurements of C-type asteroids clustering around this value; with (379) Huenna at g cm-3 (Marchis et al. 2008), and (253) Mathilde with g cm-3 (Yeomans et al. 1997) are two with accurate estimates. The drift rate is inversely proportional to the density, and thus this estimate can be a systematic source of error in our calculations. Now we can estimate the age based on the estimates for by,
| (5) |
with an albedo 0.052 for (495) Eulalia.
To calculate the age of the family we are interested in the boundary of the distribution, or the envelope of Yarkovsky lines for as a function of . We devised a fitting routine whereby the value of was varied and the ratio of asteroids with AU was compared with AU. A strong contrast in numbers indicates the boundary of the family has been reached. This was done for all the members selected by the HCM routine for m/s in steps of AU (where these bin sizes were selected via trial and error testing). Due to the increasing number of asteroids at greater (smaller sizes), we measured this ratio for three different size ranges, . The average of the three ratios finds two peaks, at AU and AU (Fig. 10). The smaller value of AU is favored by the smaller asteroids, while AU is favored by the larger asteroids. This could be a real effect caused by thermal effects acting differently at small sizes, or simply confusion caused by interlopers.
The best fit boundaries are plotted in Figs. 11 and 12. Alone, these values of would correspond to ages of and Myr. However, the calculation does not yet account for the initial fragment semimajor axis distribution produced immediately after the family forming event.
The size-dependent velocity dispersion of the fragments due to the asteroid impact creates a distribution of preceeding any Yarkovsky drift. Again, following Vokrouhlický et al. (2006a), we can estimate size-dependent for collision outcomes with different velocity dispersions, where here we calculate another as the distance from the center of the family,
| (6) |
where is the mean motion of the target asteroid and is the transverse velocity of the fragment and simply denotes other eccentricity-dependent terms. We can use a very idealized equation,
| (7) |
Vokrouhlický et al. (2006a) uses , where is the standard deviation of a directional component of a velocity field following an asteroid disruption. The can be equated to in this simple estimation, and can be equated very roughly to the escape speed at the surface of the target body, which scales linearly with diameter. So that,
| (8) |
and using a mean motion for the target body, Eulalia in this case, the can be calculated as a function of fragment size.
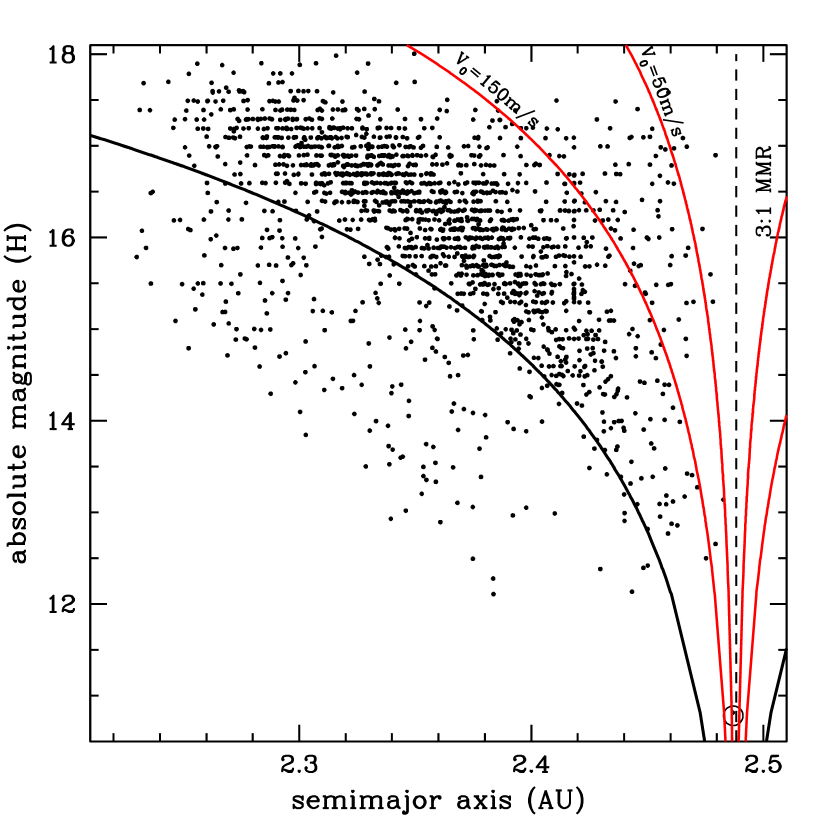
We have not yet estimated the total mass in the family or estimated the size of the parent of the family. This calculation is made later in Section 3.1, finding a parent body km. That is used as a guide here since the velocity dispersion should be similar to the parent body escape speed that scales linearly with the parent body size. So we include calculations of the estimated size-dependent due to the initial collision event with =50 m/s and =150 m/s (see the red lines in Figs. 11 and 12). Since the from the initial fragment displacement follows the same relationship as the Yarkovsky drift, we can relate the initial fragment distribution in terms of , and simply subtract off this and re-calculate the age from the total Yarkovsky drift. These distributions correspond to a maximum initial semimajor axis AU and AU, such that the best-fit bounding value of AU, would simply be a AU and AU, which correspond to ages of and Myr. While for AU, would correspond to total ages of and Myr.
The relationship between these calculations are shown in Fig. 12, where the black line is the due to Yarkovsky drift from a center at AU with an age of 1160 Myr. The red lines are the due to the fragment velocity dispersion of 50 and 150 m/s. From these calculations we find the age of the family between 900–1500 Myr.
One important caveat in these simplistic age calculations is the role of obliquity changes due to the Yarkovsky-O’Keefe-Radzievskii-Paddack (YORP) effect (Rubincam 2000; Vokrouhlický and Čapek 2002; Bottke et al. 2002). The YORP effect acts by the asymmetrical reflection and re-emission of thermal radiation to affect the rotation state of an irregularly shaped body. When the YORP effect changes the obliquity of an asteroid, the semimajor axis drift rate due to the Yarkovsky effect will also change. The preferred spin states are those that maximize the Yarokovsky drift (0∘ and 180∘), such that family members with initial obliquities resulting in slow Yarkovsky drift are expected to evolve over time to a faster-drifting state. Large uncertainty exists in modeling the evolution of the YORP re-orientation of obliquities due to the YORP evolution of the rotation rate as well and complications at very high and very low spin rates. An estimate of re-orientation timescales is 300–600 Myr for 5 km objects (Vokrouhlický and Čapek 2002; Čapek and Vokrouhlický 2004). Objects well above this size are then likely to have not experienced a full YORP reorientation since the formation of the family. Any dramatic effects due to YORP cycles for this family would therefore not be significant for asteroids larger than to be conservative.
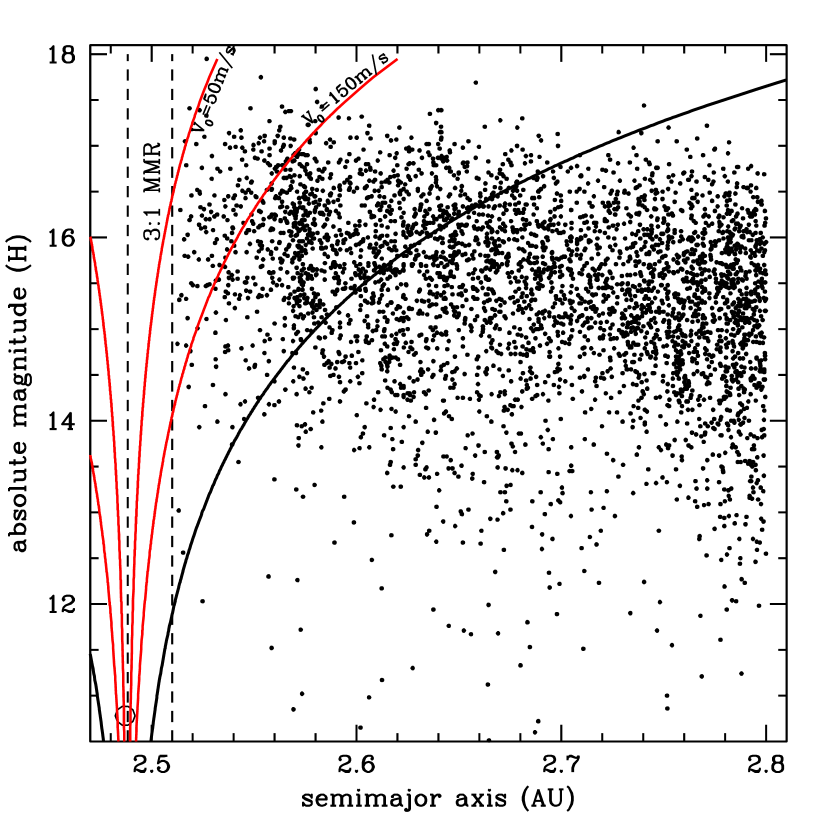
One possible tracer of would be family members reaching the other side of the 3:1 resonance (for AU). Given the center of the family and the Yarkovsky drift boundaries from the asteroids with AU, we selected the subset of asteroids with AU that would host any family members. There is no clear evidence of a high density of asteroids around the Yarkovsky lines (Fig. 13), confirmed by the distribution of values around an AU. The lack of existence of, or inability to detect, members on the far side of the 3:1 MMR limits the for the fragment distribution. Very large velocity distributions would place many asteroids on orbits beyond the 3:1 MMR, where they could be observable today. For a conservative boundary of the 3:1 MMR of AU at the relevant eccentricities of a m/s would only place some objects of beyond the resonance, while at m/s only some with . While a substantial mass of the family can be contained in bodies of these sizes and smaller, it also implies a large fraction of the mass never made it past the 3:1 MMR. Thus the estimates used in this work, presented to bracket possible ranges of fragment velocity dispersion, also are consistent with the lack of a clear family signature across the 3:1 MMR.


3 Properties of the Eulalia family members
3.1 The SFD and total mass of the Eulalia family
The size frequency distribution of the family can be estimated from the objects selected in the HCM routine, using the power-law of the form . In Section 2.4 a for only the range of was compared to the background, now we consider the size distribution of all prospective family members, using it to estimate the mass of the entire family.
Simply summing the mass of all observed bodies is a quick estimate of the original parent’s size. However, we are only now detecting half of the family, as the other half were launched into, or very quickly entered, the 3:1 MMR and were lost. There is another factor of two, as only bodies launched to smaller semimajor axis survive the initial displacement from the parent, but then any asteroid with an initial outward Yarkovsky drift will very quickly drift into the 3:1 MMR. Similarly, the dataset is missing objects as the WISE survey is not complete, even at large sizes. A comparison of the WISE survey and databse of known asteroids, for large asteroids in the inner Main Belt, found that it detected 80% of all asteroids with , with that fraction dropping to 55% for . Combined with the previous family scaling factor of 4, scaling by 5 to account for the 80% WISE detection efficiency is closer, though this scaling factor should grow at smaller sizes. Finally, the numbers are scaled at each size according to the WISE detection efficiency. It should be noted that collisional evolution could play a major role in altering the family SFD over time, and this should be considered in future models.
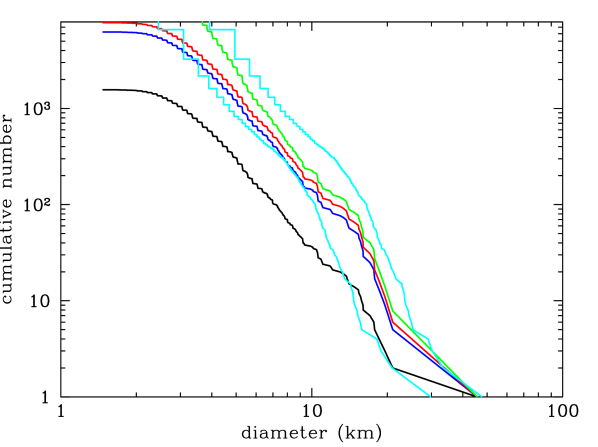
The integrated size for the selected family members from the m/s HCM routine is km (the black line in Fig. 14). Note that this includes a limiting vs. criteria to eliminate interlopers. When a factor of 4 for the loss of 3/4 of the family to the 3:1 MMR is accounted for (except the largest body, parent Eulalia) the estimate increases to km (blue line in Fig. 14). Finally, a full factor of 5, accounting for the survey limitations, equals a body with km (red line in Fig. 14). The final correction for size-dependent WISE detection efficiency increases the size to km (green line in Fig. 14).
Since only the largest bodies are detected with very high efficiency, an alternative method to estimate total family mass is needed. An alternative method relies on the size frequency distributions for asteroid families derived from Smoothed Particle Hydrodynamics (SPH) simulations of catastrophic asteroid impacts that are coupled to -body gravitational simulations of their reaccumulation (Durda et al. 2007; Benavidez et al. 2012). This method matches size frequency distributions between simulations and observations at large fragment sizes, and then uses the simulation to estimate how much unobservable material may also belong to the family. One SPH and -Body asteroid collision simulation was selected from the suite of simulations by Benavidez et al. (2012). It used a 100 km basalt rubble pile target with a 3 km/s 34 km impactor hitting at a 15∘ angle. The largest remnant in the simulation outcome is km, slightly smaller than (495) Eulalia ( km). However, the shape/slope of the curve is a reasonable match for the Eulalia family. These simulations are based on a 100 km target, and a match in slope must be coupled with a horizontal shift to scale for the original parent size. Shifting the size distribution by a factor of 1.6 is equivalent to increasing the target body size by the same factor, thereby creating a size frequency distribution for a 160 km target. Given the relative close match in both slope and horizontal scaling, this suggests that the simple integrated size estimate of km is close to the SPH progenitor target scaled to km, and the latter serves as a resonable upperbound given the uncertainties with this particular family.
3.2 Observed physical properties
The WISE mission facilitated the analysis of this family while also providing some physical characterization of its constituents. Other public databases and catalogs of observations are available to assess the physical properties of the family members. Here we summarize the available data.
3.2.1 Albedo distribution
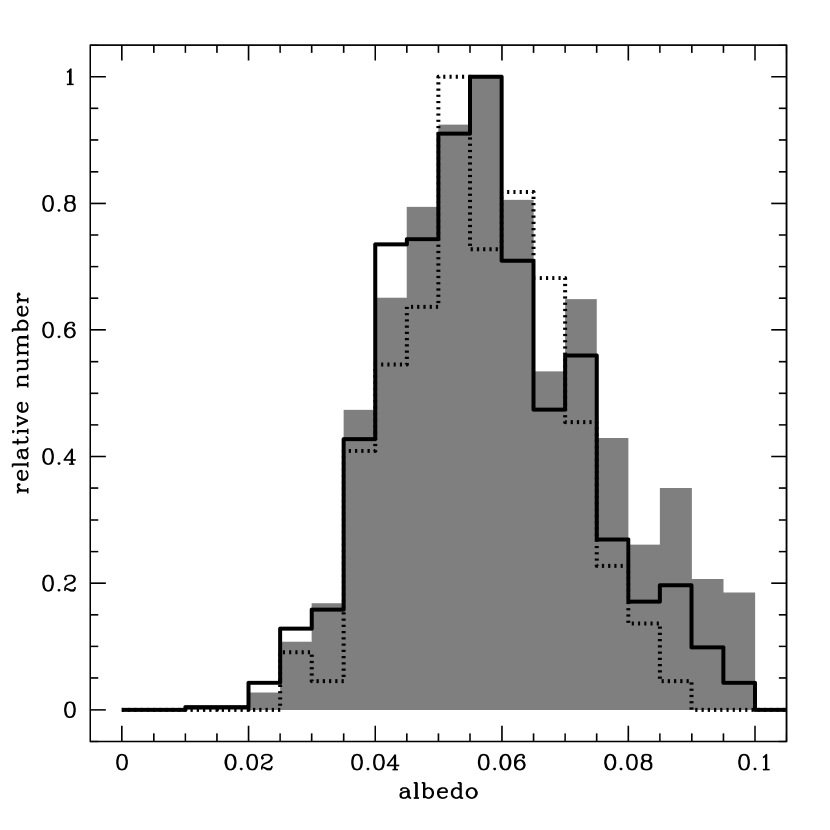
From the WISE mission, there are calculated albedos for each object in the dataset used here. We compare the albedo distribution of the bodies found by the HCM routine for m/s, with the AU boundaries.
We find only a slightly tighter cluster of albedo values in this sample compared to the background (Fig. 15). Given that the entire sample is less than , and typical formal errors in albedo measured by WISE are 0.008 for and 0.018 for the entire sample, a clear cluster in albedo was unlikely. The bulk of the asteroids included in the family are small objects, the distribution may be dominated by objects with larger errors in their measurement due to their small sizes. The 128 objects with show no clear distinction from the entire sample of 1563 selected for these boundaries of the family (Fig. 15). Pravec et al. (2012) found that there is divergence between values found in the MPC database and those measured through an observational campaign, where the MPC values are systematically too small, reaching a maximum mean offset of -0.4 to -0.5 around . This would lead to albedo estimates that are slightly too large and becomes significant and systematic at above 10. The WISE calculated albedos relied on the values in the MPC database, and this therefore could account for a source of error as well.
3.2.2 SDSS colors
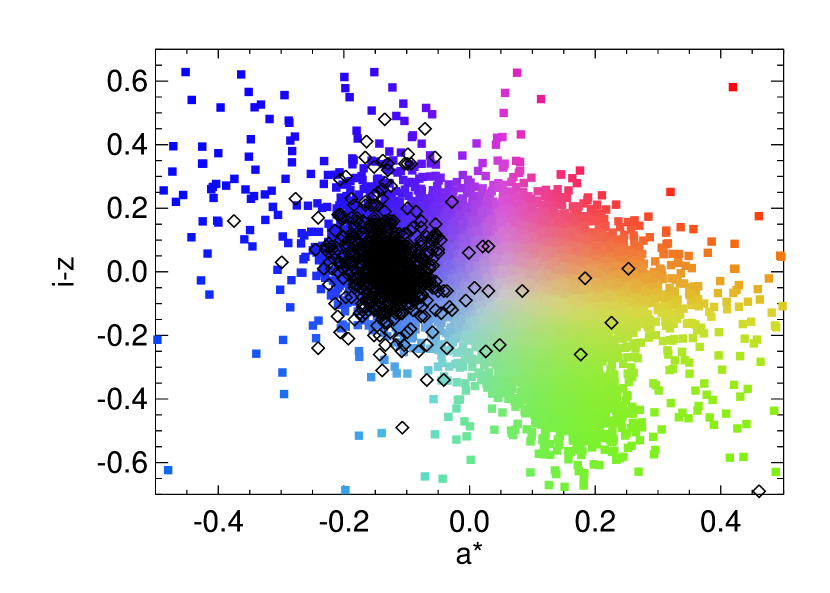
The Sloan Digital Sky Survey (SDSS) observed 471,000 moving objects, for which 220,000 observations were matched to 104,000 different asteroids. The photometry was done in 5 wavelengths and is a valuable tool for establishing taxonomic relationships for large groups of asteroids. The five wavelengths can be combined in numerous ways in order to capture the many possible features found in visible spectra of different asteroid types, but a common method is to compare the colors as a function of (where the filter is centered at 769 nm, the at 925 nm and is the derived first principal component for the distribution of asteroid colors in the SDSS vs. color-color diagram). The former measures the depth of the 1 micron silicate absorption bands mainly due to olivines and pyroxenes, the latter is a proxy for the slope of the spectra (see Fig 3. in Parker et al. 2008). In this space, primitive asteroids of the C- and B-types are typically found with negative slope ().
Here we matched 668 asteroids from selected family bounded by the AU that were also measured by SDSS, and have plotted them on the same axes and color scheme as Parker et al. (2008). As expected, the family is tightly clustered in the region dominated by primitive asteroids (Fig. 16). Without more significant quantitative analysis, it is clear that cluster is actually much tighter than that found for all primitive bodies. However, it is also clear that the cluster is not tight enough to use SDSS colors as a tool to differentiate members from different family associations.
3.2.3 Known Spectra
Asteroid (495) Eulalia was observed on 11 June 2007 at the NASA IRTF with the SpeX instrument between 0.7–2.5 microns (Fieber-Beyer et al. 2008; Fieber-Beyer 2011). There are no clear features for the (495) Eulalia spectral reflectance, with only a minimal upturn in the spectra beyond 2.0 microns (Fig. 17). As the parent of the family this spectra is potentially valuable in finding differences between members of it and the neighboring background. However, flat and featureless spectra are somewhat common for low-albedo objects, which does not aid the determination of family membership for an asteroid with unknown affiliation.
There exists numerous databases to search for spectra of other family members, and two visible spectra (asteroids 1076 and 2509) were found among the Small Main-belt Asteroid Spectroscopic Survey (SMASS; Xu et al. 1995, 1996) and two (asteroids 495 and 3999) in the second phase of that survey (SMASSII; Bus and Binzel 2002). An additional two objects found in the family using the AU boundaries (see Fig. 11) were observed in SMASS database (asteroids 1768 and 2809). No objects were found in the S3OS2 database (Lazzaro et al. 2004) or in the PDS release of multiple IRTF surveys (Bus 2011).
The data in longer, near-IR, wavelengths is even more sparse. As mentioned above (495) Eulalia, was observed with the IRTF SpeX instrument as part of a campaign to study objects near the 3:1 MMR. As part of the wider asteroid survey, the MIT-UH-IRTF Joint Campaign for NEO Reconnaissance (http://smass.mit.edu/), there are near-infrared observations of asteroids (1076) Viola and (1768) Appenzella. (1076) Viola, which belongs to the Eulalia family, is plotted with (495) Eulalia (Fig. 17) and shows similar morphology throughout, in particular they have a similar slope beyond 2.0 microns. Asteroid (1768) Appenzella is within the Yarkovsky boundaries for both families, and is thus plotted alone. It shows an upturn starting around 1.0 micron, with a much shallower slope than found for (142) Polana (discussed below).

4 Discussion
An important aspect to the analysis of the Eulalia family is the possibility of a larger, older family with similar orbits and similar low albedo. Here we investigate and characterize this proposed family with some of the tools used above. This family is even more extended and diffuse and much of the analysis is beyond the scope of this current work.
4.1 The “new Polana” family
Beyond the clear correlation of the asteroids in the Eulalia family as seen in Fig. 2 and analyzed in the previous sections, there appears to be a possible second family in the same dataset. The lack of asteroids with 2.3 AU and 14 is clear and defies even the expected dropoff in the number of asteroids with decreasing semimajor axis due to the inclination-dependent effects of the resonance and eccentricity limits of Mars crossing orbits. The high density of objects with and AU AU has the characteristic “ear” of an asteroid family seen at higher semimajor axis for the Eulalia family due to the Yarkovsky semimajor axis drift.
This possible family suffers from the same, and even amplified, difficulties found in analyzing the Eulalia family; a center near a powerful resonance, overlapping with another family and possibly a very old age. In many tests below we will remove the Eulalia family from the data set (using previously defined boundaries) in an attempt to measure only the possible background family.
4.1.1 HCM of the background family
Given the very diffuse nature of this possible family with an unknown parent, we reverse the procedure used before, and begin with an HCM test to make sure there is, in fact, an orbital correlation among the high density region of asteroids. Given the very low density of large objects, this HCM test was centered on the heart of the visible “ear” of the family located at AU AU and . We simply selected a few objects in this orbital range and ran the HCM at varying checking to see whether any clump would acquire the characteristic shape in vs. space.
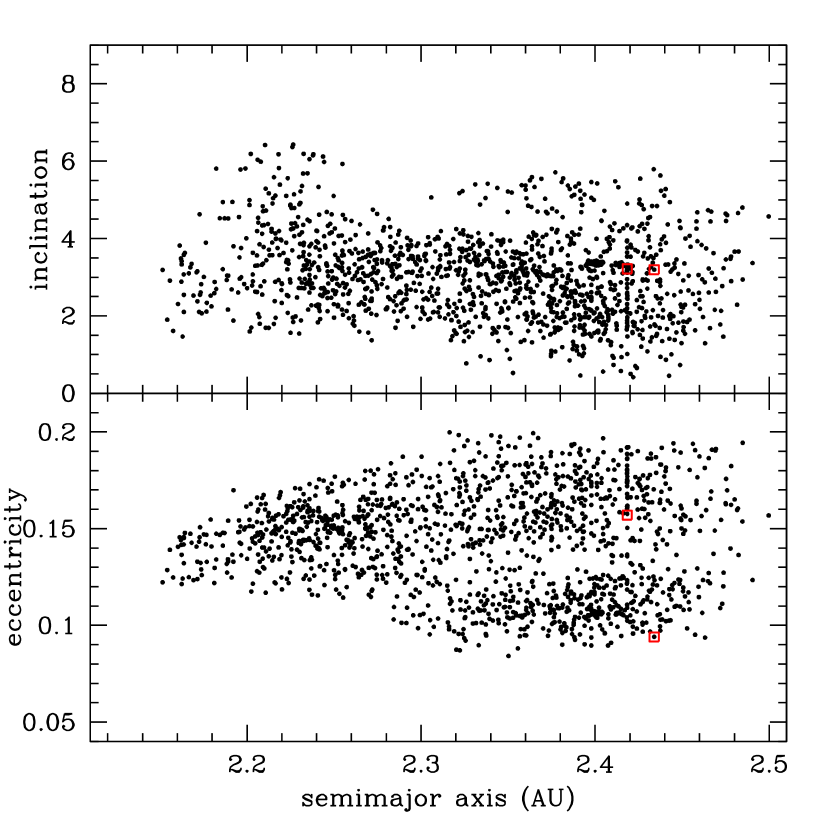
The first test was done with asteroid (2446) Lunacharsky. This asteroid has proper orbital elements of AU, , , and is also one of the few in this region with published visible and near infrared spectra. The HCM results for this body show that there is a highly diffuse and extended association with few family members found below a velocity cutoff of 150 m/s (Fig. 18, bottom). However, the association linked by HCM at 180 m/s and larger shows the distinct signs in the vs. space of a correlated family and the family size increases quickly.
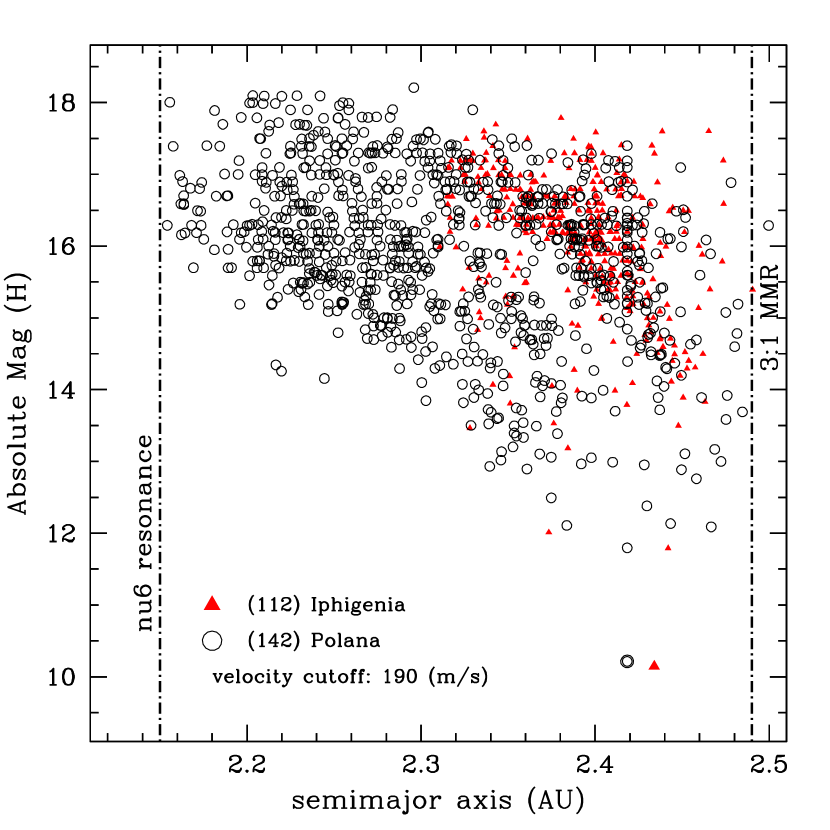
The largest bodies linked to this association are asteroids (142) Polana and (112) Iphigenia with proper elements AU, , and AU, , respectively (Iphegenia is linked at 180 m/s and Polana at 190 m/s). The orbital element distribution of the selected asteroids is quite large in eccentricity, spanning , but more tightly clustered in inclination between . Each of these large asteroids are in distinct clusters determined by their eccentricity, where (142) Polana is in the midst of the high eccentricity grouping and (112) Iphigenia with the smaller low eccentricity grouping (Fig. 19).

4.1.2 The center and age of the new Polana family
We focus on (142) Polana and (112) Iphigenia due to their size and the suggestions from the vs. plot that they are near the center of the family. Differentiating them is difficult due to these similarities, other than (142) Polana being embedded in a larger and denser grouping in eccentricity. When these groups are separated and plotted as vs. it is clear that (142) Polana is associated with the extended family structure (Fig. 20). Meanwhile (112) Iphigenia is associated with objects with larger and larger , that are near the highest-density region of the Eulalia family. It is possible that if the Eulalia family was linked with a larger in the HCM routine that many of these objects would be added to the Eulalia family.
Thus, the extended family here appears to be associated with asteroid (142) Polana, and we use its proper semimajor axis AU as the nominal center of the family. Using the same fitting routine as before, we then measure a best-fit at AU (Fig. 21). This fit was substantially easier due to the dramatic density fall-off, and the measured best-fit value is nearly twice as large as for the Eulalia family. This directly correlates to Myr, not accounting for the initial velocity dispersion of the fragments following the collision. We can use the same initial velocity dispersions of m/s and m/s, despite not having a solid estimate of parent body size, which puts the age range of the Polana family at 2000–2500 Myr. However, uncertainty about YORP reorientation of spin axes adds age uncertainty which becomes increasingly important at increasingly larger asteroid sizes for older families. This adds substantial uncertainty to the upper boundary of this age estimate, and the conservative estimate is simply an age greater than 2000 Myr.
4.1.3 Significance test of “new Polana” shape
Given the low density of asteroids in the WISE dataset at low ( AU) and (), it is fair to question if the characteristic shape of the new Polana family is not simply a statistical fluke caused by decreasing asteroid density near the secular resonance. Specificially, if the gaping hole in the sample with AU and is due simply to statistical flucuation, then the boundary of the new Polana Yarkovsky “V-shape” may simply be an artifact and not the edge of an asteroid family.
A simple test of the significance of this was to take the entire distribution of asteroids in our dataset and randomly re-distribute them while preserving the orbital and size distributions. More simply, the values of , , and were each separately randomized 1000 times. A test of number of asteroids with AU and was performed for each. The WISE dataset has only 4 asteroids in this region, while the average number found in this region was 15.7, and the smallest number was 5 for all 1000 iterations (Fig. 22).
This test did not specifically test if the V-shape was a fluke, but rather whether the stark absence of asteroids at lower was random. Finding that it is clearly significant suggests that the density contrast seen is related to actual correlated family and supports the existence of the new Polana family.
One alternative explanation for the lack of large low-albedo asteroids inside of 2.3 AU is simply that this is the innermost edge to C-type asteroids in the asteroid belt. It is long known that primitive bodies predominate in the outer asteroid belt (Gradie and Tedesco 1982), and some recent work has investigated various means to “implant” primitive bodies in the asteroid belt from more distant regions of the Solar System (Levison et al. 2009; Walsh et al. 2011). Levison et al. (2009) focus on capture of D- and P-type asteroids during the Solar System instability associated with the Late Heavy Bombardment, and they find a good match to the distribution of these taxonomic classes, with the inner edge of both populations around 2.6 AU. Walsh et al. (2011) focused on the origin of the C-class populations that are possibly scattered into the asteroid belt much earlier in Solar System history. This work shows a steep decline in primitive asteroid numbers at decreasing semimajor axis, and theoretically could be responsible for the absence of large primitive bodies inside of 2.3 AU.

4.2 Spectral hints at two families
The albedo distribution, SDSS colors and visible spectra of objects in the family regions are very similar and not useful to distinguish between families. Therefore any available spectra - especially in the near-infrared - may be able to differentiate family membership.
There is publised near-IR spectra for one asteroid, (2446) Lunacharsky (de León et al. 2012), that could be a member of the proposed Polana family, and it is plotted with (142) Polana, the candidate parent (Fig. 17, also see Fig. 4 in de León et al. 2012). Both objects show similar positive slopes beyond 1.0–1.2 micron, similar negative slopes in the visible and generally very similar morphologies.
Asteroid (495) Eulalia shows no clear feature at 1.0 or 1.2 micron in contrast to (142) Polana. There is also a clear slope difference between the two family parents beyond 1.0 micron, which has recently been studied as a diagnostic tool by de León et al. (2010) and Ziffer et al. (2011) to differentiate primitive asteroids with otherwise very similar featureless visible spectra. The hint of distinction between family parents, including additional candidate family members, is tantalizing for the possibility that near-infrared spectra could distinguish membership between the two families for the numerous smaller bodies that fall within the Yarkovsky boundaries of both. Similarly, this is enticing as a possible tool to distinguish a possible origin for primitive NEOs that have likely originated in this region of the asteroid belt, especially future space-mission targets (for example, see panel d of Figure 17 that displays the spectrum for NEO 1999 RQ36, the baseline target for NASA’s OSIRIS-REx sample return mission).
5 Conclusions and future work
The structure and past evolution of the families in the inner Main Belt are critically important in order to understand the history and evolution of the asteroid belt as well as the delivery of asteroids to NEO orbits. We have found that the primitive population in the inner Main Belt is dominated by a few very old and large families. The low-albedo component of the Nysa-Polana complex is an asteroid family parented by asteroid (495) Eulalia. The family’s age is between 900–1500 Myr, and the parent body had a size between 100–165 km. We have also found evidence for the existence of an older and larger family centered on (142) Polana, dubbed here the “new Polana” family. This family is parented by (142) Polana and formed more than 2000 Myr ago.
In light of this work, it appears that the major contributors of primtive NEOs could be the Eulalia and new Polana family. Our dataset is limited to , and therefore we cannot directly observe how the smallest members () of the family are behaving. We can, however, extrapolate based on the Yarkovsky curves, and estimate the value where the Yarkovsky curve crosses a major resonance. Asteroids with a larger can reach that resonance by simple Yarkovsky drift, while those with smaller cannot. This method ignores complications due to YORP cycles, or other effects such as collisions, that may have a different size-dependence than the Yarkovsky effect.
In particular, we are interested in where the curves cross the resonance, as it is efficient at delivering NEOs. The new Polana family, being older, is delivering asteroids up to , while the Eulalia family is only now contributing bodies of . Each family has also contributed a large fraction of their total families into the 3:1 MMR. Most of these asteroids would have been directly placed into the resonance immediately following the family formation event, and therefore would have resulted in more of an rapid influx, rather than the slow and measureable contribution via the resonance. Further dynamical models beyond the scope of this work may also help to better discern the flux from each family to NEO orbits over time via both the and 3:1 MMR.
One implication of the location of both families near the 3:1 MMR, is that nearly all surviving family members have drifted inward from the family center over time. This inward drift requires a retrograde spin sense, which is a property that can be determined with lightcurve observations. It is possible to change the spin sense of an asteroid, by either collisions or YORP reorientation. Both families show an absence of small objects near the center of the family, suggesting that most have continued their inward drift without a substantial number suffering a spin-axis reorientation. This supports the implication that most members of both families should be retrograde rotators.
Each of the three proposed NEO space mission targets (1999 RQ36, 1999 JU3 and 1996 FG3) are almost certainly (%) delivered from the inner region of the Main Asteroid belt, following the well-studied dynamical pathway from the Main Belt to NEO-orbits (Bottke et al. 2000,2002; Campins et al. 2010; Walsh et al. 2012). More specifically, they appear to have come from the resonance at 2.15 AU, which is the dominant supplier of NEOs (Bottke et al. 2002), and their current low inclination is indicative of similarly low inclination orbits in the Main Belt. Though entire works are dedicated to understanding the origin of these specific objects, the two families studied here are likely the dominant sources of primitive NEOs. These conclusions have been reached previously in works by Campins et al. (2010) finding the Nysa-Polana complex as the likely source of 1999 RQ36 (now probably from the Eulalia family), or Gayon-Markt et al. (2012) finding that the background (now largely belonging to the new Polana family) is an equal or greater contributor of primitive NEOs.
A major part of this work was the description of relatively new techniques to detect and analyse very diffuse and old asteroid families. Despite significant previous work on these topics, the discovery of both families was greatly aided by the use of the WISE albedo data, which allowed specific analysis of low-albedo objects. Beyond the advantage of focusing on asteroids with similar physical properties, it also removed the “noisy” background of high-albedo asteroids which otherwise would have convoluted the HCM tests (resulting in the HCM linking the huge chunks of the asteroid belt). Thus the slew of new data allows a pre-selected subset of the asteroid belt from which to detect possible family correlations.
The possible pitfalls of these technique are that the portion of the asteroid belt selected could be biased or incomplete. Asteroids not included in the subset of data, those not observed by WISE for example, need to be tracked down in further iterations of the work to build a full list of family members. Though this work attempted to search for all possible parent members using numerous databases, (495) Eulalia required special dynamical care to be recognised as the parent, a task not realistic for a larger survey of very old families.
Finally, there are potentially vast implications in assigning much of what was considered to the be the background of the asteroid belt to an older family, the new Polana family. While this family was particularly difficult to find, even while scouring a small subset of the entire database of asteroids, it highlights what might still be lurking in the data. How much of the background is actually part of old and diffuse families? If we continue with this exercise and continue to discover old and diffuse families will there be any background left, and what does this tell us about the origin of the asteroid belt? Certainly, the answers to these questions are beyond the scope of this project, but hopefully the flood of data from current and future spacecraft (the ESA Gaia mission for example) and larger ground-based surveys might help to answer these.
Acknowledgments
KJW would like to thank NLSI for funding, and also the Gaia-GREAT program of the European Science Foundation for funding a visit to Nice. MD thanks the Centre National d’Etudes Spatiales (CNES) for financial support. DSL and WFB thank the NASA New Frontiers Program for supporting this research (Contract NNM10AA11C). DV was supported by the Grant Agency of the Czech Republic through grant 205/08/0064. We thank Alex Parker for the SDSS color palette.
References
- Benavidez et al. (2012) Benavidez, P. G., Durda, D. D., Enke, B. L., Bottke, W. F., Nesvorný, D., Richardson, D. C., Asphaug, E., Merline, W. J., 2012. A comparison between rubble-pile and monolithic targets in impact simulations: Application to asteroid satellites and family size distributions Icarus 219, 57-76.
- Binzel (1987) Binzel, R. P., 1987. A photoelectric survey of 130 asteroids. Icarus 72, 135-208.
- Binzel et al. (2001) Binzel, R. P., Harris, A. W., Bus, S. J., Burbine, T. H., 2001. Spectral properties of near-Earth objects: Palomar and IRTF results for 48 objects including spacecraft targets (9969) Braille and (10302) 1989 ML. Icarus 151, 139-149.
- Binzel et al. (2004) Binzel, R. P., Rivkin, A. S., Stuart, J. S., Harris, A. W., Bus, S. J., Burbine, T. H., 2004. Observed spectral properties of near-Earth objects: results for population distribution, source regions, and space weathering processes. Icarus 170, 259-294.
- Bottke, Rubincam, and Burns (2000) Bottke, W. F., Rubincam, D. P., Burns, J. A., 2000. Dynamical evolution of main belt meteoroids: Numerical simulations incorporating planetary perturbations and Yarkovsky thermal forces. Icarus 145, 301-331.
- Bottke et al. (2001) Bottke, W. F., Vokrouhlický, D., Brož, M., Nesvorný, D., Morbidelli, A., 2001. Dynamical spreading of asteroid families by the Yarkovsky effect. Science 294, 1693-1696.
- Bottke et al. (2002) Bottke, W. F., Morbidelli, A., Jedicke, R., Petit, J.-M., Levison, H. F., Michel, P., Metcalfe, T. S., 2002. Debiased orbital and absolute magnitude distributions of the near-Earth objects. Icarus 156, 399-433.
- Bottke et al. (2005) Bottke, W. F., Durda, D. D., Nesvorný, D., Jedicke, R., Morbidelli, A., Vokrouhlický, D., Levison, H. F., 2005. Linking the collisional history of the main asteroid belt to its dynamical excitation and depletion. Icarus 179, 63-94.
- Bottke et al. (2006) Bottke, W. F., Jr., Vokrouhlický, D., Rubincam, D. P., Nesvorný, D., 2006. The Yarkovsky and YORP Effects: Implications for asteroid dynamics. Annu. Rev. Earth Planet. Sci. 34, 157-191.
- Bottke et al. (2007) Bottke, W. F., Vokrouhlický, D., Nesvorný, D., 2007. An asteroid breakup 160 My ago as the probable source of the K-T impactor. Nature 449, 48-53.
- Bus (1999) Bus, S. J. 1999. Compositional Structure in the Asteroid Belt: Results of a Spectroscopic Survey. Ph.D. Dissertation, Massachusetts Institute of Technology, Cambridge, MA.
- Bus and Binzel (2002) Bus, S. J., Binzel, R. P., 2002. Phase II of the Small Main-Belt Asteroid Spectroscopic SurveyA Feature-Based Taxonomy. Icarus 158, 146-177.
- Bus (2011) Bus, S. J., Ed. 2011 IRTF Near-IR Spectroscopy of Asteroids V2.0. EAR-A-I0046-4-IRTFSPEC-V2.0. NASA Planetary Data System
- Campins et al. (2010) Campins, H., Morbidelli, A., Tsiganis, K., de León, J., Licandro, J., Lauretta, D., 2010. The Origin of Asteroid 101955 (1999 RQ36). Astrophys. J. 721, L53-L57.
- Campins et al. (2012) Campins, H., de León, J., Morbidelli, A., Licandro, J., Gayon, J., Delbó, M., Michel, P., 2012. The Origin of Asteroid 162173 (1999 JU3). LPI Contributions 1667 6452.
- Čapek and Vokrouhlický (2004) Čapek, D., and Vokrouhlický, D., 2004. The YORP effect with finite thermal conductivity. Icarus 172, 526-536.
- Cellino et al. (2001) Cellino, A., Zappalà, V., Doressoundiram, A., di Martino, M., Bendjoya, P., Dotto, E., Migliorini, F., 2001. The puzzling case of the Nysa-Polana family Icarus 152, 225-237.
- Christou (2003) Christou, A. A., 2003. The statistics of flight opportunities to accessible near-Earth asteroids. Planet. Space Sci. 51, 221-231.
- Clark et al. (2010) Clark, B. E., et al. 2010. Spectroscopy of B-type asteroids: Subgroups and meteorite analogs. Journal of Geophysical Research (Planets) 115, 6005.
- Clark et al. (2011) Clark, B. E. et al., 2011. Asteroid (101955) 1999 RQ36: Spectroscopy from 0.4 to 2.4 μm and meteorite analogs. Icarus 216, 462-475.
- Cloutis et al. (2010) Cloutis, E. A., Hudon, P., Romanek, C. S., Bishop, J. L., Reddy, V., Gaffey, M. J., and Hardersen, P. S., 2010. Spectral reflectance properties of ureilites. Meteoritics and Planetary Science 45, 1668-1694.
- de León et al. (2010) De León, J., Campins, H., Tsiganis, K., Morbidelli, A., Licandro, J., 2010. Origin of the near-Earth asteroid Phaethon and the Geminids meteor shower Astron. Astrophys. 513, A26.
- de León et al. (2011) de León, J., Mothé-Diniz, T., Licandro, J., Pinilla-Alonso, N., Campins, H., 2011. New observations of asteroid (175706) 1996 FG3, primary target of the ESA Marco Polo-R mission. Astron. Astrophys. 530, L12.
- de León et al. (2012) de León, J., Pinilla-Alonso, N., Campins, H., Licandro, J., Marzo, G. A., 2012. Near-infrared spectroscopic survey of B-type asteroids: Compositional analysis. Icarus 218, 196–206.
- Delbó and Harris (2002) Delbó, M., Harris, A. W., 2002. Physical properties of near-Earth asteroids from thermal infrared observations and thermal modeling. Meteoritics and Planetary Science 37, 1929-1936.
- Delbó et al. (2007) Delbó, M., Dell’Oro, A., Harris, A. W., Mottola, S., Mueller, M., 2007. Thermal inertia of near-Earth asteroids and implications for the magnitude of the Yarkovsky effect. Icarus 190, 236-249.
- Delbó et al. (2011) Delbó, M., Walsh, K., Mueller, M., Harris, A. W., Howell, E. S., 2011. The cool surfaces of binary near-Earth asteroids. Icarus212, 138-148.
- DeMeo et al. (2009) DeMeo, F. E., Binzel, R. P., Slivan, S. M., Bus, S. J., 2009. An extension of the Bus asteroid taxonomy into the near-infrared. Icarus 202, 160-180.
- Emery et al. (2010) Emery, J. P., Fernández, Y. R., Kelley, M. S., Hergenrother, C., Ziffer, J., Lauretta, D. S., Drake, M. J., Campins, H., 2010.Thermophysical Characterization of Potential Spacecraft Target (101955) 1999 RQ36. Lunar and Planetary Institute Science Conference Abstracts, 41, 2282.
- Farinella and Vokrouhlicky (1999) Farinella, P., Vokrouhlický, D., 1999. Semimajor Axis Mobility of Asteroidal Fragments. Science 283, 1507-1510.
- Fieber-Beyer, Gaffey, and Reddy (2008) Fieber-Beyer, S. K., Gaffey, M. J., Reddy, V., 2008. Compositional and Dynamical Studies of Asteroids Located In/Near the 3:1 Kirkwood Gap: 495 Eulalia a First Step. Lunar and Planetary Institute Science Conference Abstracts 39, 1149.
- Fieber-Beyer (2010) Fieber-Beyer, S. K., Fieber-Beyer IRTF Mainbelt Asteroid Spectra V1.0. EAR-A-I0046-3-FBIRTFSPEC-V1.0. NASA Planetary Data System, 2011.
- Gayon-Markt (2012) Gayon-Markt, J., Delbó, M., Morbidelli, A., Marchi, S., 2012. On the origin of the Almahata Sitta meteorite and 2008 TC3 asteroid. Monthly Notices of the Royal Astronomical Society 424, 508-518.
- Gladman (2000) Gladman, B., Michel, P., Froeschlé, C., 2000. The Near-Earth Object Population. Icarus 146, 176-189.
- Gradie and Tedesco (1982) Gradie, J., Tedesco, E. 1982. Compositional structure of the asteroid belt. Science 216, 1405-1407.
- Grieve and Shoemaker (1994) Grieve, R. A. F., Shoemaker, E. M. 1994. The Record of Past Impacts on Earth. T. Gehrels (Eds.), Hazards Due to Comets and Asteroids, University of Arizona Press, Tucson pp. 417-462.
- Harris (1998) Harris, A.W. 1998, A Thermal Model for Near-Earth Asteroids. Icarus 131, 291-301.
- Harris et al. (2009) Harris, A. W., Fahnestock, E. G., Pravec, P. 2009, On the shapes and spins of “rubble pile” asteroids Icarus 199, 310-318.
- Hiroi et al. (1996) Hiroi, T., Zolensky, M. E., Pieters, C. M., Lipschutz, M. E. 1996, Thermal metamorphism of the C, G, B, and F asteroids seen from the 0.7 micron, 3 micron and UV absorption strengths in comparison with carbonaceous chondrites Meteoritics and Planetary Science 31, 321-327.
- Hiroi et al. (2010) Hiroi, T., Jenniskens, P., Bishop, J. L., Shatir, T. S. M., Kudoda, A. M., Shaddad, M. H. 2010, Bidirectional visible-NIR and biconical FT-IR reflectance spectra of Almahata Sitta meteorite samples Meteoritics and Planetary Science 45, 1836-1845.
- Knežević and Milani (2003) Knežević, Z, Milani, A., 2003. Proper element catalogs and asteroid families. Astron, Astrophys. 403, 1165-1173.
- Lauretta et al. (2010) Lauretta, D. S., et al., 2010, Asteroid (101955) 1999 RQ36: Optimum Target for an Asteroid Sample Return Mission Meteoritics and Planetary Science Supplement 73, 5153.
- Lazzaro et al. (2004) Lazzaro, D., Angeli, C. A., Carvano, J. M., Mothé-Diniz, T., Duffard, R., Florczak, M. 2004. S3OS2: the visible spectroscopic survey of 820 asteroids. Icarus 172 179-220.
- Levison et al. (2009) Levison, H. F., Bottke, W. F., Gounelle, M., Morbidelli, A., Nesvorný, D., Tsiganis, K. 2009. Contamination of the asteroid belt by primordial trans-Neptunian objects. Nature 460, 364-366.
- Mainzer et al. (2011) Mainzer, A., et al. 2011. NEOWISE Studies of Spectrophotometrically Classified Asteroids: Preliminary Results. Astrophys. J. 741 90.
- Marchis et al. (2008) Marchis, F., Descamps, P., Berthier, J., Hestroffer, D., Vachier, F., Baek, M., Harris, A. W., Nesvorný, D. 2008. Main belt binary asteroidal systems with eccentric mutual orbits. Icarus 195, 295-316.
- Masiero et al. (2011) Masiero, J. R., et al. 2011. Main Belt Asteroids with WISE/NEOWISE. I. Preliminary Albedos and Diameters. The Astrophysical Journal 741 68.
- Morbidelli et al. (2002) Morbidelli, A., Jedicke, R., Bottke, W. F., Michel, P., Tedesco, E. F. 2002. From Magnitudes to Diameters: The Albedo Distribution of Near Earth Objects and the Earth Collision Hazard. Icarus 158 329-342.
- Mothé-Diniz, Carvano, and Lazzaro (2003) Mothé-Diniz, T., Carvano, J. M., Lazzaro, D. 2003. Distribution of taxonomic classes in the main belt of asteroids. Icarus 162, 10-21.
- Mottola and Lahulla (2000) Mottola, S., Lahulla, F., 2000. Mutual Eclipse Events in Asteroidal Binary System 1996 FG3: Observations and a Numerical Model. Icarus 146, 556-567.
- Mueller et al. (2007) Mueller, M., Harris, A.W., Fitzsimmons, A., 2007. Size, Albedo, and Taxonomic Type of Potential Spacecraft Target Asteroid (10302) 1989 ML. Icarus 187, 611-615.
- Mueller et al. (2011) Mueller, M. et al., 2011. ExploreNEOs. III. Physical Characterization of 65 Potential Spacecraft Target Asteroids. AJ 141, 109.
- Nesvorný, Ferraz-Mello, Holman, and Morbidelli (2002) Nesvorný, D., Ferraz-Mello, S., Holman, M., Morbidelli, A. 2002. Regular and Chaotic Dynamics in the Mean-Motion Resonances: Implications for the Structure and Evolution of the Asteroid Belt. W. F. Bottke Jr., A. Cellino, P. Paolicchi, and R. P. Binzel (eds), Asteroid III, University of Arizona Press, Tucson, pp. 379-394.
- Parker et al. (2008) Parker, A., Ivezic, Z̄., Jurić, M., Lupton, R., Sekora, M. D., Kowalski, A., 2008. The size distributions of asteroid families in the SDSS Moving Object Catalog 4. Icarus 198, 138-155.
- Pravec et al. (2000) Pravec, P. et al., 2000. Two-Period Lightcurves of 1996 FG3, 1998 PG, and (5407) 1992 AX: One Probable and Two Possible Binary Asteroids. Icarus 146, 190–203.
- Pravec et al. (2012) Pravec, P., Harris, A. W., Kušnirák, P., Galád, A., Hornoch, K., 2012. Absolute magnitudes of asteroids and a revision of asteroid albedo estimates from WISE thermal observations. Icarus 221, 365-387.
- Rubincam (2000) Rubincam, D. P., 2000. Radiative Spin-up and Spin-down of Small Asteroids. Icarus 148, 2-11.
- Scheirich and Pravec (2009) Scheirich, P. Pravec P., 2009. Modeling of lightcurves of binary asteroids. Icarus 200, 531–547.
- Stöffler and Ryder (2001) Stöffler, D., Ryder, G., 2001. Stratigraphy and Isotope Ages of Lunar Geologic Units: Chronological Standard for the Inner Solar System. Space Science Reviews 96, 9-54.
- Tedesco, Noah, Noah, and Price (2002) Tedesco, E. F., Noah, P. V., Noah, M., Price, S. D., 2002. The Supplemental IRAS Minor Planet Survey. Astron. J. 123, 1056-1085.
- Usui et al. (2011) Usui, F., et al., 2011. Asteroid Catalog Using Akari: AKARI/IRC Mid-Infrared Asteroid Survey. Pub. Astron. Soc. Japan 63, 1117-1138.
- Vokrouhlický and Čapek (2002) Vokrouhlický, D., Čapek, D., 2002. YORP-Induced Long-Term Evolution of the Spin State of Small Asteroids and Meteoroids: Rubincam’s Approximation. Icarus 159, 449-467.
- Vokrouhlický et al. (2006a) Vokrouhlický, D., Brož, M., Bottke, W. F., Nesvorný, D., Morbidelli, A., 2006a. Yarkovsky/YORP chronology of asteroid families. Icarus 182, 118-142.
- Vokrouhlický det al. (2006b) Vokrouhlický, D., Brož, M., Morbidelli, A., Bottke, W. F., Nesvorný, D., Lazzaro, D., Rivkin, A. S., 2006b. Yarkovsky footprints in the Eos family. Icarus 182, 92-117.
- Walsh et al. (2008) Walsh, K. J., Richardson, D.C., P. Michel, 2008. Rotational breakup as the origin of small binary asteroids. Nature 454, 188-191.
- Walsh et al. (2011) Walsh, K. J., Morbidelli, A., Raymond, S. N., O’Brien, D. P., Mandell, A. M., 2011. A low mass for Mars from Jupiter’s early gas-driven migration. Nature 475, 206-209.
- Xu, Binzel, Burbine, and Bus (1996) Xu, S., Binzel, R. P., Burbine, T. H., Bus, S. J., 1996. Small Main-Belt Asteroid Survey V2.1. NASA Planetary Data System 168.
- Xu, Binzel, Burbine, and Bus (1995) Xu, S., Binzel, R. P., Burbine, T. H., Bus, S. J., 1995. Small main-belt asteroid spectroscopic survey: Initial results. Icarus 115, 1-35.
- Yeomans et al. (1997) Yeomans, D. K., et al., 1997. Estimating the Mass of Asteroid 253 Mathilde from Tracking Data During the NEAR Flyby. Science 278, 2106-2109.
- Zappalá, Cellino, Farinella, and Knezevic (1990) Zappalá, V., Cellino, A., Farinella, P., and Knežević, Z., 1990. Asteroid families. I - Identification by hierarchical clustering and reliability assessment. Astron. J. 100, 2030-2046.
- Zappalá, Cellino, Farinella, and Milani (1994) Zappalá, V., Cellino, A., Farinella, P., and Milani, A., 1994. Asteroid families. 2: Extension to unnumbered multiopposition asteroids. Astron. J. 107, 772-801.
- Zappalá et al. (1995) Zappalá, V., Bendjoya, P., Cellino, A., Farinella, P., Froeschle, C., 1995. Asteroid families: Search of a 12,487-asteroid sample using two different clustering techniques.. Icarus 116, 291-314.
- Ziffer et al. (2011) Ziffer, J., et al., 2011. Near-infrared spectroscopy of primitive asteroid families. Icarus 213, 538-546.