OH (1720 MHz) Masers: A Multiwavelength Study of the Interaction between the W51C Supernova Remnant and the W51B Star Forming Region
Abstract
We present a comprehensive view of the W51B H ii region complex and the W51C supernova remnant using new radio observations from the VLA, VLBA, MERLIN, JCMT, and CSO along with archival data from Spitzer, ROSAT, ASCA, and Chandra. Our VLA data include the first cm (74 MHz) continuum image of W51 at high resolution (). The 400 cm image shows non-thermal emission surrounding the G49.2-0.3 H ii region, and a compact source of non-thermal emission (W51B_NT) coincident with the previously-identified OH (1720 MHz) maser spots, non-thermal 21 and 90 cm emission, and a hard X-ray source. W51B_NT falls within the region of high likelihood for the position of TeV -ray emission. Using the VLBA three OH (1720 MHz) maser spots are detected in the vicinity of W51B_NT with sizes of 60 to 300 AU and Zeeman effect magnetic field strengths of 1.5 to 2.2 mG. The multiwavelength data demonstrate that the northern end of the W51B H ii region complex has been partly enveloped by the advancing W51C SNR and this interaction explains the presence of W51B_NT and the OH masers. This interaction also appears in the thermal molecular gas which partially encircles W51B_NT and exhibits narrow pre-shock ( km s-1) and broad post-shock ( km s-1) velocity components. RADEX radiative transfer modeling of these two components yield physical conditions consistent with the passage of a non-dissociative C-type shock. Confirmation of the W51B/W51C interaction provides additional evidence in favor of this region being one of the best candidates for hadronic particle acceleration known thus far.
1 INTRODUCTION
Star formation triggered by the interaction of supernova remnants (SNRs) with their parent molecular clouds has long been thought to play an important role in the production of new generations of stars. Indeed, it is thought that the enrichment of our own Solar System with heavy elements might have resulted from such an interaction. In practice such interactions are very difficult to observe due to the extreme kinematic complexity present toward the inner Galactic plane where most massive stars and SNRs are found. Over the last two decades it has been recognized that when OH (1720 MHz) masers are found toward SNRs they act as signposts for SNR/molecular cloud interactions (see for example Wardle & Yusef-Zadeh, 2002; Frail et al., 1996; Green et al., 1997; Frail & Mitchell, 1998; Frail, 2011). To date, OH (1720 MHz) masers have been found in 24 SNRs, or 10% of the known SNRs in our Galaxy (Frail et al., 1996; Yusef-Zadeh et al., 1996; Green et al., 1997; Koralesky et al., 1998; Sjouwerman & Pihlström, 2008; Hewitt & Yusef-Zadeh, 2009). Indeed, all 24 OH (1720 MHz) maser SNRs can be found in the Jiang et al. (2010) catalogue of 34 SNRs thought to be interacting with associated molecular clouds.
The observational properties of these SNR masers are quite different from those of H ii region OH (1720 MHz) masers. SNR OH (1720 MHz) masers have: (1) larger maser spot sizes; (2) narrow and simple line profiles; (3) low levels of circular polarization (typically ); (4) low magnetic field strengths ( mG); (5) relatively non-variable flux densities; (6) a notable lack of any other maser species; and (7) low luminosity (Yusef-Zadeh et al., 1996; Claussen et al., 1997, 1999, 1999b, 2002; Koralesky et al., 1998; Brogan et al., 2000; Hoffman et al., 2003, 2005a, 2005b; Woodall & Gray, 2007; McDonnell et al., 2008; Lazendic et al., 2010; Pihlström et al., 2011). These observational facts can be explained if OH (1720 MHz) SNR masers originate in the post-shock molecular gas behind C-type shocks, and are collisionally pumped in contrast to their radiatively pumped H ii region counterparts (Elitzur, 1976).
Current theories further suggest that the collisional pump is most efficient for post-shock densities of cm-3 and temperatures in the range 50 K 125 K, and that the abundance of OH must be enhanced by the dissociation of water due to X-rays and/or -rays emanating from the SNR (Lockett et al., 1999; Wardle, 1999; Hewitt et al., 2008). Observations of the physical conditions in the pre- and post-shock gas available to date are in good agreement with these theoretical expectations (see e.g. Frail & Mitchell, 1998; Reach et al., 2005). Prior to this work, however, there have been few in-depth studies employing multi-transition, multi-species analyses. Interestingly, a number of recent publications have also noted the growing number of -ray detected SNRs that are interacting with nearby molecular clouds. (Hewitt et al., 2009; Castro & Slane, 2010; Méhault, 2011; Frail, 2011; Uchiyama et al., 2012, to name a few). Indeed, many of the -ray SNRs are associated with well known OH (1720 MHz) sources: e.g. G349.7+0.2,CTB 37A, 3C391, W44, IC443 and W51C. Hence, as a powerful probe of SNR/molecular cloud interactions, observations of this OH maser line can potentially pinpoint sites of particle acceleration.
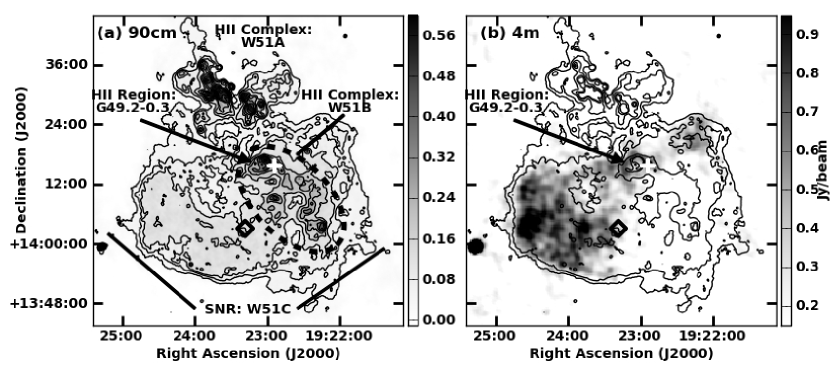
Of the known SNR OH (1720 MHz) masers, the origin of those observed toward the W51 complex remain among the most poorly understood (Green et al., 1997; Brogan et al., 2000). W51 is composed of two large H ii region complexes W51A (also known as W51 Main) and W51B, as well as the SNR W51C (see the 90 and 400 cm images in Figure 1a,b). W51 is located near the Sagittarius arm tangent point at and and thus velocity crowding in this direction has made distance determinations (and relative orientations along the line of sight) for the three W51 components (A, B, and C) uncertain. In the past, their distances were considered to be in the range of 5-7 kpc (Kolpak et al., 2003). A maser parallax distance has recently been measured for W51A of 5.4 () kpc (Sato et al., 2010). Additionally, the soft X-ray absorption seen toward the W51B region compared to the rest of the W51C SNR suggests that W51B lies in front of W51C (Koo et al., 1995). However, it remains uncertain whether W51A is in front of, co-distant with, or behind W51B. The OH (1720 MHz) masers reported by Green et al. (1997) are located west of the W51B H ii region G49.2-0.3. Subsequent observations of these masers by Brogan et al. (2000) demonstrated that these masers exhibit all the hallmarks of SNR OH (1720 MHz) masers. Like Green et al., these authors conclude that these masers are most likely excited by the interaction between the W51C SNR (the only known SNR in the region) and the molecular gas associated with the W51B H ii region.
However, the exact nature of this interaction remains unclear especially since SNR OH (1720 MHz) maser theory suggests that a sufficient column of OH with the necessary velocity coherence can only be achieved in shocks that move (more or less) perpendicular to the line of sight (see for example Lockett et al., 1999). It is difficult to reconcile the need for an edge-on shock with the fact that W51B lies in front of the W51C SNR (i.e. it seems that any shock would propagate with a substantial component along the line of sight). This paper describes a multiwavelength investigation of the W51B/C OH (1720 MHz) masers and their environment spanning ten decades in wavelength (400 cm to X-rays) and six decades of angular resolution (10 mas to ). The goal of this study is to better understand the properties of the maser emission through high resolution MERLIN111MERLIN is a UK national facility operated by University of Manchester on behalf of STFC. and Very Long Baseline Array222The National Radio Astronomy Observatory operates the Very Long Baseline Array and is a facility of the National Science Foundation operated under a cooperative agreement by Associated Universities, Inc. (VLBA) observations, as well as to understand the physical conditions that have led to the maser emission using Very Large Array (VLA)333The National Radio Astronomy Observatory operates the Very Large Array and is a facility of the National Science Foundation operated under a cooperative agreement by Associated Universities, Inc. 400 cm, 90 cm, and 20 cm data, James Clerk Maxwell Telescope (JCMT)444The James Clerk Maxwell Telescope is operated by The Joint Astronomy Centre on behalf of the Science and Technology Facilities Council of the United Kingdom, the Netherlands Organisation for Scientific Research, and the National Research Council of Canada. CO(3–2) and 13CO(2–1) data, and Caltech Submillimeter Observatory (CSO)555The Caltech Submillimeter Observatory is operated by the California Institute of Technology under cooperative agreement with the National Science Foundation (AST-0838261). HCO+(3–2) and HCN(3–2) data. For comparison, we also make use of archival Spitzer mid-IR 8 m data, as well as Chandra, ROSAT, and ASCA X-ray data.
2 OBSERVATIONS
The observing parameters for all of the observations described in this paper are listed in Table 1. Additional details are provided below.
2.1 MERLIN OH (1720 MHz) Maser Observations
The OH (1720 MHz) masers were observed for approximately 18 hours (15 hrs on source) over the course of three days using the six antennas of the MERLIN array (Lovell was not used). The Doppler tracking corrections, in the LSR convention, were applied in the correlator. In addition to right circular and left circular polarization data, the RL and LR cross correlation data were also recorded. Absolute flux and bandpass calibration were carried out using observations of 3C 84. Initial phase calibration was obtained from periodic observations of J1922+1530. Instrumental polarization leakage corrections were derived from the unpolarized source 3C84, and 3C286 was used to set the absolute polarization angle. The data were processed using the AIPS software package.
After initial amplitude, delay, and phase calibration, several iterations of self-calibration on the strongest (W51_2) maser channel were carried out and subsequently applied to the full spectral line dataset.
2.2 VLBA + Y1 OH (1720 MHz) Maser Observations
The OH (1720 MHz) masers were observed for approximately 12 hours (6 hrs on source) over the course of two days using the ten antennas of the VLBA plus one VLA (Y1) antenna. Both right circular and left circular polarization data were recorded. All calibration and imaging for these data were carried out using the AIPS software. Absolute flux calibration was determined from periodic system temperature measurements coupled with existing antenna gain tables. Bandpass and delay calibration were performed using observations of the strong continuum source J2253+1608 (3C 454.3). In order to obtain accurate absolute positions and sensitivity to potentially weak maser emission, these observations were phase referenced. Since no calibration source suitable for VLBA observations was known at that time, a short VLBA survey of near-by VLA calibrators was carried out prior to the target observations. From this survey, the JVAS source J1911+1611 (, with an uncertainty of mas) had the strongest compact emission and was used to phase reference the maser data with a cycle time of 2 minutes (this source is now available in the VLBA calibrator catalog). Corrections for Doppler tracking of the target data were applied offline in AIPS.
After initial amplitude, delay, and phase calibration, several iterations of self-calibration on the strongest (W51_2a) maser channel were carried out and subsequently applied to the full line dataset.
2.3 VLA 21, 90, and 400 cm Continuum Observations
We have obtained VLA observations from the B+C configurations at 400 cm and A+B+C+D configurations at 90 cm (see Table 1 for details). The FWHP primary beam size of the 90 cm and 400 cm data are and , respectively. The data were reduced and imaged using the low frequency wide-field imaging techniques described in Brogan et al. (2004, and references therein). Gain, bandpass, and absolute flux calibration for the 90 cm data were carried out using J1924+334, Cygnus A, and 3C 48 respectively. In order to best match the 400 cm data a 90 cm image was constructed using only the B+C+D configurations and the multiscale clean algorithm in AIPS, with scales of (i.e. the intrinsic beam given the combination of data and weighting), , and . To achieve the highest angular resolution, a 90 cm image was also constructed from the A+B+C+D configuration data and multiscale clean with scales of (i.e. the intrinsic beam given the combination of data and weighting), , and .
Absolute flux, bandpass, and coarse phase calibration at 400 cm were all obtained from observations of Cygnus A (located distant). Of particular note is the lack of accurate absolute position information for the 400 cm data due to the large distance to the 400 cm phase calibrator. Typically this problem is solved by using a 90 cm image as an initial model for the 400 cm self-calibration. However, in the case of the W51 region, much of the total 90 cm flux is dominated by H ii regions making it unsuitable for a 400 cm model (400 cm emission is absorbed by ionized thermal emission along the line-of-sight creating distinct differences in their morphology, see Fig. 1a,b). Therefore, the 400 cm images have been shifted by in R.A. and in Dec. so that the background point sources detected at both 400 cm and 90 cm (throughout the 90 cm primary beam) are coincident.
We have also obtained new VLA C-configuration 21 cm H i spectral line data toward the W51B region (primary beam ). The continuum from the line free-channels of these data have been combined with the continuum from line free-channels of archival VLA D-configuration 21 cm H i data (Koo, 1997) to form a 21 cm continuum image with a resolution matching that of the 90 cm B+C+D configuration data. It should be noted, however, that owing to spatial filtering the 21 cm data are missing flux on scales larger than compared to for the 90 cm data.
2.4 JCMT CO (3–2) and 13CO (2–1) Observations
In order to investigate the nature of the shocked molecular gas in the vicinity of the OH (1720 MHz) masers we observed the CO(3–2) line using the 345 GHz B3 receiver at the JCMT. The zenith opacity at 225 GHz measured by the tipping radiometer at the CSO ranged from 0.10-0.12. Data were taken in raster mode with 4-s integrations per spectrum with samples separated by in right ascension and in declination. The final raster is in extent. Typical system temperatures were between 400-500 K. The data were reduced using the SPECX software package. A linear baseline was subtracted from each spectrum using channels outside of the line emission region. In order to minimize baseline ripples we used a nearby off-position that contained low level CO(3–2) emission. To account for this emission we also observed the reference position for 10 minutes in frequency switching mode, and added the resulting emission back to each spectrum. In this paper, the CO(3–2) line intensity is presented in units of (K), where . The final image cube was smoothed to resolution.
A smaller region () around the OH (1720 MHz) masers was also mapped in 13CO(2–1) using receiver A3 when the zenith opacity was 0.13. The samples were taken every in right ascension and every in declination with 4-s integrations. The system temperatures ranged from 250-300 K. The angular resolution of these data is . For 13CO(2–1), we used .
2.5 CSO HCO+ (3–2) and HCN (3–2)Observations
We observed the maser position in HCN (3–2) at 265.886 GHz and HCO+ (3–2) at 267.558 GHz simultaneously using the Caltech Submillimeter Observatory (CSO) in good conditions (). At these frequencies, the beam size is 26″ and the main beam efficiency is 0.7. Using position-switched mode, we acquired 11 minutes of on source integration using the 230 GHz receiver and the facility FFTS autocorrelators. The reference position was (J2000) (Ceccarelli et al., 2011). The data were processed using the CLASS software package. The final velocity resolution was smoothed to 0.60 km s-1 for HCO+ and 1.2 km s-1 for HCN to improve the signal-to-noise. The results are presented in .
3 RESULTS
3.1 MERLIN and VLBA OH (1720 MHz) Data
3.1.1 Maser Spectral Line Properties
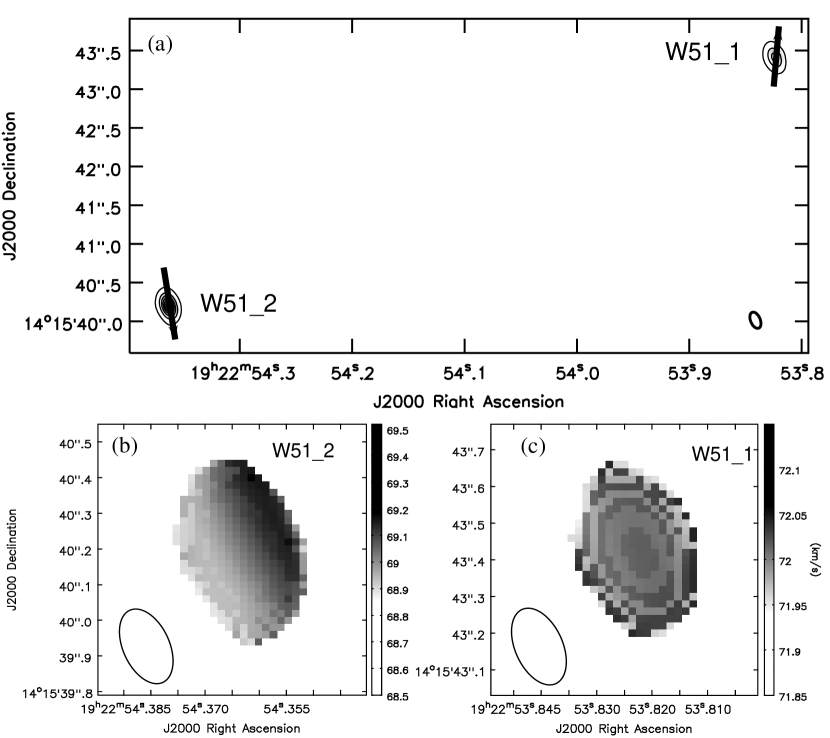
Figure 2a shows the MERLIN integrated intensity of the two OH (1720 MHz) masers spots detected toward W51B. The locations of the maser spots with respect to the W51 region is shown in Fig. 1. The positions and central velocities are in good agreement with those reported by Frail et al. (1996); Green et al. (1997); Brogan et al. (2000) from VLA observations (see Table 2). The results from fitting a Gaussian profile to the maser spectra at the emission peaks are given in Table 2, along with the results from earlier VLA observations for reference (Brogan et al., 2000). At the resolution of the MERLIN data ( mas, P.A.=) the two maser spots remain unresolved. However, maps of the velocity field of the two masers (see Figs. 2b, and c) are notably different, with the W51_1 spot showing a moire pattern indicative of no resolved velocity structure (note the very small width of the displayed velocities), while the W51_2 spot shows a clear SE-NW velocity gradient with higher velocities to the NW. The fitted MERLIN peak velocity and FWHM line width is km s-1 and km s-1 for W51_1, while for W51_2 the fitted values are and km s-1 (also see Table 2). For comparison, at assumed kinetic temperatures of 50 to 125 K, the thermal line width of OH ranges from 0.3 to 0.6 km s-1. Thus, roughly 1/2 to 1/3 of the observed line width can be attributed to thermal motion, with the remaining line width is due to bulk or non-thermal motions.
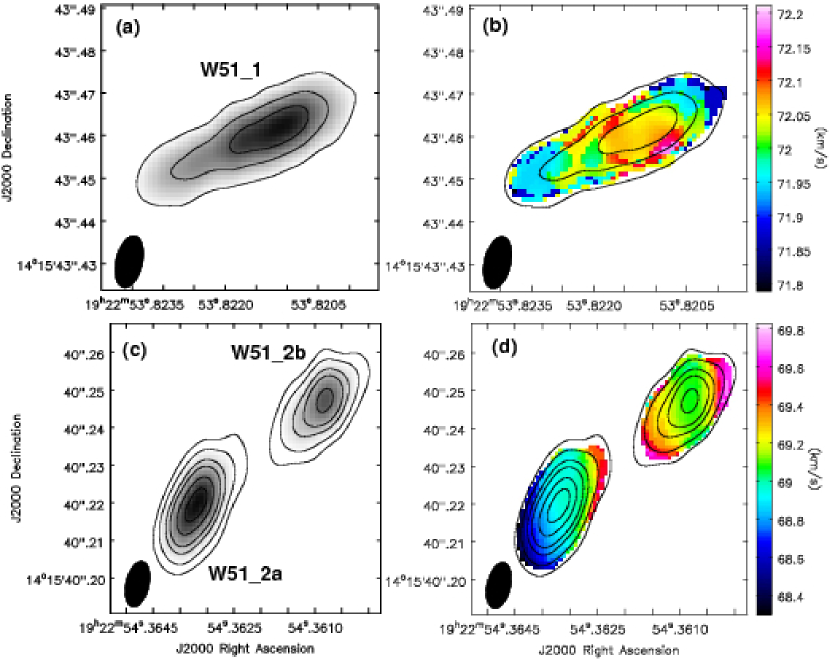
The integrated intensities and velocities (moment 1) of this region as observed with the VLBA with a resolution of mas () are shown in Figures 3 a, b, c, and d. These results are in excellent agreement with the MERLIN results – W51_1 remains a single, though elongated maser feature with little velocity structure while W51_2 is composed of two distinct maser spots W51_2a, and W51_2b with velocities differing by only km s-1 but with considerable velocity structure. The fitted line parameters from the VLBA data are given in Table 2. The fitted FWHM line width for W51_1 is in excellent agreement with that observed with MERLIN. The combined line width of the two components of W51_2 resolved by the VLBA is consistent with the MERLIN line width of this maser, although the individual VLBA line widths of W51_2a and W51_2b are slightly narrower.
We also fitted 2-D Gaussian components to the MERLIN and VLBA integrated intensity images in order to measure the maser locations, angular sizes, and flux densities. The results are given in Table 2. The masers were unresolved by the VLA and so the peak intensity is equivalent to the integrated flux density . Interestingly, only about half of the VLA A-configuration integrated flux density is recovered by the MERLIN observations, while the VLBA and MERLIN recover a similar integrated flux density. If these masers are non-time variable, this suggests that MERLIN and the VLBA resolved out about half the total flux density. This suggests that these masers have a “core-halo” morphology as seen previously for OH (1720 MHz), CH3OH, and H2O masers (see for example Hewitt et al., 2008; Minier et al., 2002; Richards et al., 2011). From the VLBA integrated intensity images, the devonvolved fitted sizes of the maser spots are W51_1: mas (P.A.), W51_2a: mas (P.A.), and W51_2b: mas (P.A.); with statistical uncertainties of about . For reference, at 6 kpc, 10 mas cm or AU. Using the peak intensities given in Table 2 these sizes correspond to peak brightness temperatures of , , and K for W51_1, W51_2a, and W51_2b, respectively.
3.1.2 Maser Polarization and Magnetic Field Properties
From the MERLIN full Stokes polarization data, the maser spot W51_1 has a polarized intensity (=sqrt() of and a position angle of , while the polarized intensity of W51_2 is at . The uncertainty in the position angles () are dominated by the position angle calibration uncertainty which we estimate to be about . The MERLIN linear polarization position angles are shown in Fig. 2a. Brogan et al. (2000) reported a polarized intensity of and for W51_2, but the polarization position angle calibration available for those data were very uncertain.
Following Brogan et al. (2000), we fit the Zeeman magnetic field strength using the thermal Zeeman equation where is Stokes , =0.6536 Hz G-1, and is the derivative of Stokes . The parameter , is the magnitude of the magnetic field strength times a constant that may depend on the angle between the magnetic field and the line-of-sight. For example, for thermal lines ; the meaning of for the OH (1720 MHz) maser case will be discussed further in §4.3.
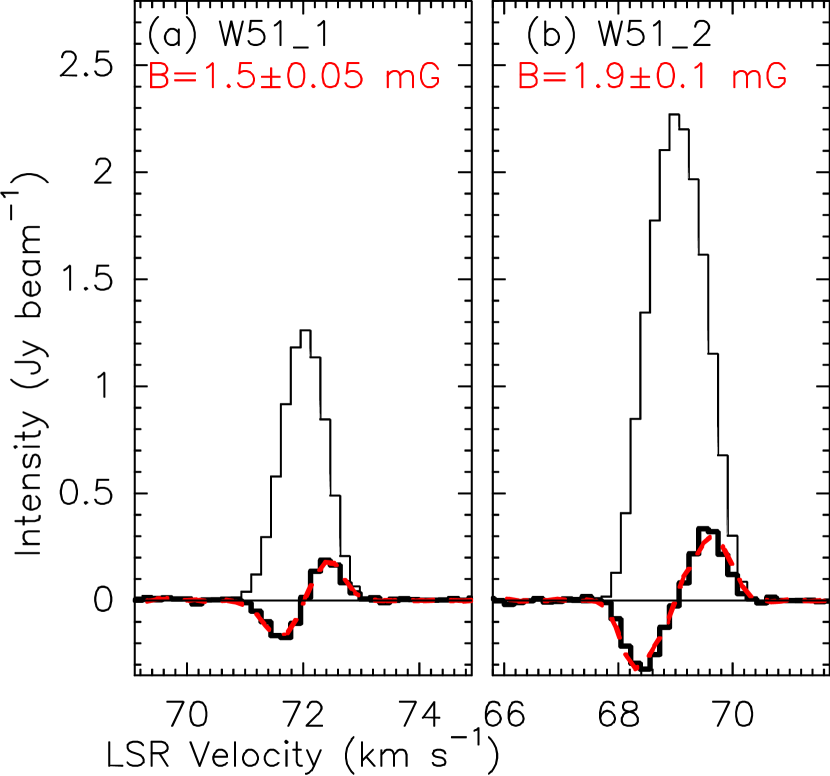
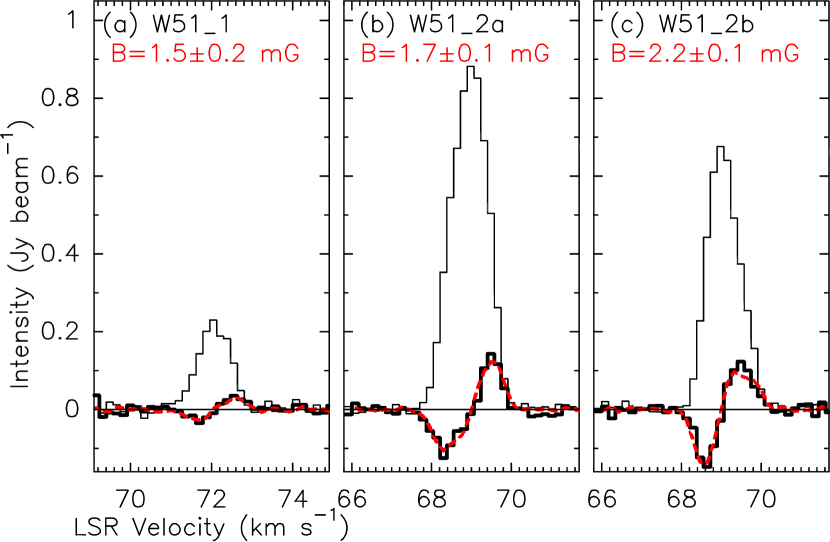
Figures 4 and 5 show the Zeeman fits for the MERLIN and VLBA data, respectively. The fitted values of are also listed in Table 2. The signal-to-noise of these fits are outstanding with S/N up to 30 (MERLIN for W51_1) and S/N=7 (VLBA for W51_1). The observed values of from 1.5 to 2.2 mG are in good agreement with the VLA observations of Brogan et al. (2000). For the maser with the simplest velocity structure, W51_1, the MERLIN and VLBA magnetic field results are in excellent agreement. For W51_2, which the VLBA data reveal is composed of two spots, the MERLIN value is essentially an intensity weighted average of the two individual VLBA results.
These data are of sufficient quality that by following Hoffman et al. (2005a, b) we also independently derived by fitting Gaussian components to the left and right circularly polarized profiles independently and determining the line splitting directly, i.e. =. For example, for W51_2a the line splitting is km s-1. This method yielded consistent results with the thermal Zeeman equation values listed in Table 2.
3.2 VLA Radio Continuum
The 90 cm (330 MHz) images presented in this work (for example Fig 1a) are qualitatively similar to the resolution 90 cm image presented by Subrahmanyan & Goss (1995), but the resolution and sensitivity are significantly improved. Figure 1a shows the VLA B+C+D configuration 90 cm image of the W51 region (resolution , see Table 1) with the three major components W51A (H ii region complex), W51B (H ii region complex), and W51C (SNR) identified. The OH (1720 MHz) masers lie about west of the W51B H ii region G49.20.3, and are coincident with an unresolved 90 cm source with an angular size of at a position of (J2000) (see Fig. 1a).
The W51 region is shown for the first time at a wavelength longer than 2m in Figure 1b. The VLA 400 cm B+C configuration image with a resolution of (see Table 1) reveals diffuse, extended non-thermal emission concentrated mostly to the eastern side of the W51C SNR, with some diffuse emission also appearing toward the northwestern boundary of the W51C SNR. Most interesting for the purpose of the current study is the non-thermal 400 cm emission that appears to partially encircle the G49.20.2 H ii region and the discovery of an unresolved 400 cm source coincident with 90 cm emission and the OH (1720 MHz) masers. Hereafter, we will call this source of non-thermal emission W51B_NT. It is notable that the area toward the southern portion of the W51B string of H ii regions is invisible at 400 cm, consistent with these regions being in the foreground of the W51C SNR, and free-free absorbing the 400 cm emission from W51C along this line-of-sight (see for example Brogan et al., 2005; Nord et al., 2006).
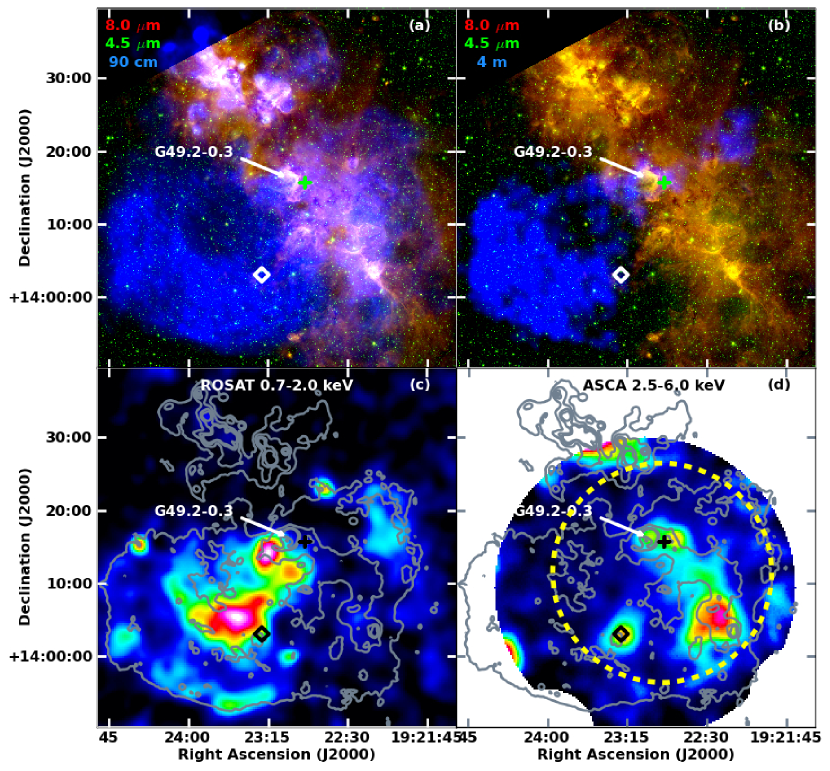
To aid comparison of the thermal vs non-thermal gas, Figures 6a, b, shows three-color images constructed from the Spitzer GLIMPSE 4.5 and 8 m bands and the VLA 90 cm and 400 cm data, respectively. The mid-infrared emission traces thermal ionized gas, as well as emission from dust and PAHs (Benjamin et al., 2005). Its morphology matches closely that of the molecular cloud associated with W51B (see for example Koo, 1999; Bieging et al., 2010). The 90 cm emission (Fig. 6a) traces both bright synchrotron (SNR) emission and optically thick free-free emission from H ii regions. In contrast, the 400 cm emission (Fig. 6b) traces only synchrotron emission except where it is absorbed by foreground free-free emission. Fig. 6c and d show the large scale ROSAT soft and ASCA hard X-ray emission, respectively, first presented by Koo et al. (2002). Soft X-rays trace hot ( keV) thermal gas from the SNR, except where it is absorbed by the intervening total column of atomic and molecular gas. In contrast, the hard X-rays are mostly unaffected by the column of gas along the line of sight and originates from even hotter thermal gas, including a pulsar wind nebula candidate and young stars with fast winds. We detect diffuse 90 cm emission at the location of the pulsar wind nebula candidate CXO J192318.5+1403035 from Koo et al. (2005, the location is indicated on Figs. 6a-d), but it is not clear if it arises from a distinct source compared to the overall diffuse SNR emission. Similar to the 400 cm emission, there is a lack of strong soft X-ray emission toward the southern portions of the W51B H ii region complex. In Fig. 6d we also indicate the region in which strong TeV emission was detected by the MAGIC telescope (Aleksić et al., 2012).
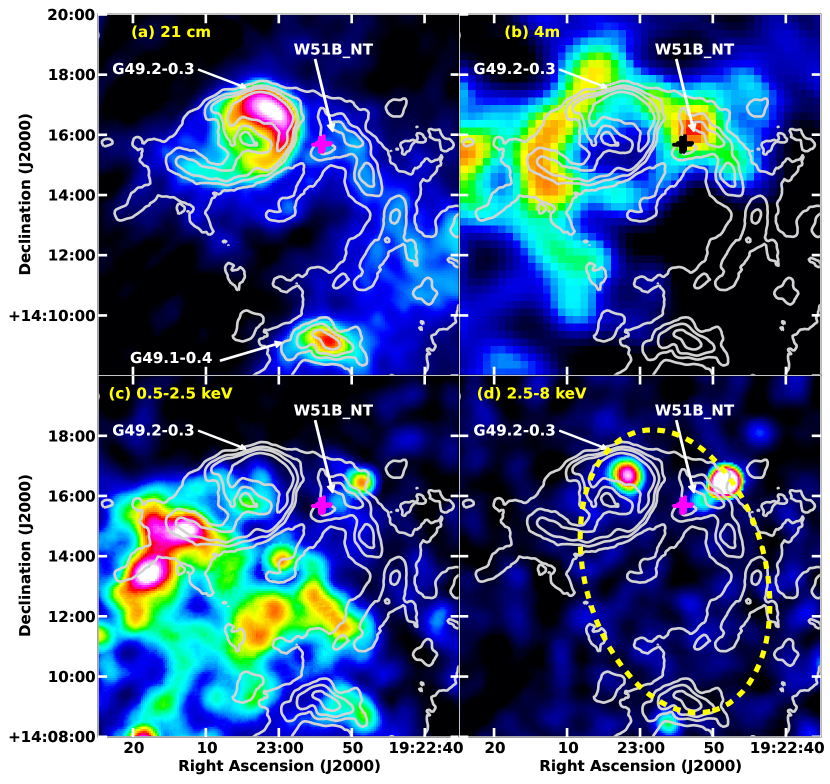
A zoomed in view of the 21 cm continuum emission in the vicinity of G42.90.3 and W51B_NT is shown in Figure 7a at resolution. For comparison, the 400 cm emission and archival soft and hard X-ray emission from Chandra (see Koo et al., 2005) of the same field are shown in Figures 7b, c, and d. These images show the coincidence of 21, 90, and 400 cm emission toward W51B_NT, as well as the presence of a faint hard X-ray source at this position. Unfortunately, this emission is too weak to extract a useful spectrum. The nature of the stronger hard X-ray source to the NW of W51B_NT is unknown. After accounting for the background contribution we estimate integrated flux densities for W51B_NT (defined by the 90 cm 0.15 Jy beam-1 contour shown in Fig. 6a, though it is partially obscured by the maser symbol) of 0.5, 1.3, and 0.6 Jy at 400 cm, 90 cm, and 21 cm, respectively. The uncertainty of these flux densities are dominated by the background estimate, and are not accurate to better than Jy. The low 400 cm flux density is almost certainly a result of free-free absorption along this complex line-of-sight (see for example Brogan et al., 2005). The 21 and 90 cm flux densities imply a non-thermal radio spectral index of ().
Other groups have searched for possible non-thermal sources in the W51 complex. In particular, Moon & Koo (1994) used the Bonn 11 cm Galactic plane survey (resolution ) along with IRAS 60 m images to disentangle the thermal and non-thermal components of W51. Though uncertain with respect to absolute flux densities, their resulting images show the well-known thermal sources in W51A and W51B as well as the non-thermal W51C SNR. Interestingly, they also see evidence for a non-thermal source west of the G49.2-0.3 H ii region. More qualitative evidence for the existence of non-thermal emission in the vicinity of W51B_NT was presented by Copetti & Schmidt (1991) at 151 MHz with a resolution of with a double source detected near G49.2-0.3 with a separation of a few arcminutes (note that the published declination scale of the 151 MHz image must be displaced to the south by 5 arc min Subrahmanyan & Goss, 1995). Though suggestive, these early data have too poor an angular resolution to be useful in the current analysis.
3.3 Thermal Molecular Gas Properties
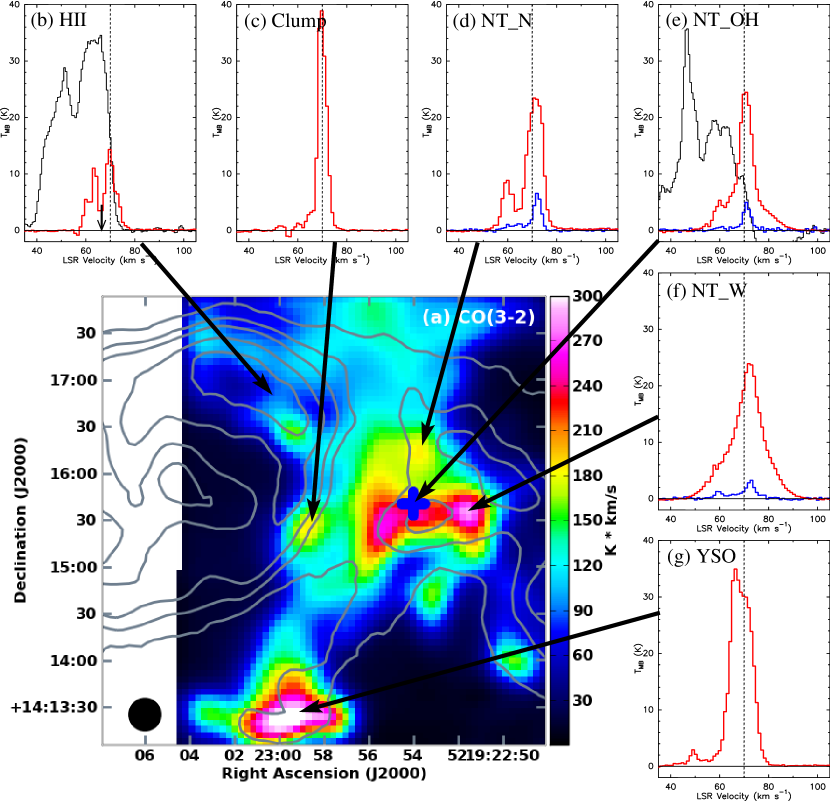
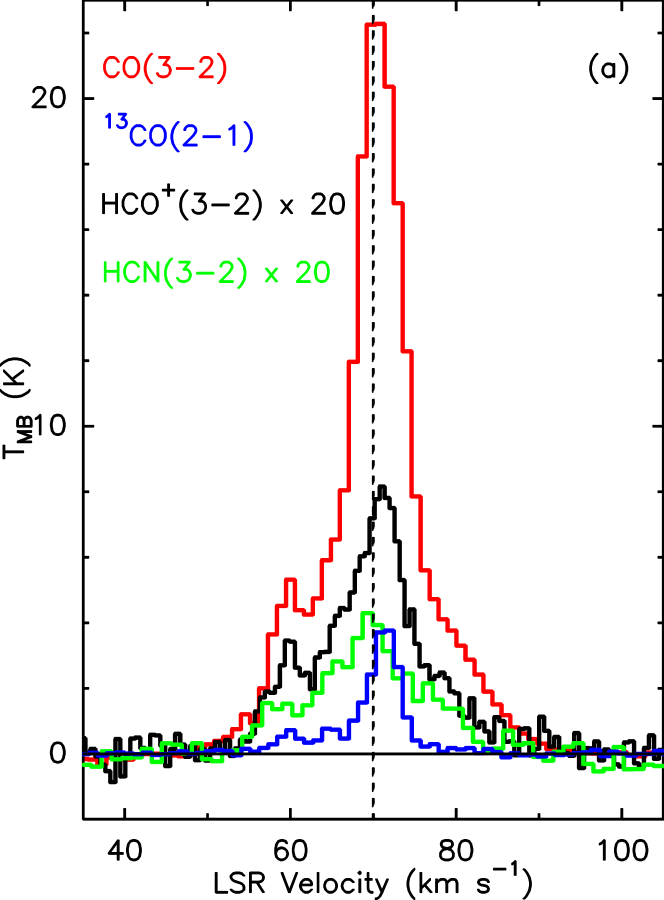
The JCMT CO(3–2) integrated intensity from 40 to 95 km s-1 with a resolution of is shown in Figure 8a. Representative spectra are shown in Figs. 8b-g), and where observed, the 13CO(2–1) spectra are also shown (Figs. 8d-f). From these data we find that CO emission partially encircles W51B_NT with the strongest emission along the eastern and southern boundaries. This enhanced CO(3–2) emission is coincident with the locations of the OH (1720 MHz) masers which are located towards the SE corner of the W51B_NT source (Fig. 8e, profile “NT_OH” is taken from the maser location). The spectra in the W51B_NT region (Figs. 8d, e, f) show at least three components: (I) a narrow ( km s-1), but strong feature K at km s-1; (II) a broad ( km s-1 wide) feature with a strength of K also centered around 70 km s-1; and (III) a narrow ( km s-1), weak blue-shifted feature at 60 km s-1. The appearance of the dramatically broadened component (II) in the vicinity of W51B_NT is strongly indicative of a shock. The CO throughout the mapped region has an average peak velocity of about 70 km s-1 ( km s-1), in agreement with components (I) and (II) toward the masers. Thus, while the broad velocity width observed toward the W51B_NT region is exceptional, it does not appear that the W51B_NT region arises from a distinct cloud along the line of site, but is co-distant with the nearby H ii regions like G49.20.3. Additionally, the velocities of the narrow and broad CO components at 70 and 71 km s-1, respectively, are in excellent agreement with the range of OH (1720 MHz) maser velocities (69-72 km s-1; see Table 2).
Other features of note in the full CO(3–2) raster (see Fig. 8b-g): (i) the emission associated with the G49.20.3 H ii region is comparatively weak and is composed of two main components that bracket the radio recombination line velocity from Lockman (1989) of 67.2 km s-1. (ii) Along the SW rim of the H ii region is a compact “clump” with the strongest CO(3–2) emission in the mapped region (40 K), but with narrow (4 km s-1) line widths. (iii) The southernmost CO(3–2) clump labelled “YSO” shows evidence of bipolar outflow emission predominantly in an east-west direction, but with a third component to the north. The “YSO” source is also associated with weak 90 cm and 20 cm emission, though its appearance is unremarkable in the mid-IR. From these clues, it seems likely this source is an intermediate to massive protostar with the radio continuum arising from optically thick free-free emission.
The appearance of the CO(3–2) and 13CO(2–1) spectra toward W51B_NT, with a broad ( km s-1) component superposed on a narrow ( km s-1) feature at the LSR velocity is in good agreement with other CO(3–2) studies of SNR OH (1720 MHz) maser regions (see for example Frail & Mitchell, 1998; Reach et al., 2002). To facilitate comparison of all four observed thermal molecular line species, we convolved the JCMT CO(3–2) and 13CO(2–1) cubes to resolution to match the CSO HCN(3–2) and HCO+(3–2) data. Spectra of all four species at this resolution toward the centroid of the OH maser location are shown in Figure 9a, and the parameters from Gaussian fits using the CASA task specfit are given in Table 3.
4 DISCUSSION
4.1 Physical Conditions in the Pre- and Post-shock Gas
Using the resolution fitted parameters at the OH maser position (Table 3), we ran the RADEX radiative transfer code (van der Tak et al., 2007) with the LAMDA molecular data files (Schöier et al., 2005) to simultaneously model the CO(3–2) and 13CO(2–1) line strengths and thereby estimate the physical parameters of the pre-shock and post-shock gas. Because these two lines trace somewhat different excitation conditions, combining observations of both lines helps to constrain the possible densities and temperatures present. We chose the slab option in RADEX as it is the most appropriate geometry for both a shock and a molecular cloud filament. We ran grids of RADEX models over density and temperature for a range of plausible column densities, while assuming N(CO)/N(H2) and an isotopic abundance of 12C/13C=60 (Milam et al., 2005). The H2 column densities and corresponding densities and kinetic temperatures that simultaneously produce CO(3–2) and 13CO(2–1) antenna temperatures that match the observed spectra are plotted in Fig.9b. Next we used RADEX to determine what abundance of HCN(3–2) and HCO+(3–2) would be required to produce the observed intensities of these high density tracers at the densities and kinetic temperatures derived from the CO observations.
Figure 9b summarizes the results for the four species modeled. In the lower left corner of Fig. 9b, the sequence of points of varying H2 column density (from to cm-2) indicate the conditions that reproduce the observed line profiles in the pre-shock gas, with kinetic temperatures ranging from 26 to 32 K and H2 densities of 850 to 4000 cm-3. The corresponding HCO+ and HCN line strengths are consistent with abundances of , which are typical of the values seen in massive star formation regions (Doty et al., 2002, and references therein).
We can compare the pre-shock column densities derived from the RADEX analysis with those estimated from previous millimeter continuum and X-ray observations toward this region. W51B_NT is not detected at 1.1 mm in the resolution Bolocam Galactic Plane Survey (the H ii region G49.2-0.3 is detected; see Aguirre et al., 2011, for Survey details). The upper limit measured in the vicinity of W51B_NT is about 0.36 mJy beam-1 after multiplying by the 1.5 flux density correction factor recommended by Aguirre et al. (2011). Assuming the dust temperature is about K in the pre-shock gas, a dust to gas ratio of 100, and a dust opacity of 0.0114 cm2 g-1 (Ossenkopf & Henning, 1994; Aguirre et al., 2011), we find a dust-derived column density upper limit of cm-2. We can also use the results of previous X-ray observations toward this region to derive a lower limit. Using the Suzaku X-ray satellite, Hanabata et al. (2012) find an average total proton column density toward their Region 3, which encompasses most of W51B including W51B_NT, of cm-2. Using a combination of Arecibo and VLA H i emission and absorption data, Koo (1997) find cm-2 along the line-of-sight to the nearby H ii region G49.20.3, with of the total column originating close to the W51B region. Since K is an upper limit, represents an upper limit to the true N(HI). When compared to the X-ray derived , this suggests cm-2. Thus, the allowed range estimated from previous observations is cm-2, compared to cm-2 from the RADAX molecular line analysis.
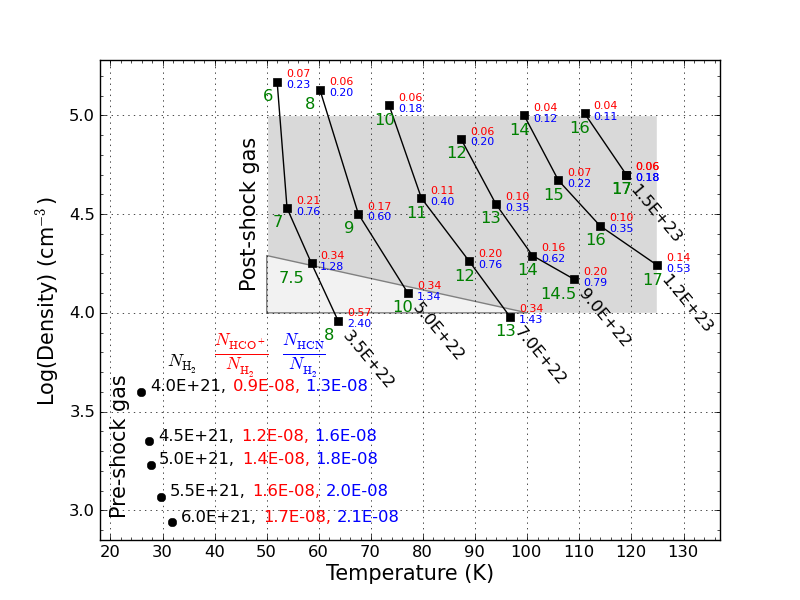
The post-shock gas is represented in the upper portion of Figure 9b, with the gray shaded rectangular region indicating the theoretical range of parameters sufficient to pump the 1720 MHz OH maser. A beam filling factor of significantly less than 1 is required to explain the low observed line strengths in the broad CO component. This result is not surprising given that the beam corresponds to a linear diameter of cm, because the width of the region of elevated temperature in a typical interstellar C-type shock is cm, depending on the ionization rate (Wardle, 1999). The HCO+ abundance is significantly lower (factors of 3-20) throughout the shaded region than its value in the pre-shock gas, suggesting a difference in chemistry. Indeed, PDR models indicate that the HCO+/CO abundance ratio drops precipitously when the ionization rate exceeds 10-15 s-1 (Ceccarelli et al., 2011). As mentioned previously, the W51B/W51C interface region is a strong emitter of -rays with properties that are consistent with a hadronic emission mechanism (see Aleksić et al., 2012, and references therein). Hewitt et al. (2009) estimate -ray and X-ray induced ionization rates of s-1 and s-1, respectively, for this region. Though dependent on many assumptions, together, the -ray plus X-ray induced ionization rate is about 30 times the local interstellar rate, and is in excellent accord with both that needed to produce an adequate abundance of OH for the masers (Wardle, 1999), and that required to lower the HCO+/CO abundance as predicted by Ceccarelli et al. (2011).
Similar to HCO+, the inferred abundance of HCN is also reduced in much of the post-shock parameter space, with the exception of the low-temperature, low-density end of the range (see Fig. 9b). While this suggests that the physical conditions in the post-shock gas may lie in this triangular region, it may be that the abundance of HCN is also altered by the shock chemistry. In any case, a range of physical conditions almost certainly exists across the shock, such that there is no single unique answer. Still these observations demonstrate that the range of expected densities and temperatures from the maser models are supported by the thermal molecular line data.
4.2 Nature of W51B_NT
First, to summarize the key multi-wavelength results: a non-thermal source of low frequency radio emission (W51B_NT) has been detected in the vicinity of the W51B OH (1720 MHz) masers. This source is partially encircled by shocked molecular gas that is coincident in space and velocity with the masers. Moreover, detailed modeling of the molecular emission indicates that the physical conditions in the pre- and post-shock gas are in good agreement with that expected from collisional pump models. It is also notable that the molecular gas associated with W51B_NT shares a similar LSR velocity with nearby H ii regions (for example G49.20.3), suggesting that the masers are co-distant with the northern members of the W51B H ii region complex. The non-thermal radio source is also coincident with a hard X-ray source and falls within the region of high likelihood for the position of TeV -ray emission, both of which have been suggested as necessary to produce enough OH abundance (from water) in C-type shocks for SNR OH (1720 MHz) maser emission. Thus, the evidence indicates that these OH (1720 MHz) masers are of the SNR/molecular cloud interaction variety.
The multi-wavelength data presented in this work suggests two possible scenarios for the nature of W51B_NT: (1) the non-thermal radio continuum emission, CO shock, OH (1720 MHz) masers, and hard X-ray emission are due to the W51C SNR, which lies close enough behind W51B for its shock wave to have hit the H ii region complex; or (2) along this crowded, tangent point line of sight there is a previously unknown small diameter () supernova remnant co-distant with the W51B H ii regions. As will be described below, option (1) seems the most consistent with the full range of data available for this region.
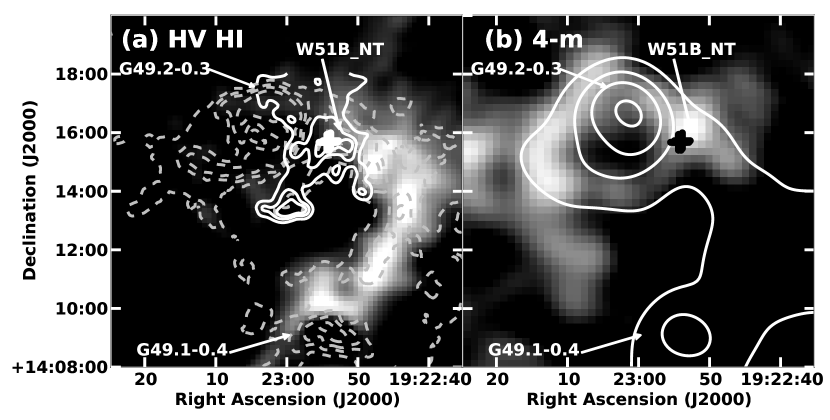
It is clear from both 4m and soft X-ray absorption that the W51B H ii region complex lies at least partially in front of the W51C SNR. The key uncertainty is whether W51B is close enough to W51C for the SNR’s shock front to have reached its back side. In addition to the presence of W51B_NT and the OH (1720 MHz) masers, there is further evidence that the W51C SNR is interacting with much of the northern end of W51B. For example, Koo (1997) report a filamentary arc of high velocity (HV), shocked H i emission at velocities between km s-1 toward the northern section of W51B. This arc of emission begins just west of W51B_NT, curves around to the south, and ends just north of the H ii region G49.10.4. Figure 10a shows the morphology of the HV H i compared to the 90 cm continuum; the CO(3–2) emission from the smaller field of view imaged with the JCMT is also shown. The arc of the filament matches very closely with the morphology of the 90 cm continuum emission in this region. Koo & Moon (1997) also find HV CO(1–0) emission roughly co-spatial with the HV H i (most of the HV CO(1–0) is outside the field of view of the CO(3–2) JCMT data, see Fig. 10a). These authors suggest that the HV gas is tracing a shock interaction between the W51C SNR and the molecular gas associated with the (foreground) W51B complex of H ii regions. Indeed, the HV H i does appear to lie along the transition between the unabsorbed 400 cm SNR emission and the large scale filamentary molecular cloud associated with the W51B complex – the CO filament is roughly coincident with the Spitzer 8 m emission shown in Fig. 6a, b (see for example Koo, 1999; Bieging et al., 2010). Koo (1997) finds that the properties of the HV H i shock are consistent with a dissociative J-type shock, and further postulate that the post-shock gas is mostly atomic since the HV H i column density is quite high. Therefore, the non-detection of HV H i toward W51B_NT is not surprising since it is spatially coincident with the OH (1720 MHz) masers that are thought to arise in non-dissociative C-type shocks (Wardle, 1999).
Another piece of evidence indicating a more extensive interaction is the morphology of the 400 cm emission. In particular, the non-thermal 400 cm emission appears to both encircle and partially overlap with the G49.20.3 H ii region emission as defined by the shorter wavelength 21 cm image (see Figs.7a,b). As described, for example, in Brogan et al. (2005) and Nord et al. (2006), relatively little thermal ionized gas is required to absorb 400 cm emission so it would be surprising to detect such low frequency emission in the direction of a foreground H ii region. This expectation can be quantified by comparing an estimate of the 400 cm free-free continuum opacity from the H ii region with the observed 400 cm emission. The 400 cm opacity was calculated by first convolving the C+D 21 cm continuum image to the 400 cm image resolution of , and then converting this image to brightness temperature. Next the was calculated from assuming an electron temperature of 10,000 K, and then extrapolated to using . Using this method, we find a peak 400 cm opacity of 22.5 with extending well into the observed 400 cm emission, see Figure 10b. Of course, in reality the within the H ii region is unlikely to be constant, but the relatively high assumed value yields a lower limit to . The strongest observed 400 cm emission is on the eastern side of W51C at 1.35 Jy beam-1 (see Fig. 1b). Since it seems unlikely that the unabsorbed 400 cm emission underlying the H ii region is significantly brighter than this intensity, we take it to be an upper limit to the unabsorbed 400 cm non-thermal emission toward G49.20.3. When this assumption is coupled with the rms noise of the 400 cm image of 0.3 Jy beam-1, we find that lines of sight with would be undetectable if the H ii region lies entirely in front of the 400 cm non-thermal emission. However, as demonstrated in Fig. 10b detectable 400 cm emission is observed toward regions with up to ! This analysis suggests, as does the morphology, that in fact the W51C SNR has partially enveloped the G49.20.3 H ii region.
Interestingly, from analysis of the optical extinction toward the W51B region, Han (2001) found that the northern half of W51B is more heavily extincted than the south/southwestern end. Since the total molecular column density is actually larger to the SW, these authors (also see Koo, 1999) suggest that the northern end of W51B is tilted deeper into the cloud than the south/southwestern end, placing it closer to W51C. From all of these comparisons it seems clear that the W51C SNR is interacting with the northern part of the W51B H ii region complex.
4.3 Constraints on Magnetic Field Direction
As a shock propagates, the gas is compressed in the direction the shock is moving and the component of the magnetic field parallel to the shock front will be amplified. For collisionally pumped maser emission it is further expected that the shock must be moving more or less perpendicular to our line-of-sight in order to assure adequate velocity coherence, and column density along the line-of-sight. Thus, collisionally pumped masers like OH (1720 MHz) masers associated with SNRs and Class I CH3OH masers are always found near the systemic velocity. These two facts together imply that the magnetic field vector is oriented somewhere in the plane perpendicular to the direction the shock front is moving, and we are viewing that shock front edge-on. Using this as the starting geometry, one would like to use the polarization measurements to constrain the direction of the magnetic field vector and the value of in the equation.
Maser propagation theory (see e.g. Elitzur, 1998, 1996; Watson & Wyld, 2001) suggests that the observed percentage of linear polarization is a strong function of the angle between the line-of-sight and the magnetic field vector . Indeed, for the observed should be zero (it is also zero for ). Away from the critical angles of and , is non-zero, though its magnitude is a strong function not only of , but also the saturation level of the maser and to some extent to the angular momentum of the molecular state that is masing. The brightness temperatures of OH (1720 MHz) masers K, along with the lack of significant variability are consistent with at least a moderate degree of saturation (also see additional arguments in Brogan et al., 2000; Hoffman et al., 2005a, b). Assuming moderate saturation, according to the model of Watson & Wyld (2001), for a J=2–1 state, is expected to be within about to , with positive values corresponding to and negative values corresponding to . If is known, this model can also be used to constrain the parameter (which may depend on ) in the Stokes V conversion to magnetic field strength. For small values of and moderate saturation, (Z=the Zeeman coefficient, and is the total field strength) with no dependence, i.e. and hence . Currently, no detailed analysis is available for the J=3/2 OH (1720 MHz) transition, though it would likely be qualitatively similar to the J=2–1 case (private communication, William Watson 2005). This suggests that given the small measured values of and (i.e. Stokes U is consistent with zero intensity and Stokes Q is positive) for W51_1 and W51_2, . Unfortunately, unless a maser polarization model is created for the J=3/2 OH (1720 MHz) transition a more quantitative analysis is not be possible.
A maser’s linear polarization position angle can be either parallel or perpendicular to the magnetic field in the plane-of-the-sky . However, maser theories also predict that for , (see e.g. Elitzur, 1998; Watson & Wyld, 2001). As mentioned above, we expect that lies parallel to the plane of the shock front (perpendicular to its direction of motion), and in principle the orientation of the shock front itself can be discerned from the morphology of the shocked CO(3–2) emission. Although there is significant confusion from quiescent gas at the LSR velocity of the W51B molecular cloud ( km s-1), the CO(3–2) emission from the wings of the broad component (see Fig. 8e, f) appears to be oriented East-West. This is also apparent from the CO(3–2) integrated intensity image (Fig. 8a) which is dominated by the broad component. An East-West orientation for the molecular shock front is approximately perpendicular to that found for the linear polarization position angle (see §3.2.1; Fig. 2a). This result is in good agreement with the expectation described above based on that and hence we have . The situation where is perpendicular to the shock front is also seen in W28 but the opposite orientation is observed for W44 (Hoffman et al., 2005a, b). The fact that some sources fall into the case and some the breaks the uncomfortable coincidence pointed out by Brogan et al. (2000) that since all SNR OH (1720 MHz) masers have linear polarization percentages of they could all have essentially the same which is extremely unlikely.
A final consideration is whether the observed represents the true polarized intensity. The observed polarized intensity could be a lower limit to the true intensity, owing to the factors mentioned by Brogan et al. (2000), including including Faraday depolarization and tangling of the magnetic field lines within the masing region. Those authors found that the Faraday depolarization length is only about three times larger than the estimated maser gain length of about cm (Lockett et al., 1999). The similarity of the gain and Faraday depolarization lengths suggests that Faraday depolarization is possible, but the new data do not allow further insight on this issue. Luckily even in the presence of Faraday depolarization the net polarization P.A. is not expected to change (Elitzur, 1992). We can now exclude the second possibility down to sizescales of cm (i.e. 10 mas at 6 kpc) based on the fact that across 4 orders of magnitude in beam area from VLA to VLBA resolution the observed Zeeman line splitting did not increase (except as consistent with spectral blending) as would be expected if the magnetic field were tangled on small size scales.
5 SUMMARY & CONCLUSIONS
We have presented a wide range of new data toward the W51C SNR and the W51B H ii region complex. Using MERLIN and the VLBA we have spatially resolved the OH (1720 MHz) masers in this region and explored their magnetic field properties, establishing that (1) the magnetic field strengths range from 1.5 to 2.2 mG (using the thermal Zeeman equation); (2) the field strengths do not increase with angular resolution (except where features were spatially unresolved and spectrally blended by previous, lower-resolution observations) suggesting the field is relatively smooth on these scales; (3) the maser spots sizes are relatively large compared to H ii region masers, with linear dimensions of cm or AU at 6 kpc and brightness temperatures of K; (4) the linear polarized intensities are a few percent and the position angle of the linear polarization is nearly zero; and (5) the linear polarization properties suggest that the angle between the magnetic field vector and the line-of-sight is , and that the difference between the magnetic field strengths measured using the thermal equation and the total field strength is likely to be small. More quantitative analysis requires a detailed polarization model for the J=3/2 case.
We have presented the most sensitive, highest angular resolution long wavelength images of this region to date at 90 cm and 400 cm observed with the VLA showing the non-thermal radio continuum emission from the W51C SNR with unprecedented detail. These data reveal (1) the presence of non-thermal radio continuum emission in the vicinity of the OH (1720 MHz) masers, which we denote W51B_NT; (2) that the W51B H ii region complex must lie in front of the W51C SNR in agreement with previous soft X-ray observations; and (3) that the nearby H ii region G49.20.3 ( east of the masers) has been at least partially enveloped by the W51C SNR by comparing the expected versus observed 400 cm absorption. Through comparison with previous X-ray data, we also find that a source of hard X-rays is coincident with W51B_NT, though the signal is too faint to model the spectrum.
Using observations of CO(3–2), 13CO(2–1), HCO+(3–2), and HCN(3–2) in the vicinity around the OH (1720 MHz) masers, we have discovered a ring of shocked gas partially encircling the non-thermal emission of W51B_NT, coincident spatially and kinematically with the OH (1720 MHz) masers. Radiative transfer modeling of the physical conditions in the narrow velocity, unshocked gas yields a column density of cm-2, a density of cm-3, and a temperature of 26-32 K. The broad velocity, shocked gas is significantly smaller than the beam leading to a range of possible column densities ( cm-2) and hence physical conditions, but the most likely density and temperatures are cm-3 and 50-100 K, consistent with the passage of a C-shock.
References
- Abdo et al. (2009) Abdo, A. A., Ackermann, M., Ajello, M., et al. 2009, ApJ, 706, L1
- Aguirre et al. (2011) Aguirre, J. E., Ginsburg, A. G., Dunham, M. K., et al. 2011, ApJS, 192, 4
- Aleksić et al. (2012) Aleksić, J., Alvarez, E. A., Antonelli, L. A., et al. 2012, A&A, 541, A13
- Benjamin et al. (2005) Benjamin, R. A., et al. 2005, ApJ, 630, L149
- Bieging et al. (2010) Bieging, J. H., Peters, W. L., & Kang, M. 2010, ApJS, 191, 232
- Brogan et al. (2005) Brogan, C. L., Lazio, T. J., Kassim, N. E., & Dyer, K. K. 2005, AJ, 130, 148
- Brogan et al. (2004) Brogan, C. L., Devine, K. E., Lazio, T. J., Kassim, N. E., Tam, C. R., Brisken, W. F., Dyer, K. K., & Roberts, M. S. E. 2004, AJ, 127, 355
- Brogan et al. (2000) Brogan, C. L., Frail, D. A., Goss, W. M., & Troland, T. H. 2000, ApJ, 537, 875
- Castro & Slane (2010) Castro, D., & Slane, P. 2010, ApJ, 717, 372
- Ceccarelli et al. (2011) Ceccarelli, C., Hily-Blant, P., Montmerle, T., et al. 2011, ApJ, 740, L4
- Claussen et al. (2002) Claussen, M. J., Goss, W. M., Desai, K. M., & Brogan, C. L. 2002, ApJ, 580, 909
- Claussen et al. (1999) Claussen, M. J., Goss, W. M., Frail, D. A., & Desai, K. 1999, ApJ, 522, 349
- Claussen et al. (1999b) Claussen, M. J., Goss, W. M., Frail, D. A., & Seta, M. 1999, AJ, 117, 1387
- Claussen et al. (1997) Claussen, M. J., Frail, D. A., Goss, W. M., & Gaume, R. A. 1997, ApJ, 489, 143
- Copetti & Schmidt (1991) Copetti, M. V. F., & Schmidt, A. A. 1991, MNRAS, 250, 127
- Doty et al. (2002) Doty, S. D., van Dishoeck, E. F., van der Tak, F. F. S., & Boonman, A. M. S. 2002, A&A, 389, 446
- Elitzur (1976) Elitzur, M. 1976, ApJ, 203, 124
- Elitzur (1998) Elitzur, M. 1998, ApJ, 504, 390
- Elitzur (1996) Elitzur, M. 1996, ApJ, 457, 415
- Elitzur (1992) Elitzur, M. 1992, Astrophysics and Space Science Library, 170,
- Frail (2011) Frail, D. A. 2011, Mem. Soc. Astron. Italiana, 82, 703
- Frail et al. (1996) Frail, D. A., Goss, W. M., Reynoso, E. M., et al. 1996, AJ, 111, 1651
- Frail & Mitchell (1998) Frail, D. A., & Mitchell, G. F. 1998, ApJ, 508, 690
- Green et al. (1997) Green, A. J., Frail, D. A., Goss, W. M., & Otrupcek, R. 1997, AJ, 114, 2058
- Han (2001) Han, S. W. 2001, Master’s thesis, Seoul National University.
- Hanabata et al. (2012) Hanabata, Y., Sawada, M., Katagiri, H., Bamba, A., & Fukazawa, Y. 2012, arXiv:1212.1993
- Hewitt et al. (2008) Hewitt, J. W., Yusef-Zadeh, F.& Wardle, M. 2008, ApJ, 683, 189
- Hewitt & Yusef-Zadeh (2009) Hewitt, J. W., & Yusef-Zadeh, F. 2009, ApJ, 694, L16
- Hewitt et al. (2009) Hewitt, J. W., Yusef-Zadeh, F.& Wardle, M. 2009, ApJ, 706, L270
- Hoffman et al. (2005a) Hoffman, I. M., Goss, W. M., Brogan, C. L., & Claussen, M. J. 2005, ApJ, 627, 803
- Hoffman et al. (2005b) Hoffman, I. M., Goss, W. M., Brogan, C. L., & Claussen, M. J. 2005, ApJ, 620, 257
- Hoffman et al. (2003) Hoffman, I. M., Goss, W. M., Brogan, C. L., Claussen, M. J., & Richards, A. M. S. 2003, ApJ, 583, 272
- Jiang et al. (2010) Jiang, B., Chen, Y., Wang, J., et al. 2010, ApJ, 712, 1147
- Kolpak et al. (2003) Kolpak, M. A., Jackson, J. M., Bania, T. M., Clemens, D. P., & Dickey, J. M. 2003, ApJ, 582, 756
- Koo (1997) Koo, B.-C. 1997, ApJS, 108, 489
- Koo & Moon (1997) Koo, B.-C., & Moon, D.-S. 1997, ApJ, 485, 263
- Koo (1999) Koo, B.-C. 1999, ApJ, 518, 760
- Koo et al. (2002) Koo, B.-C., Lee, J.-J., & Seward, F. D. 2002, AJ, 123, 1629
- Koo et al. (2005) Koo, B.-C., Lee, J.-J., Seward, F. D., & Moon, D.-S. 2005, ApJ, 633, 946
- Koo et al. (1995) Koo, B.-C., Kim, K.-T., & Seward, F. D. 1995, ApJ, 447, 211
- Koralesky et al. (1998) Koralesky, B., Frail, D. A., Goss, W. M., Claussen, M. J., & Green, A. J. 1998, AJ, 116, 1323
- Lazendic et al. (2010) Lazendic, J.-S., Wardle, M. , Whiteoak, J. -B. , Burton, M.-G. , & Green, A.J. 2010, MNRAS, 409, 371
- Lockett et al. (1999) Lockett, P., Gauthier, E., & Elitzur, M. 1999, ApJ, 511, 235
- Lockman (1989) Lockman, F. J. 1989, ApJS, 71, 469
- McDonnell et al. (2008) McDonnell, K. E., Wardle, M., & Vaughan, A. E. 2008, MNRAS, 390, 49
- Méhault (2011) Méhault, J. 2011, Mem. Soc. Astron. Italiana, 82, 756
- Milam et al. (2005) Milam, S. N., Savage, C., Brewster, M. A., Ziurys, L. M., & Wyckoff, S. 2005, ApJ, 634, 1126
- Minier et al. (2002) Minier, V., Booth, R. S., & Conway, J. E. 2002, A&A, 383, 614
- Moisés et al. (2011) Moisés, A. P., Damineli, A., Figuerêdo, E., et al. 2011, MNRAS, 411, 705
- Moon & Koo (1994) Moon, D.-S., & Koo, B.-C. 1994, Journal of Korean Astronomical Society, 27, 81
- Nord et al. (2006) Nord, M. E., Henning, P. A., Rand, R. J., Lazio, T. J. W., & Kassim, N. E. 2006, AJ, 132, 242
- Ossenkopf & Henning (1994) Ossenkopf, V., & Henning, T. 1994, A&A, 291, 943
- Pavlakis & Kylafis (1996) Pavlakis, K. G., & Kylafis, N. D. 1996, ApJ, 467, 300
- Pihlström et al. (2011) Pihlström, Y. -M. ,Sjouwerman, L. -O. ,& Mesler, R. -A. 2011, ApJ, 740, 66
- Reach et al. (2005) Reach, W. T., Rho, J., & Jarrett, T. H. 2005, ApJ, 618, 297
- Reach et al. (2002) Reach, W. T., Rho, J., Jarrett, T. H., & Lagage, P.-O. 2002, ApJ, 564, 302
- Richards et al. (2011) Richards, A. M. S., Elitzur, M., & Yates, J. A. 2011, A&A, 525, A56
- Sato et al. (2010) Sato, M., Reid, M. J., Brunthaler, A., & Menten, K. M. 2010, ApJ, 720, 1055
- Schöier et al. (2005) Schöier, F. L., van der Tak, F. F. S., van Dishoeck, E. F., & Black, J. H. 2005, A&A, 432, 369
- Sjouwerman & Pihlström (2008) Sjouwerman, L. O., & Pihlström, Y. M. 2008, ApJ, 681, 1287
- Subrahmanyan & Goss (1995) Subrahmanyan, R., & Goss, W. M. 1995, MNRAS, 275, 755
- van der Tak et al. (2007) van der Tak, F. F. S., Black, J. H., Schöier, F. L., Jansen, D. J., & van Dishoeck, E. F. 2007, A&A, 468, 627
- Uchiyama et al. (2012) Uchiyama, Y., Funk, S., Katagiri, H., et al. 2012, ApJ, 749, L35
- Velusamy & Kundu (1974) Velusamy, T., & Kundu, M. R. 1974, A&A, 32, 375
- Wardle (1999) Wardle, M. 1999, ApJ, 525, L101
- Wardle & Yusef-Zadeh (2002) Wardle, M., & Yusef-Zadeh, F. 2002, Science, 296, 2350
- Watson & Wyld (2001) Watson, W. D., & Wyld, H. W. 2001, ApJ, 558, L55
- Woodall & Gray (2007) Woodall, J. M., & Gray, M. D. 2007, MNRAS, 378, L20
- Yusef-Zadeh et al. (1996) Yusef-Zadeh, F., Roberts, D. A., Goss, W. M., Frail, D. A., & Green, A. J. 1996, ApJ, 466, L25
| Parameter | Value |
|---|---|
| MERLIN OH (1720MHz) masers | |
| Date | 2002 Jan 14, 15, 18 (MMO1B06) |
| Bandwidth | 0.25 MHz |
| Spectral channels | 256 |
| Channel separation | 0.17 km s-1 |
| Velocity resolution | 0.24 km s-1 |
| Spectral line rms noisea | 5 mJy beam-1 |
| Synthesized beam | 221 mas 125 mas P.A. |
| VLBA OH (1720MHz) masers | |
| Dates | 2000 Dec 02,03, & 04 (BB129) |
| Bandwidth | 0.25 MHz |
| Spectral channels | 256 |
| Channel separation | 0.17 km s-1 |
| Velocity resolution | 0.24 km s-1 |
| Spectral line rms noisea | 9 mJy beam-1 |
| Synthesized beam | 12.5 mas mas P.A. |
| VLA 400 cm continuum | |
| Dates B-array | 2002 Jun 06 & 22 (AB1031) |
| Date C-array | 2006 Oct 24 (AB1219) |
| Bandwidth | 1.5 MHz |
| Spectral Channels | 64 |
| Continuum rms noise | 100 mJy beam-1 |
| Synthesized beam (B+C) | P.A. |
| VLA 90 cm continuum | |
| Date A-array | 2003 Aug 23 (AB1089) |
| Dates B-array | 2002 Jun 06 & 22(AB1031) |
| Dates C-array | 2002 Nov 02; 2002 Dec 13 & 30(AB1031) |
| Date D-array | 2003 Feb 08 (AB1077) |
| Bandwidth | 3.0 MHz |
| Spectral Channels | 32 |
| Continuum rms noise | 12 mJy beam-1 |
| Synthesized beam (B+C+D) | P.A. |
| Synthesized beam (A+B+C+D) | P.A. |
| VLA 21 cm continuum and H i | |
| Date C-array | 2006 Nov 13 (AB1219) |
| Date D-array (used for continuum only) | 1992 Jul (AK301) |
| Bandwidth (C) | 3.0 MHz |
| Spectral Channels (C) | 32 |
| Continuum rms noise (C+D) | 5 mJy beam-1 |
| Spectral Line rms noisea (C) | 3 mJy beam-1 |
| Synthesized beam (C+D continuum) | P.A. |
| Synthesized beam (C H i Line) | P.A. |
| JCMT 345 GHz CO(3–2) | |
| Dates | 2004 Mar 29; Apr 20-25; Jun 11 & 12 (m04ah45a2) |
| Rest frequency | 345.79599 GHz |
| Observing mode | Single sideband |
| Velocity resolution | 1.08 km s-1 |
| Primary Beam | |
| Spectral line rms noisea | 0.1 K |
| JCMT 230 GHz 13CO(2–1) | |
| Dates | 2005 Sep 22 (m05bh49c) |
| Rest frequency | 220.39868 GHz |
| Observing mode | Double sideband |
| Velocity resolution | 1.1 km s-1 |
| Primary Beam | |
| Spectral line rms noisea | 0.15 K |
| CSO HCO+(3–2) & HCN(3–2) | |
| Dates | 2012 Nov 08 |
| Rest frequencies | 265.886 & 267.558 GHz |
| Observing mode | Double sideband |
| Velocity resolution | 0.6 & 1.2 km s-1 |
| Primary Beam | |
| Spectral line rms noisea | 0.02 & 0.014 K |
| Maser Spot | Telescope | J2000 CoordinatesbbProject codes are shown after the observation date(s). | ||||||
|---|---|---|---|---|---|---|---|---|
| () | () | (km s-1) | (km s-1) | (Jy beam-1*km s-1) | (Jy*km s-1) | (mG) | ||
| W51_1 | VLAaaThe rms noise per channel measured in main beam temperature . | 72.0 (0.02) | 0.9 (0.05) | 2.6 (0.05) | 2.6 (0.05) | |||
| MERLIN | 72.018 (0.002) | 0.902 (0.004) | 1.234 (0.004) | 1.38 (0.02) | ||||
| VLBA | 19 22 53.8210 | +14 15 43.462 | 72.06 (0.01) | 0.901 (0.03) | 0.211 (0.007) | 1.05 (0.05) | ||
| W51_2 | VLAaaData from Brogan et al. (2000). | 69.1 (0.02) | 1.2 (0.05) | 6.1 (0.05) | 6.1 (0.05) | |||
| MERLIN | 69.031 (0.001) | 1.183 (0.002) | 2.939 (0.004) | 3.12 (0.02) | ||||
| VLBA_a | 19 22 54.3632 | +14 15 40.219 | 68.965 (0.002) | 1.064 (0.004) | 1.029 (0.004) | 2.07 (0.02) | ||
| VLBA_b | 19 22 54.3608 | +14 15 40.247 | 69.050 (0.004) | 0.957 (0.009) | 0.700 (0.005) | 1.20 (0.04) | ||
| TransitionaaPrior to fitting, the 12CO and 13CO spectral cubes were convolved to a beamsize of in order to match the CSO HCO+ spectrum. These fitted values were used in the modeling described in §4.1. | Component | Peak | Peak TMB | FWHM |
|---|---|---|---|---|
| (km s-1) | (K) | (km s-1) | ||
| 12CO 3–2 | narrow | 70.65 0.03 | 18.57 0.28 | 4.99 0.09 |
| broad | 70.12 0.18 | 6.72 0.26 | 18.64 0.52 | |
| blueshifted | 59.40 0.15 | 2.30 0.26 | 3.00 0.43 | |
| 13CO 2–1 | narrow | 71.05 0.07 | 4.31 0.22 | 3.20 0.20 |
| broad | 70.1aaPrior to fitting, the 12CO and 13CO spectral cubes were convolved to a beamsize of in order to match the CSO HCO+ spectrum. These fitted values were used in the modeling described in §4.1. | 0.49 0.16 | 15.47 4.43 | |
| blueshifted | 59.4bbPosition Uncertainties are mas. Only the most accurate VLBA positions are given, the VLA and MERLIN positions agree to within their individual (larger) uncertainties. | 0.43 0.18 | 3.0bbValues without uncertainties were fixed during the fit. | |
| HCO+ 3–2 | narrow | 71.03 0.16 | 0.20 0.02 | 4.4 0.5 |
| broad | 69.6 0.3 | 0.21 0.02 | 18.0 1.0 | |
| blueshifted | 59.3 0.3 | 0.07 0.01 | 3.0bbValues without uncertainties were fixed during the fit. | |
| HCN 3–2 | narrow | 69.6 0.2 | 0.07 0.01 | 1.7 0.4 |
| broad | 69.7 0.3 | 0.16 0.02 | 14.9 1.0 | |
| blueshifted | 57.4 0.4 | 0.06 0.01 | 3.0bbValues without uncertainties were fixed during the fit. |