The Central 3 kpc of NGC 5850
Abstract:
NGC 5850 is a nearby early type spiral galaxy classified as LINER. It is considered as a prototype double-barred system. Our optical Integral Field Spectroscopic (IFS) data of the central of NGC 5850 show extended LINER-like emission which we ascribe to the presence of a hot and evolved stellar population, possibly together with a faint AGN. Additionally NGC 5850 shows extended ‘composite’ ionization patterns, likely to stem from a mixture of LINER-like ionization and photoionization by star formation. The kinematics of the gas deviates strongly from a simple rotational structure.
1 Introduction
Low Ionization Nuclear Emission Region (LINER) [1] galaxies have caused controversy for decades. The low luminosity of these objects could principally come from compact stellar populations in their centers [2]. Since active galactic nuclei (AGN) are commonly objects of high luminosity with strong ionization features, this raises the question whether LINERs represent the low luminosity part of the family of active galactic nuclei (LLAGN) or are not AGN at all. Not only the low luminosity poses a challenge. The typical emission line ratios of LINERs do not allow an unambiguous identification of the ionization mechanism without any additional information. The line ratios can be produced as well by shocks [3], cooling flows [4] or post-AGB stars [5]. Unresolved point sources can produce extended emission as well [6] making it even more complicated to distinguish between photoionization by an AGN or by other mechanisms. Consequently, the role of LINERs in the context of AGN evolution is not clear yet.
Here, we present the results of the analysis of the VIMOS IFU observations of the central of the LINER galaxy NGC 5850. We examine present ionization mechanisms and look for signs of AGN feeding and feedback. NGC 5850 is a nearby prototype double-barred early-type spiral galaxy (e.g. [7]), with a position angle of [8] and inclined by . The large scale (primary) and the inner (secondary) bar differ in their P.A. by degrees, with and [9]. Instead of a secondary bar, [11] proposed the presence of gaseous polar disk. They also found the core region to be kinematically decoupled (see also [12]). [10] report the possibility of a high velocity encounter with NGC 5846 ago. The X-ray luminosity is low indicating a low activity level of the AGN. Therefore, [13] did not consider it likely to be AGN dominated. Radio observations were performed by [12], [14] and [15]. The latter conclude on a star formation dominated core.
2 Morphology
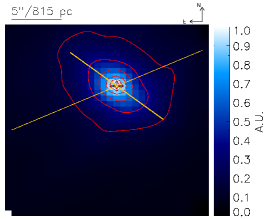
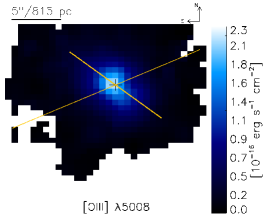
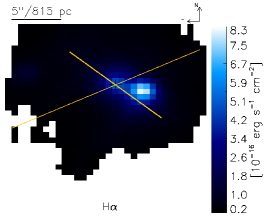
In Fig. 1 we present several emission line maps. The continuum image derived from our observations is elongated along the major axis of the secondary bar whose P.A. is given by by [9] in agreement with our own elliptical fits. The continuum intensity peaks in the center. The [OIII] emission line intensity shows similar structures. In contrast, the H emission has a clear secondary peak located off-core at a distance of , indicating an HII region. A third very weak H peak can be found far east () of the center. The H emission line map confirms these structures. The emission line maps of [NII] and [SII] (not shown here) are similar to [OIII] but expose a small additional contribution at the location of the central HII-region.
3 Kinematics
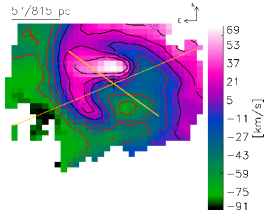
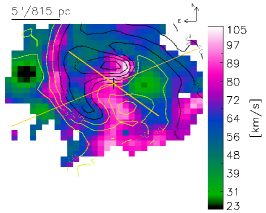
The H line of sight velocity (LOSV) map in the left panel of Fig. 2 is characterized by a strong spiral-like structure. The positive and negative velocity peaks can be found north-east and south-west of the center, respectively. The kinematic influence of the secondary bar is indicated by the typical s-shape of the isovelocity contours in the center. Furthermore, the distinctiveness of the kinematics within the radius of the secondary bar compared to more distant regions implies the core to be largely kinematically decoupled.
The H LOSV dispersion map (right panel of Fig. 2) is relatively flat. However, on one hand it exposes low values at the locations of HII-regions as expected for star-forming regions. On the other hand the high values follow the steep velocity gradients. This is likely due to beam smearing, an effect caused by insufficient spatial resolution. Nevertheless, a contribution from slow shocks cannot be ruled out.
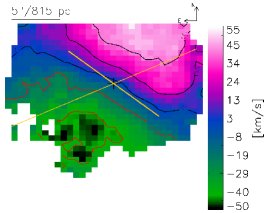
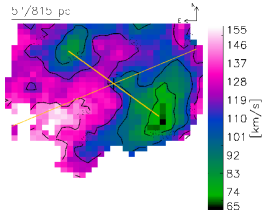
In the left panel of Fig. 3 we present the stellar LOSV map as derived by the stellar population synthesis code STARLIGHT [19]. It is characterized by almost only rotational properties with hardly any influence of the secondary bar, implying the inner bar to be mostly gaseous. The stellar LOSV dispersion map confirms the detection of the so-called ‘-hollows’ [18], regions close to the tips of the secondary bar with low stellar LOSV dispersion values. They ascribe this to a contrast effect between bulge and bar.
4 Excitation
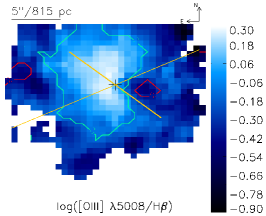
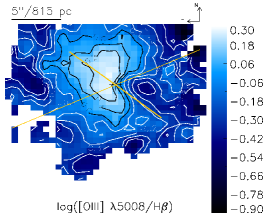
The ionized gas within the FOV is largely classed as ‘composite’ and ‘LINER-like’ in terms of diagnostic diagrams [20, 21] and demarcation lines within them [22, 23, 24]. The emission line ratio maps in Fig. 4 show the LINER-like emission to be extended predominantly along the inner bar. This becomes especially apparent in the map. There the extension along the secondary bar is only interrupted by the presence of the central HII-region.
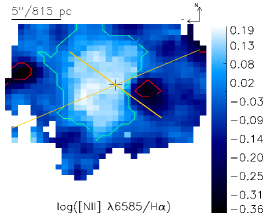
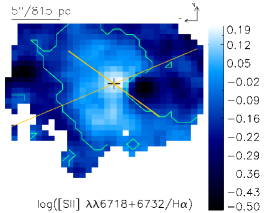
Since the LINER-like emission is strongly extended, not only a photoionizing point source like an AGN is possible but extended/distributed ionization sources can be responsible as well. Commonly, this invokes hot evolved stellar populations (post-AGB) or shocks. They can ionize the gas in such a way that it mimics the emission pattern of LINERs. [25] found empirically that the LINER-like emission from retired galaxies, whose ISM is significantly ionized by p-AGB stars, is characterized by the equivalent width of H Å. This is given throughout the complete field of view (FOV) of our observations as well, with the central starforming-region (SF) as the only exception.
Almost for sure shocks are always present in galaxies. However, the relatively flat LOSV dispersion map does not allow to estimate the contribution of slow shocks to the emission. As mentioned before, the regions of high dispersion values are coinciding with steep velocity gradients. Higher spatial resolution observations are necessary to assess their origin.
Not only the LINER-like emission is extended. Interestingly, large areas of the FOV are classed as ‘composite’. Here we believe the line ratios to be caused by a mixture of the extended LINER-like emission with low-level SF.
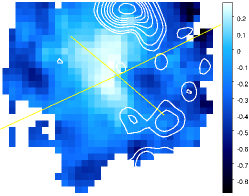
A closer look on the structure of the emission line ratio maps reveals a decrease of the line ratios radially outwards from the central SF-region. Exemplarily, we show the map with overplotted isocontour lines in the left panel of Fig. 5. Possibly the central HII-region shields the radially more distant gas from the emission originating from the center. observations do not detect strong CO concentration in this area [12] (see right panel of Fig. 5). Therefore, extinction effects seems not to play a significant role. The optical line ratios consist of emission lines spectrally close to each other and are consequently insensitive to reddening anyhow. However, mostly this feature vanishes within the uncertainties but it stays remarkable that it can be found in all three line ratio maps.
5 Conclusions
The LOSV map of the gas shows a large kinematically decoupled core (KDC). The spiral structure within the KDC is strongly twisted. This might have its origin in the lopsidedness gas distribution on galactic scale [10] and within the KDC [12]. In the center we find the s-shaped signature introduced by the gaseous secondary bar. The strong twist makes the inflow of gas towards the center a possible option and emphasizes the importance of secondary bars for AGN feeding.
The LINER-like emitting gas is extended and ionized by distributed ionization sources, presumably p-AGB stars within the secondary bar. Slow shocks might play a role as well as the possible presence of a weak AGN. We ascribe the extended composite emission to a mixture of the mentioned LINER-like emission and photoionization by low-level star formation.
References
- [1] T.M. Heckman, An optical and radio survey of the nuclei of bright galaxies - Activity in normal galactic nuclei, A&A 87 152-164
- [2] R.W. Pogge, D. Maoz, L.C. Ho and M. Eracleous, The Narrow-Line Regions of LINERS as Resolved with the Hubble Space Telescope, APJ 532 323-339
- [3] M.A. Dopita and R.S. Sutherland, Spectral Signatures of Fast Shocks. I. Low-Density Model Grid, APJS 102 161
- [4] G.M. Voit and M. Donahue A Deep Look at the Emission-Line Nebula in Abell 2597, APJ 486 242
- [5] R. Terlevich and J. Melnick Warmers - The missing link between Starburst and Seyfert galaxies, MNRAS 213 841-856
- [6] R. Yan and M.R. Blanton, The Nature of LINER-like Emission in Red Galaxies, APJ 747, 61
- [7] R. Buta and D.A. Crocker, Metric characteristics of nuclear rings and related features in spiral galaxies, AJ 105 1344-1357
- [8] G. de Vaucouleurs et al., Third Reference Catalogue of Bright Galaxies, Springer, Berlin
- [9] S. Lourenso et al., The stellar content of a prototype double barred galaxy, APSS 284 925-928
- [10] J.L. Higdon, R.J. Buta and G.B. Purcell, An optical and H I study of NGC 5850 - Victim of a high-speed encounter?, AJ 115 80
- [11] A.V. Moiseev, J.R. Valdés and V.H. Chavushyan, Structure and kinematics of candidatedouble-barred galaxies, AAP 421 433-453
- [12] S. Leon, F. Combes and D. Friedli, Single CO Peak in the Double Bar Galaxy NGC 5850, Astronomical Society of the Pacific Conference Series 197 61
- [13] G. Fabbiano, D.W. Kim and G. Trinchieri, An X-ray catalog and atlas of galaxies, APJS 80 531-644
- [14] E. Hummel et al., The effects of interactions on spiral galaxies. III. A radio continuum survey of galactic nuclei at 1.49 GHz, AAPS 70 517-530
- [15] Condon, J. J. and Cotton, W. D. and Broderick, J. J., Radio Sources and Star Formation in the Local Universe, AJ 124 675-689
- [16] García-Burillo, S. et al., Molecular Gas in NUclei of GAlaxies (NUGA). I. The counter-rotating LINER NGC 4826, AAP 407 485-502
- [17] Combes, F. et al., Molecular gas in NUclei of GAlaxies (NUGA). II. The ringed LINER NGC 7217, AAP 414 857-872
- [18] de Lorenzo-Cáceres, A. et al., Stellar Kinematics in Double-Barred Galaxies: The -Hollows, APJL 684 L83-L86
- [19] Cid Fernandes, R. et al., Semi-empirical analysis of Sloan Digital Sky Survey galaxies - I. Spectral synthesis method, MNRAS 358 363-378
- [20] Baldwin, J.A., Phillips, M.M. and Terlevich, R., Classification parameters for the emission-line spectra of extragalactic objects, PASP 93 5-19
- [21] Veilleux, S. and Osterbrock, D.E., Spectral classification of emission-line galaxies, APJS 63 295-310
- [22] Kewley, L.J. et al., Theoretical Modeling of Starburst Galaxies, AJ 556 121-140
- [23] Kewley, L.J. et al., The host galaxies and classification of active galactic nuclei, MNRAS 372 961-976
- [24] Kauffmann, G. et al., The host galaxies of active galactic nuclei, MNRAS 346 1055-1077
- [25] Cid Fernandes, R. et al., Emission-Line Taxonomy and the Nature of AGN-Looking Galaxies in the SDSS, IAU Symposium, 267 65-72