2 Department of Physics, Wellesley College, Wellesley, MA 02181, USA
3 Department of Physics and Astronomy, LaserLaB, VU University, de Boelelaan 1081, 1081 HV Amsterdam, The Netherlands
4 Department of Astronomy, University of Michigan, 500 Church Street, Ann Arbor, MI 48109-1042, USA
5 Research School of Physics and Engineering, The Australian National University, Canberra, ACT 0200, Australia
6 Max-Planck Institut für Extraterrestrische Physik (MPE), Giessenbachstr. 1, 85748 Garching, Germany
11email: li@strw.leidenuniv.nl
Photodissociation of interstellar N2
Abstract
Context. Molecular nitrogen is one of the key species in the chemistry of interstellar clouds and protoplanetary disks, but its photodissociation under interstellar conditions has never been properly studied. The partitioning of nitrogen between N and N2 controls the formation of more complex prebiotic nitrogen-containing species.
Aims. The aim of this work is to gain a better understanding of the interstellar N2 photodissociation processes based on recent detailed theoretical and experimental work and to provide accurate rates for use in chemical models.
Methods. We used an approach similar to that adopted for CO in which we simulated the full high-resolution line-by-line absorption + dissociation spectrum of N2 over the relevant 912–1000 Å wavelength range, by using a quantum-mechanical model which solves the coupled-channels Schrödinger equation. The simulated N2 spectra were compared with the absorption spectra of H2, H, CO, and dust to compute photodissociation rates in various radiation fields and shielding functions. The effects of the new rates in interstellar cloud models were illustrated for diffuse and translucent clouds, a dense photon dominated region and a protoplanetary disk.
Results. The unattenuated photodissociation rate in the Draine (1978, ApJS, 36, 595) radiation field assuming an N2 excitation temperature of 50 K is s-1, with an uncertainty of only 10%. Most of the photodissociation occurs through bands in the 957–980 Å range. The N2 rate depends slightly on the temperature through the variation of predissociation probabilities with rotational quantum number for some bands. Shielding functions are provided for a range of H2 and H column densities, with H2 being much more effective than H in reducing the N2 rate inside a cloud. Shielding by CO is not effective. The new rates are 28% lower than the previously recommended values. Nevertheless, diffuse cloud models still fail to reproduce the possible detection of interstellar N2 except for unusually high densities and/or low incident UV radiation fields. The transition of N N2 occurs at nearly the same depth into a cloud as that of . The orders-of-magnitude lower N2 photodissociation rates in clouds exposed to black-body radiation fields of only 4000 K can qualitatively explain the lack of active nitrogen chemistry observed in the inner disks around cool stars.
Conclusions. Accurate photodissociation rates for N2 as a function of depth into a cloud are now available that can be applied to a wide variety of astrophysical environments.
Key Words.:
Interstellar molecules – Astrochemistry – Molecular processes – Molecular Clouds – Protoplanetary disks1 Introduction
Nitrogen is one of the most abundant elements in the universe and an essential ingredient for building prebiotic organic molecules. In interstellar clouds, its main gas-phase reservoirs are N and N2, with the balance between these species determined by the balance of the chemical reactions that form and destroy N2. If nitrogen is primarily in atomic form, a rich nitrogen chemistry can occur leading to ammonia, nitriles and other nitrogen compounds. On the other hand, little such chemistry ensues if nitrogen is locked up in the very stable N2 molecule. The latter situation is similar to that of carbon with few carbon-chain molecules being produced when most of the volatile carbon is locked up in CO (Langer & Graedel, 1989; Bettens et al., 1995).
Direct observation of extrasolar N2 is difficult because, unlike CO, it lacks strong pure rotational or vibrational lines. N2 is well studied at various locations within our solar system through its electronic transitions at ultraviolet wavelengths (e.g., Strobel, 1982; Meier et al., 1991; Wayne, 2000; Liang et al., 2007) and a detection in interstellar space has been claimed through UV absorption lines in a diffuse cloud toward the bright background star HD 124314 (Knauth et al., 2004). In dense clouds well shielded from UV radiation, most nitrogen is expected to exist as N2 (e.g., Herbst & Klemperer, 1973; Woodall et al., 2007) but can only be detected indirectly through the protonated ion N2H+ (Turner, 1974; Herbst et al., 1977) or its deuterated form N2D+. N2H+ emission is indeed widely observed in dense cores (e.g., Bergin et al., 2002; Crapsi et al., 2005), star-forming regions (Fontani et al., 2011; Tobin et al., 2012), protoplanetary disks (Dutrey et al., 2007; Öberg et al., 2010) and external galaxies (Mauersberger & Henkel, 1991; Meier & Turner, 2005; Muller et al., 2011).
Photodissociation is the primary destruction route of N2 in any region where UV photons are present. Current models of diffuse and translucent interstellar clouds are unable to reproduce the possible detection of N2 for one such cloud (Knauth et al., 2004). One possible explanation is that the adopted N2 photodissociation rate is incorrect. Even in dense cores, not all nitrogen appears to have been transformed to molecular form (Maret et al., 2006; Daranlot et al., 2012). Observations of HCN in the surface layers of protoplanetary disks suggest that the nitrogen chemistry is strongly affected by whether or not a star has sufficiently hard UV radiation to photodissociate N2 (Pascucci et al., 2009). Thus, not only the absolute photodissociation rate but also its wavelength dependence is relevant. All of these astronomical puzzles make a thorough study of the interstellar N2 photodissociation very timely.
In contrast with many other simple diatomic molecules, the photodissociation of interstellar N2 has never been properly studied (van Dishoeck, 1988; van Dishoeck et al., 2006). The reason for this is that the photodissociation of N2, similarly to CO, is initiated by line absorptions at wavelengths below 1000 Å (1100 Å for CO), where high-resolution laboratory spectroscopy has been difficult. To compute the absolute rate and to treat the depth dependence of the photodissociation correctly, the full high-resolution spectrum of the dissociating transitions needs to be known. Because the absorbing lines become optically thick for modest N2 column densities, the molecule can shield itself against the dissociating radiation deeper into the cloud. Moreover, these lines can be shielded by lines of more abundant species such as H, H2 and CO. Until recently, accurate N2 molecular data to simulate these processes were not available. Thanks to a concerted laboratory (e.g., Ajello et al., 1989; Helm et al., 1993; Sprengers et al., 2003, 2004, 2005; Stark et al., 2008; Lewis et al., 2008b; Heays et al., 2009, 2011) and theoretical (e.g., Spelsberg & Meyer, 2001; Lewis et al., 2005a, b; Haverd et al., 2005; Lewis et al., 2008a, c; Ndome et al., 2008) effort over the last two decades, this information is now available.
In this paper, we use a high resolution model spectrum of the absorption and dissociation of N2 together with simulated spectra of H, H2 and CO to determine the interstellar N2 photodissociation rate and its variation with depth into a cloud. The effect of the new rates on interstellar N2 abundances is illustrated through a few representative cloud models. In particular, the N2 abundance in diffuse and translucent clouds is revisited to investigate whether the new rates alleviate the discrepancy between models and the possible detection of N2 in one cloud (Knauth et al., 2004). The data presented here can be applied to a wide range of astrochemical models, including interstellar clouds in the local and high redshift universe, protoplanetary disks and exo-planetary atmospheres. The 14N15N photodissociation rate and isotope selective interstellar processes will be discussed in an upcoming paper (Heays et al. in prep.) and have been discussed in the context of the chemistry of Titan by Liang et al. (2007).
2 Photodissociation processes of N2
2.1 Photoabsorption and photodissociation spectrum
The closed-shell diatomic molecule N2 has a dissociation energy of 78 715 cm-1 (9.76 eV, 1270 Å) (Huber & Herzberg, 1979), making it one of the most stable molecules in nature. Electric-dipole-allowed photoabsorption and predissociation in N2 starts only in the extreme ultraviolet spectral region, at wavelengths shorter than 1000 Å. The molecular-orbital (MO) configuration of the ground state of N2 is
| (1) |
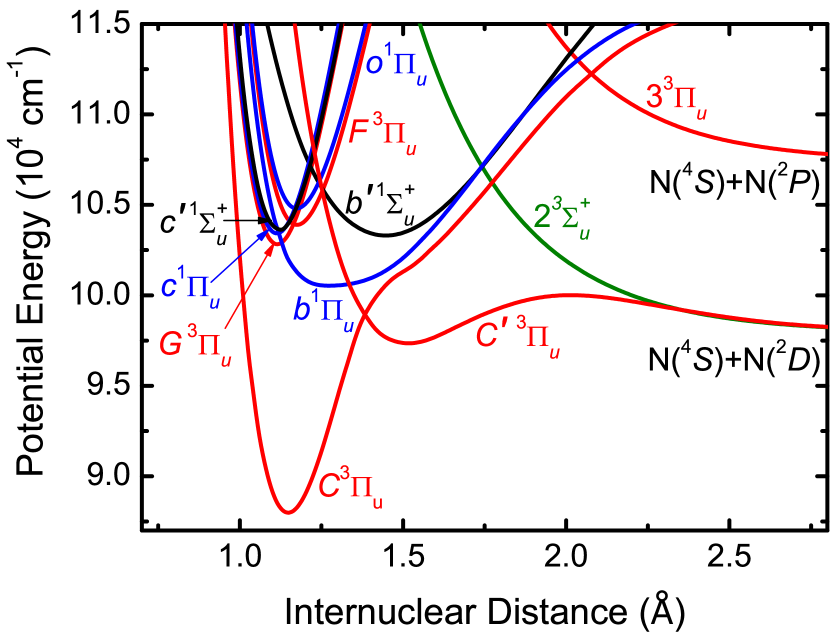
Electric-dipole-allowed transitions from the ground state access only states of and symmetry. In the region below the cutoff energy of the interstellar radiation field of 110 000 cm-1 (13.6 eV, 912 Å), five such states are accessible: the and states, and the , , and states. The , , and states (sometimes labelled , , and ; respectively) have Rydberg character, the relevant transitions corresponding to single-electron excitations from the or orbitals into a Rydberg orbital. On the other hand, the and states are valence states of mixed MO configurations accessed by transitions in which one or two electrons are excited into antibonding orbitals. The relevant potential-energy curves (PECs) for these and states are shown in Fig. 1, in blue and black, respectively. The and states, whose PECs have the smallest equilibrium internuclear distance in Fig. 1, are the first members of Rydberg series converging on the ground state of the N ion, X, while the state is the first member of the series converging on the first ionic excited state, A. In the case of the and valence states, the extended widths of the corresponding PECs in Fig. 1 are due to the aforementioned configurational mixing. In addition, there are significant electrostatic interactions within the manifolds of a given symmetry, Rydberg-valence for , and Rydberg-valence and Rydberg-Rydberg for , since the MO configurations of all of the isosymmetric states differ in exactly two of the occupied electron orbitals (Lefebvre-Brion & Field, 2004). The PECs in Fig. 1 are shown in the diabatic (crossing) representation.
Most of the rovibrational levels of the singlet excited states are predissociated, i.e., the molecule is initially bound following photoabsorption, but then dissociates on timescales of a nanosecond or less due to direct or indirect coupling to a dissociative continuum. For the states considered here, spin-orbit coupling to the strongly-coupled and -predissociated manifold (red PECs in Fig. 1), with ultimate dissociation via the state, provides the predissociation mechanism (Lewis et al., 2005a, 2008c), with a minor contribution from a crossing by the state (green PEC in Fig. 1) at higher energies. For the states, two mechanisms are important (Heays, 2011): first, a similar spin-orbit coupling to the manifold, solely responsible for predissociation in the absence of rotation, and second, rotational coupling between the and manifolds, followed by the predissociation described above. For the wavelengths considered here, as implied by Fig. 1, these mechanisms result in primarily NN dissociation products, i.e., one of the nitrogen atoms is formed in an excited electronic state which decays on a timescale of 17 h into the ground state N. This is consistent with the observations of Walter et al. (1993) who failed to detect direct NN dissociation products.
The line-by-line models previously used to compute the N2 photodissociation rate require knowledge of the wavelengths, oscillator strengths, lifetimes, and predissociation probabilities of (transitions to) all rovibrational levels associated with the coupled excited singlet states. For the case of the isoelectronic molecule CO, molecular models have been built previously by specifying the term values, rotational and vibrational constants, oscillator strengths, Einstein coefficients, and predissociation probabilities for each excited electronic state (e.g., van Dishoeck & Black, 1988; Viala et al., 1988; Lee et al., 1996; Visser et al., 2009). These have allowed the rotationally-resolved absorption spectra of CO and its isotopologues to be constructed using simple scaling relations. Such models must be validated by a large quantity of laboratory data and have been shown to be incorrect when strong interactions occur between electronic states and their differing energetics. For the case of N2, it is known that there are many wide-scale perturbations, together with rapid dependences of oscillator strengths and predissociation linewidths on rotational quantum number , and strong, irregular isotopic effects. It is impossible to fully reproduce these effects using only a few spectroscopic constants.
The best way to simulate the N2 spectrum, and the method employed here, is, at each energy, to solve the full radial diabatic coupled-channel Schrödinger equation (CSE) for the coupled electronic states described above, including all electrostatic, spin-orbit, and rotational couplings, using the quantum-mechanical methods of van Dishoeck et al. (1984). This is a physically-based technique, with great predictive powers which enables confidence in the computed spectrum in regions lacking experimental confirmation, even where perturbations are present. Furthermore, computations of isotopic spectra require only the change of a single parameter, i.e., the reduced molecular mass, in the molecular model: the results can be guaranteed since the underlying physics is the same for all isotopologues. The same cannot be said for the line-by-line models such as those employed for CO, which would also benefit from a CSE approach. The detailed CSE model for N2 employed here has been described in Heays (2011),111Available on-line at http://hdl.handle.net/1885/7360 incorporates earlier models of the (Lewis et al., 2005a; Haverd et al., 2005) and states (Lewis et al., 2008c) and has been tested extensively against laboratory data, including high-resolution spectra obtained at the SOLEIL synchrotron facility (Heays, 2011; Heays et al., 2011). A complete discussion of the CSE model and a full listing of computed spectroscopic data is deferred to Heays et al. (in prep.).
For a given rotational-branch transition, combining the excited-state coupled-channel wavefuction with the -state radial wavefunction and appropriate diabatic allowed transition-moment components yields the corresponding (continuous with wavelength) photoabsorption cross section, with the computed linewidths providing the required predissociation lifetime information. Total cross sections for a given temperature, assuming local thermodynamic equilibrium, are formed by summing the individual branch cross sections, weighted by appropriate Boltzmann and Hönl-London factors, and including rotational levels with as high as 50.
CSE photoabsorption cross sections, , are computed here over the wavelength range 912–1000 Å with a step size of 0.0001 Å, and for temperatures of 10, 50, 100, 500, and 1000 K. The Doppler broadening of the spectral lines is taken into account by convolution with a Gaussian profile having a thermal line width.
A 10% uncertainty is estimated for the total magnitude of the photoabsorption cross section and principally arises from the absolute uncertainty of the calibrating laboratory spectra (Haverd et al., 2005; Heays, 2011). The laboratory measurements in question were recorded at 300 K or below, so the uncertainty may be somewhat larger for calculations employing an extrapolation to 1000 K. Additionally, 3% of the 1000 K ground state population will be in the first vibrational level, leading to a slight redistribution of the absorption cross section into hot bands. This is considered in the model calculations.
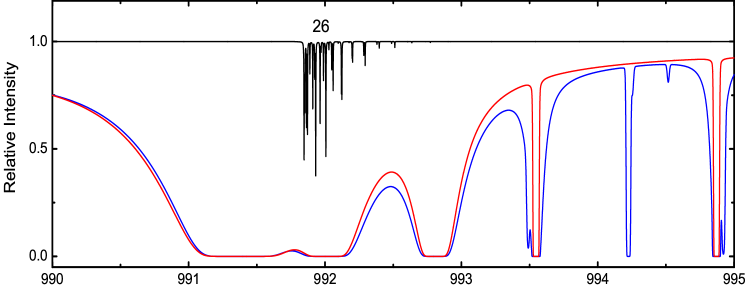
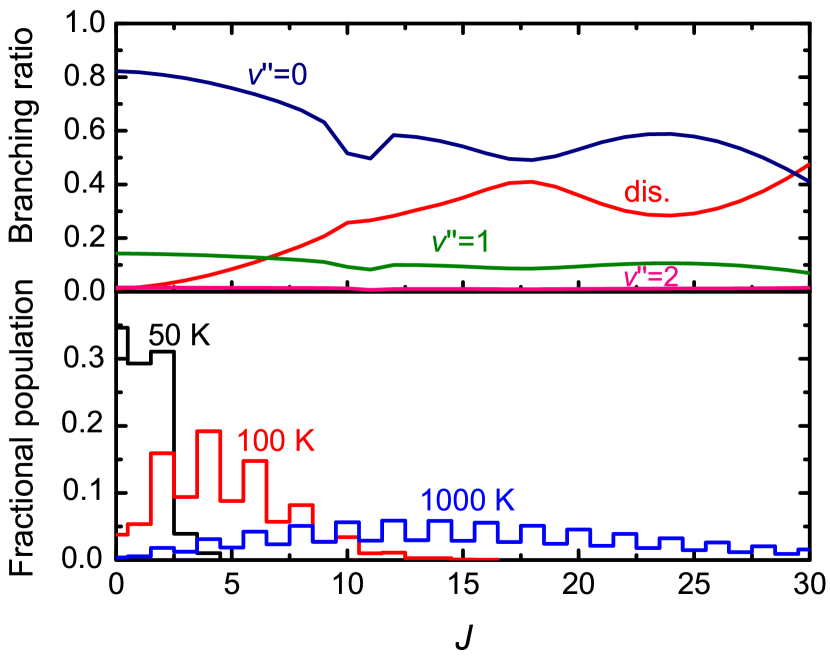
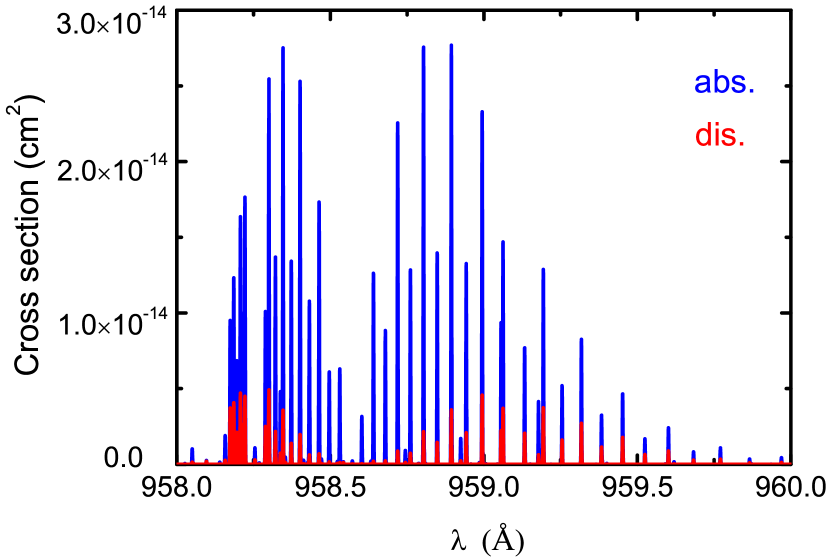
Photodissociation cross sections, =, are obtained from the photoabsorption cross sections by comparing the predissociation and radiative lifetimes for each rovibrational level. The predissociation efficiency is then given by , where is the inverse of the sum of the radiative and predissociation rates. For almost all transitions, : significant corrections for partial dissociation are needed only for the and bands near 986 and 959 Å, respectively (Lewis et al., 2005b; Liu et al., 2008; Sprengers et al., 2004; Wu et al., 2012). For example, the top panel of Fig. 2 illustrates the CSE-computed branching ratio between spontaneous emission back to the ground state and dissociation as a function of rotational level for . Such calculations were performed for all bands appearing between 955 and 991 Å. The difference between calculated absorption and dissociation cross sections for the very-strongly absorbing band is demonstrated in Fig. 3, revealing a significant alteration of the band profile once the dissociation efficiency is considered.
The bottom panel of Fig. 2 shows the thermal population for various levels of the ground vibrational state, assuming several temperatures. By comparing this with the top panel of Fig. 2 it can be seen that the dissociation fraction for this band will depend significantly on the temperature.
2.2 Photodissociation rates
The photodissociation rate, , of N2 exposed to UV radiation can be calculated according to
| (2) |
where the photodissociation cross section, , is in units of cm2 and is the mean intensity of the radiation in photons cm-2 s-1 Å-1 as a function of wavelength, , in units of Å. The unattenuated interstellar radiation field according to Draine (1978) is used in most of the following calculations and is given by
| (3) |
Inside a cloud, self-shielding, shielding by H, H2, CO and other molecules, and continuum shielding by dust all reduce the photodissociation rate below its unattenuated value . The shielding function is defined to be
| (4) |
and can be split into a self-shielding,
| (5) |
and a mutual-shielding part,
| (6) |
Here, =H, H2 or CO and is the column density of the various species. A dust extinction term, , can be written in place of the exponential term in Eq. (6) where is the optical depth in magnitudes and depends on the assumed properties of the dust. This is further discussed in § 3.3. In all cases, the integrals above are computed between 912 and 1000 Å.
3 Results
3.1 Unattenuated interstellar rate
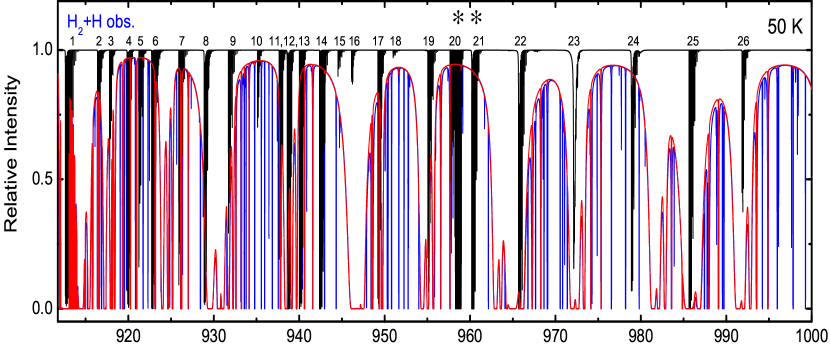
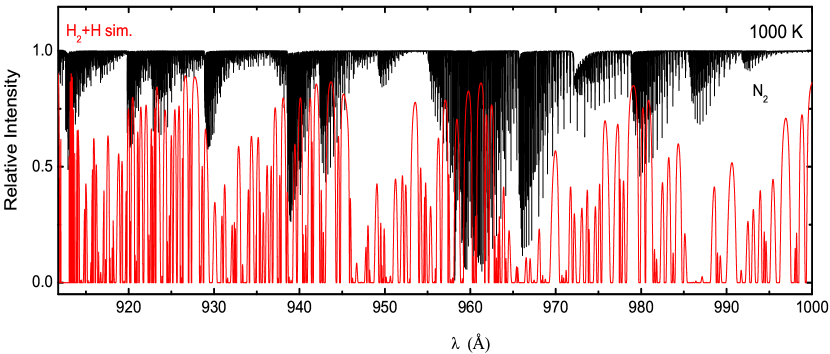
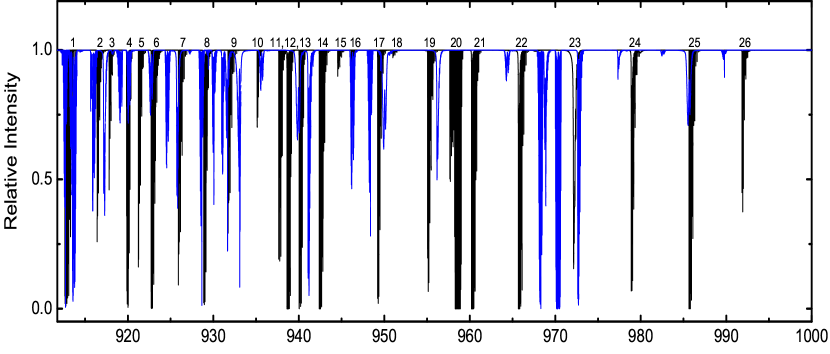
Figure 4 shows model spectra of N2 and absorption for excitation temperatures of 50 and 1000 K. At 50 K the N2 spectrum is made up of prominent well-separated bands. These represent excitation to a range of vibrational levels attributable to the five accessible electronic states. In contrast, the spectrum simulating a temperature of 1000 K includes the excitation of many more rotational levels and has few sizable windows between bands.
Unshielded photodissociation rates of N2 immersed in a Draine (1978) field were calculated from the model photodissociation cross section using Eqs. (2) and (3), and assuming a range of excitation temperatures. These are plotted in Fig. 5 and listed in Table 1. The rate at 50 K is s-1, where the uncertainty of 10% only reflects the uncertainty in the cross sections, not the radiation field (see below). This new value is 28% lower than the value of s-1 recommended by van Dishoeck (1988). The latter estimate was based on the best available N2 spectroscopy at the time, and has an order-of-magnitude uncertainty. For comparison, the unshielded photodissociation rate of N2 at low is around 35% smaller than that of CO computed by Visser et al. (2009).
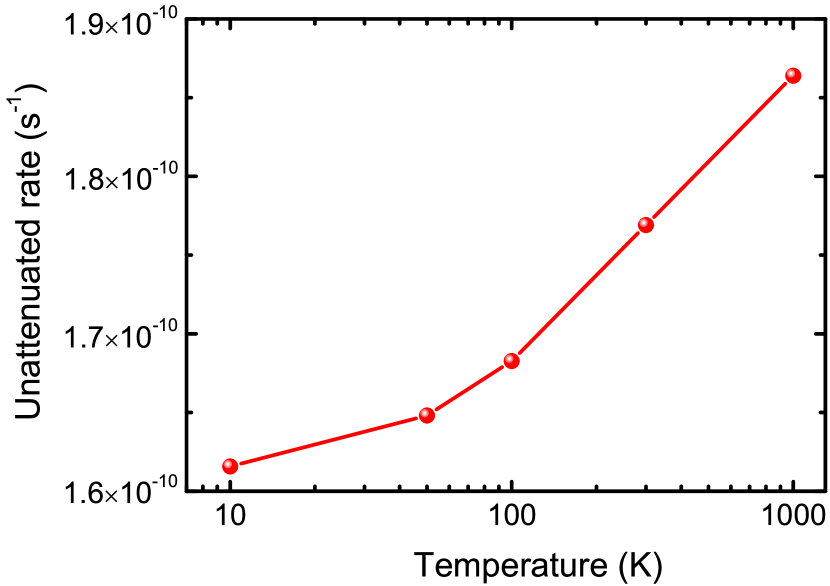
Table 2 summarizes the contributions of individual bands to the total unattenuated dissociation rate. It is seen that the main contributions arise from bands 12, 21, 22, 23 and 24. Hence, the key wavelength ranges responsible for the photodissociation of N2 are around 940 Å and between 957–980 Å.
The calculated unattenuated rate of N2 increases with increasing temperature so that the value at 1000 K, s-1, is 15% higher than for 10 K. This is largely due to a variable but overall increase with rotational quantum number of the photodissociation branching ratios of the and states. This can be seen in Fig. 2 for the state, where at 10 K all of the excited population is in levels with . These levels have a low predissociation probability and hardly contribute to the photodissociation rate. At higher temperatures, the excited population shifts to higher , and at 1000 K the distribution maximum occurs around for which the branching ratio to dissociation is much higher.
| ( K)$$$$footnotemark: | a𝑎aa𝑎aAll radiation fields have been normalised to a Draine (1978) field over the interval 912–2050 Å. (s-1) | Previous |
|---|---|---|
| 4000 | 2.18(-16) | 3.0(-16)b𝑏bb𝑏bvan Dishoeck et al. (2006) |
| 6000 | 9.96(-14) | - |
| 8000 | 1.90(-12) | - |
| 10 000 | 1.03(-11) | 1.4(-11)b𝑏bb𝑏bvan Dishoeck et al. (2006) |
| 20 000 | 1.97(-10) | - |
| Draine | 1.65(-10) | 2.3(-10)c𝑐cc𝑐cvan Dishoeck (1988) |
The rate obviously depends on the choice of radiation field. For the alternative formulations of Habing (1968), Gondhalekar et al. (1980) and Mathis et al. (1983), the unattenuated rates are , and s-1 at 50 K, respectively. Additionally, Table 1 considers the unattenuated rates of N2 assuming different blackbody radiation fields. In these calculations, the intensities have been normalized such that the integrated values from 912–2050 Å are the same as those of the Draine (1978) field. The adopted dilution factors are , , , , and for blackbody temperatures of 4000, 6000, 8000, 10 000 and 20 000 K, respectively. The value of the unattenuated rate of N2 at K (cool star) is orders of magnitude smaller than that at K (hot star), and increases steeply with stellar effective temperature. The photodissociation rate of N2 at K is comparable to that in the Draine interstellar field, s-1. The calculated photodissociation rates for temperatures of 4000 and K are close to those recommended by van Dishoeck et al. (2006).
| Excited | Edge | Center | |||
|---|---|---|---|---|---|
| Band | statea𝑎aa𝑎aThe , , and levels have symmetry; and have symmetry. | (Å) | (%) | (%) | Shielding |
| 1 | 911.7-915.1 | 2.41 | 0.07 | 0.01 | |
| 2 | 915.1-917.4 | 0.58 | 0.47 | 0.34 | |
| 3 | 917.4-919.0 | 0.09 | 0.06 | 0.30 | |
| 4 | 919.0-920.8 | 1.63 | 3.65 | 0.95 | |
| 5 | 920.8-922.4 | 0.22 | 0.51 | 0.97 | |
| 6 | 922.4-924.7 | 1.74 | 3.73 | 0.91 | |
| 7 | 924.7-927.7 | 0.33 | 0.66 | 0.84 | |
| 8 | 927.7-930.8 | 3.65 | 2.31 | 0.27 | |
| 9 | 930.8-933.9 | 0.23 | 0.10 | 0.18 | |
| 10 | 933.9-936.6 | 0.10 | 0.22 | 0.96 | |
| 11 | 936.6-938.5 | 0.47 | 0.52 | 0.47 | |
| 12 | 938.5-939.6 | 9.31 | 5.28 | 0.24 | |
| 13 | 939.6-941.5 | 1.67 | 3.47 | 0.88 | |
| 14 | 941.5-944.1 | 5.01 | 11.04 | 0.93 | |
| 15 | 944.1-945.7 | 0.03 | 0.05 | 0.77 | |
| 16 | 945.7-947.9 | 0.05 | 0.00 | 0.00 | |
| 17 | 947.9-950.6 | 1.23 | 2.00 | 0.69 | |
| 18 | 950.6-953.1 | 0.01 | 0.02 | 0.93 | |
| 19 | 953.1-956.8 | 1.04 | 0.41 | 0.17 | |
| 20 | 956.8-959.5 | 2.79 | 6.21 | 0.94 | |
| 21 | 959.5-962.9 | 17.00 | 36.80 | 0.92 | |
| 22 | 962.9-969.4 | 22.51 | 2.02 | 0.04 | |
| 23 | 969.4-976.2 | 16.05 | 0.51 | 0.01 | |
| 24 | 976.2-983.1 | 9.28 | 19.83 | 0.91 | |
| 25 | 983.1-988.9 | 1.34 | 0.00 | 0.00 | |
| 26 | 988.9-1000.0 | 1.24 | 0.05 | 0.02 |
3.2 Self-shielding
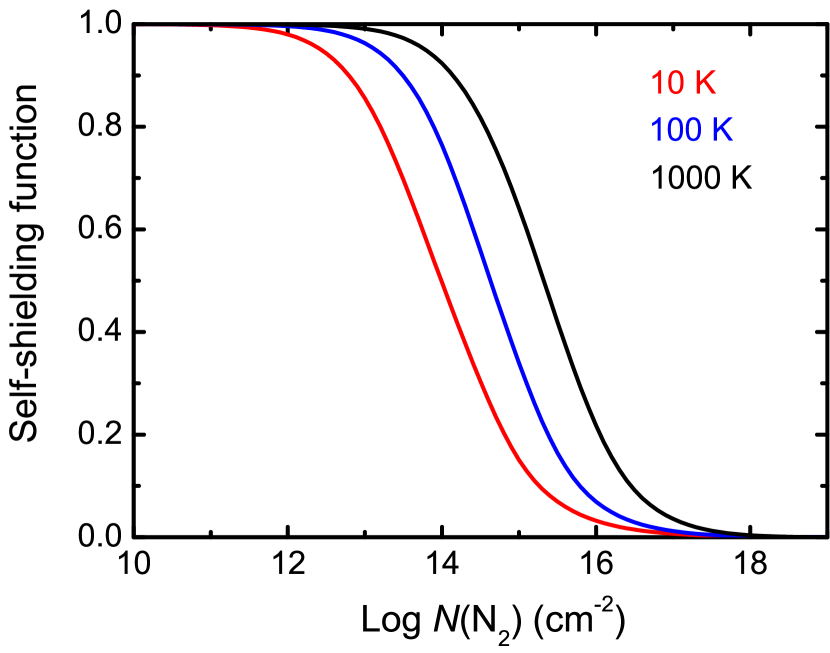
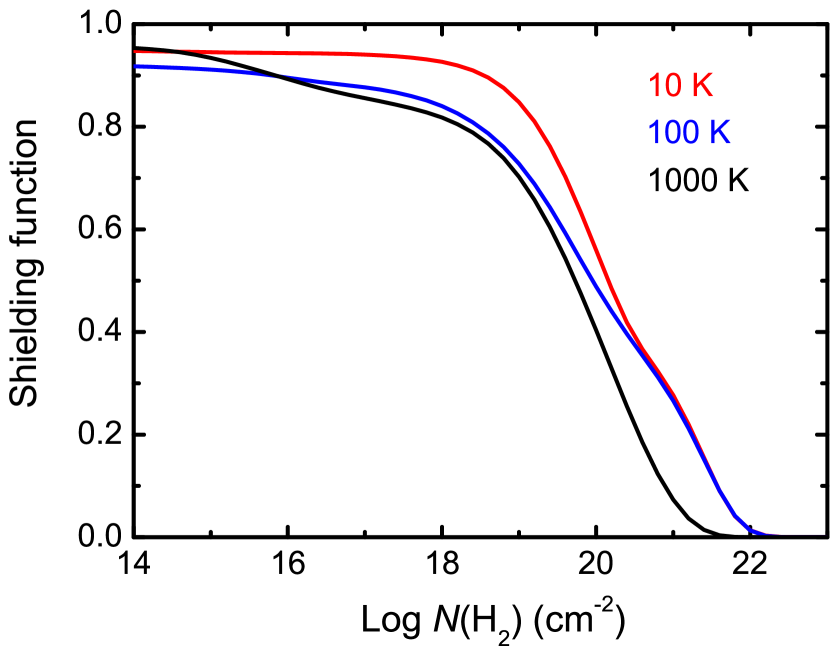
Although self-shielding is generally less important than mutual shielding for the case of N2 (see §3.3), it is potentially important in protoplanetary disks and has been proposed to be responsible for the enrichment of 15N in bulk chondrites and terrestrial planets (Lyons, 2009, 2010). In this work, we compute the self-shielding functions of N2 at excitation temperatures of 10, 100 and 1000 K using the model absorption spectrum. Since this spectrum is constructed using thermal line widths and no turbulent broadening, it provides the maximum amount of shielding. For reference, the thermal widths of N2 at 10, 100 and 1000 K correspond to full widths at half maximum of 0.1, 0.3 and 1.0 km s-1.
As can be seen in Fig. 6, the photodissociation of N2 is free of self-shielding up to a column density of around cm-2, but is fully shielded by cm-2. For intermediate N2 column densities the self-shielding function increases with increasing excitation temperature. There are two reasons for this (Visser et al., 2009). First, the optical depth of each line increases linearly with the thermal population of its corresponding lower-state rotational level, but the self-shielding increases nonlinearly according to Eq. (5). Then, because the ground state population at higher temperatures is distributed over more levels (see Fig. 2) there is an overall decrease in the effectiveness of self-shielding. The second effect arises from the individual line profiles, which are constructed to have thermal broadening. Those lines appearing in the 1000 K spectrum are then 10 times broader than those at 10 K, leading to decreased peak optical depth at the line center and less effective self-shielding over the whole line profile.
3.3 Shielding by H2, H and CO
The wavelength range over which N2 can be photodissociated is exactly the same range over which H2, H and CO absorb strongly. The amount by which N2 is shielded depends on the column densities of each of these species and is characterized by the shielding function of Eq. (6).
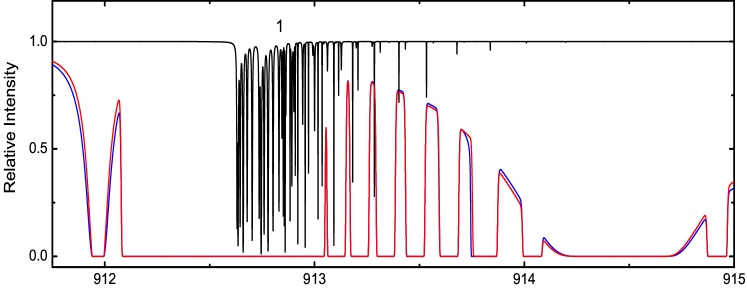
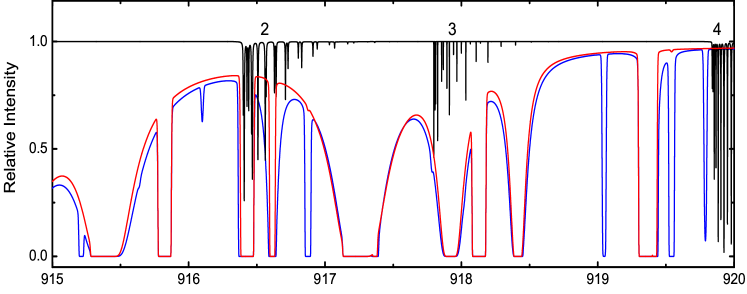
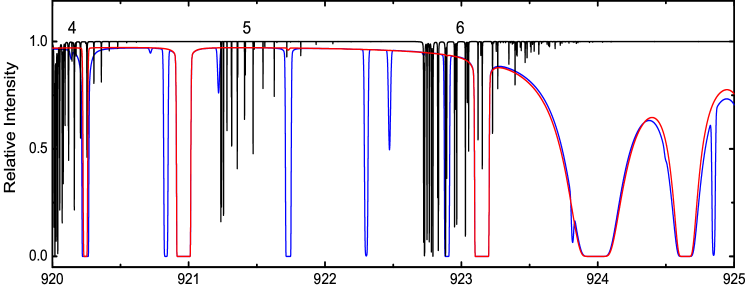
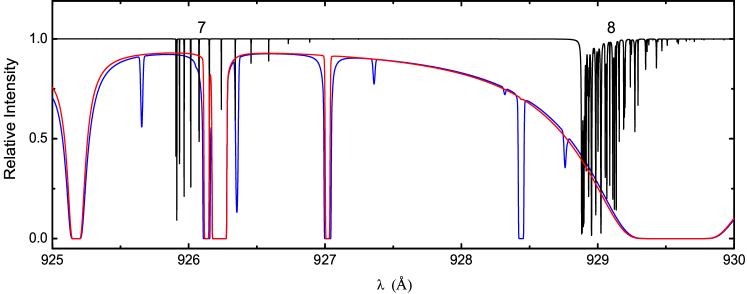
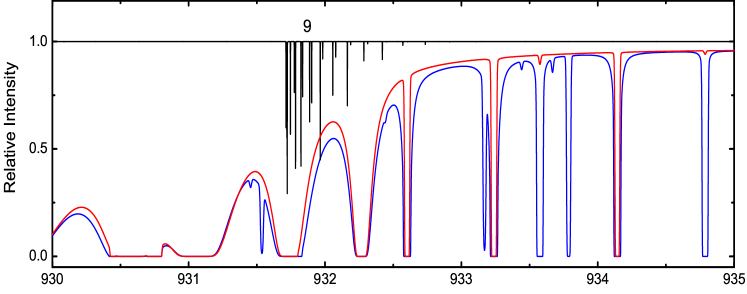
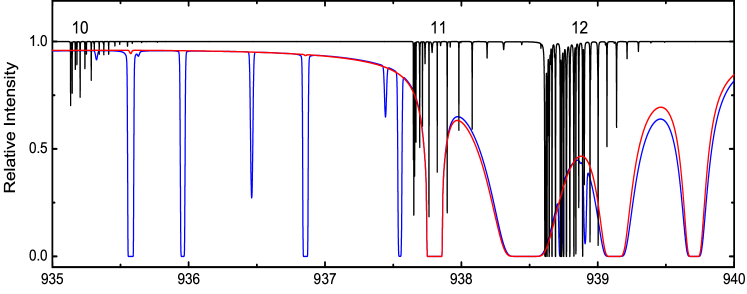
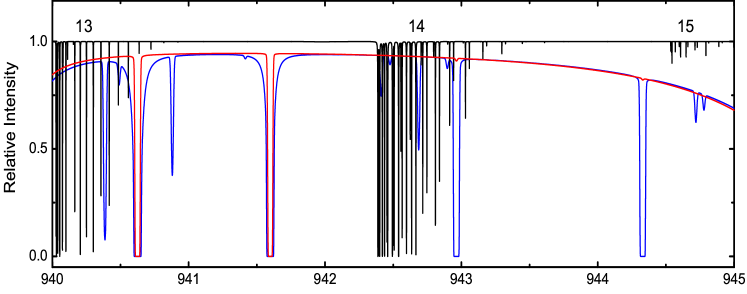
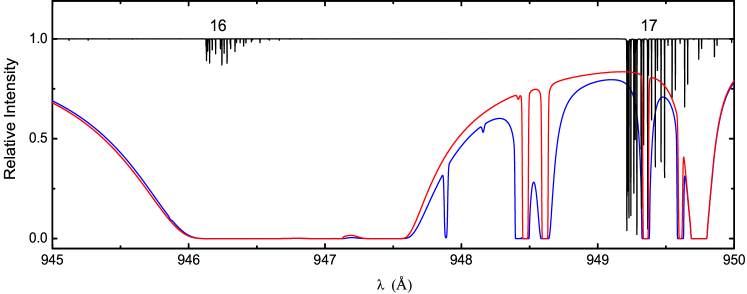
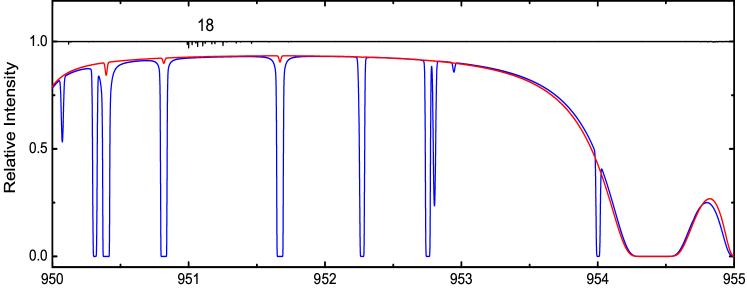
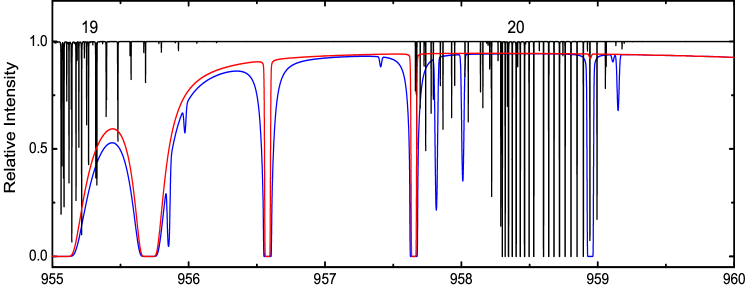
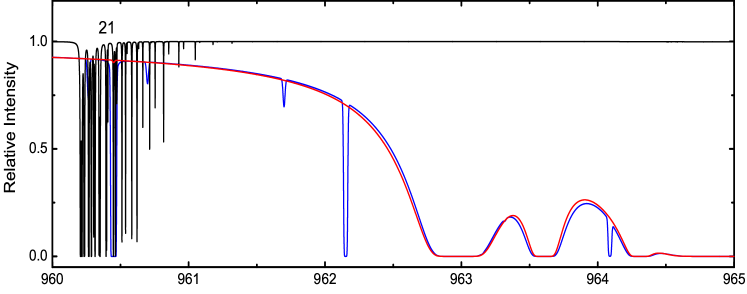
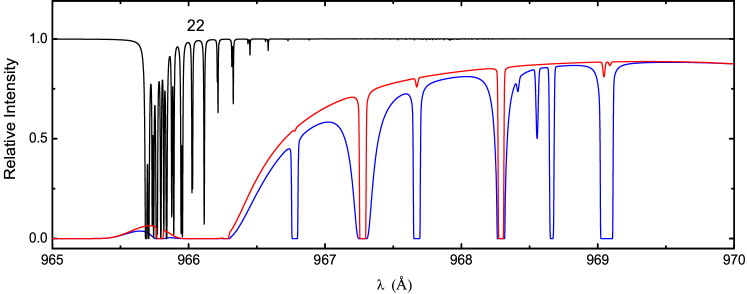
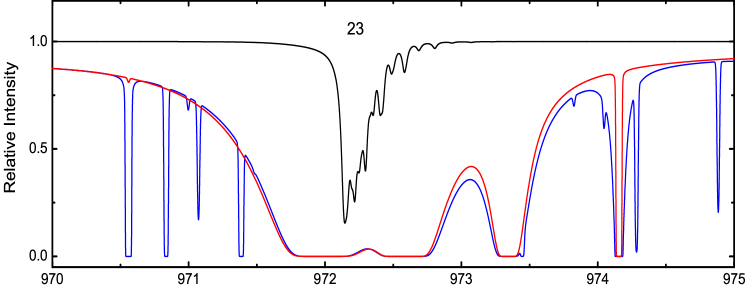
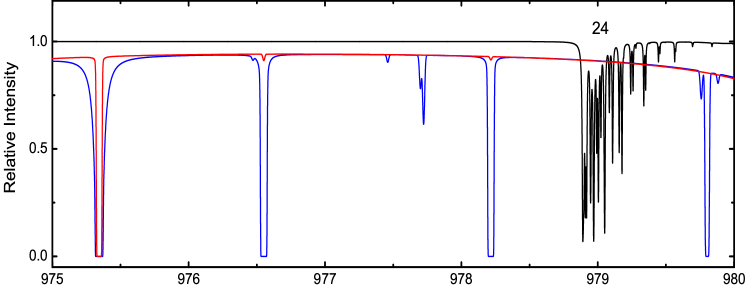
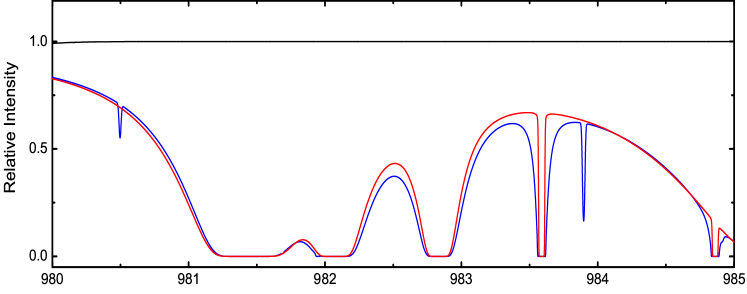
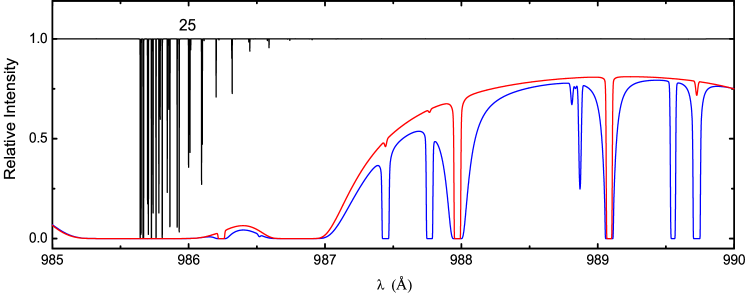
Figure 4 overlays absorption spectra for N2 and H+H2 combined. Two forms of the latter are included: a representative example spectrum deduced from observations of H2() and H column densities of the well-studied and commonly-referenced diffuse cloud toward Oph; and a simulated spectrum using column densities of and for H2 and H, respectively, and assuming purely thermal excitation of H2. The H2 molecular data adopted for the synthetic spectra are those of Abgrall et al. (1993a, b) and were obtained from the Meudon PDR code website (Le Petit et al., 2006). The assumed column densities were taken to be half those of the observed Oph cloud, as is appropriate for radiation penetrating to its center, and an excitation temperature of 50 K was used for the H2+H and N2 thermal models. The principal difference between observed and thermal H2+H spectra is the appearance of additional lines in the observed spectrum from non-thermally populated higher- levels. Thermal excitation H2 spectra are used throughout the following mutual-shielding calculations, and do not include extrathermal excitations such as UV pumping. This negligence leads to a slight (approximately 3%) underestimate of shielding for the case of the Oph cloud. A magnified version of the spectra in Fig. 4 is included in the online appendix, and it is apparent that the ranges containing significant N2 absorption and minimal shielding by H and H2 are 919.8–920.2, 921.2–921.6, 922.6–923.1, 925.8–926.1, 935.1-935.4, 939.9–940.3, 942.3–942.8, 958.1–958.9, 959.0–959.1, 960.1–960.8 and 978.8–979.5 Å.
The calculated N2 photodissociation rate at the centre of the Oph cloud is s-1, corresponding to 58% shielding by H2+H. Table 2 summarizes the contributions to the photodissociation rate of individual bands at the edge of the cloud (unshielded) and at its center. The pattern of increasing and decreasing significance of individual N2 bands under the influence of shielding is easily matched to the occurrence of overlapping features in Fig. 4(a). The heavy shielding of bands 22 and 23 has a particularly large effect on the total photodissociation rate, the relative importance of the lightly shielded band 14 increases significantly in the center, and the Å wavelength range remains particularly important for photodissociation throughout the cloud.
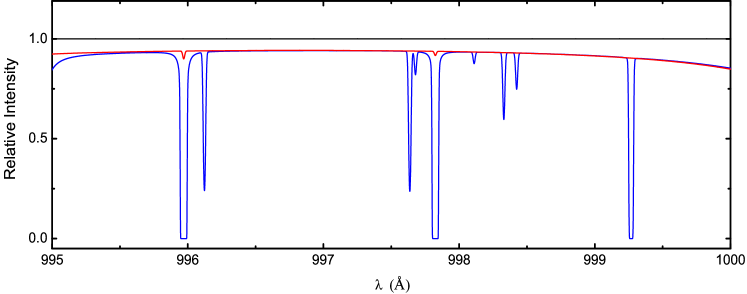
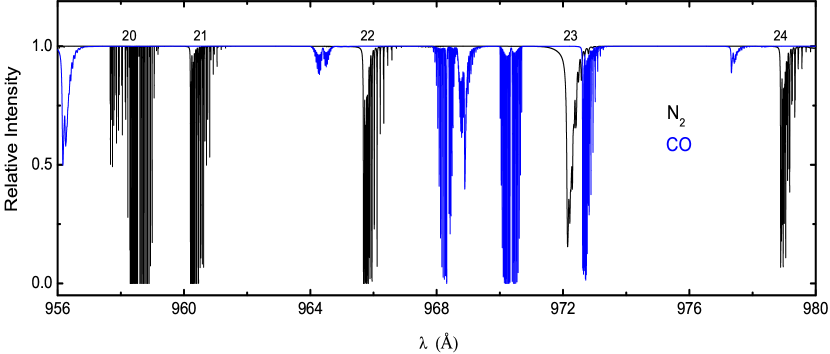
A similar investigation was performed considering the shielding of N2 by CO. Simulated absorption spectra for both molecules are shown in Fig. 7, where the CO spectrum was generated by the photoabsorption model of Visser et al. (2009) assuming a column density of cm-2, close to half of the observed Oph value. Both spectra exhibit a complex pattern of bands so that overlaps are infrequent and do not occur at all in the most important photodissociation range, 957–980 Å. In this range CO hardly affects N2 and, in general, shielding by H2 and H is sufficiently dominant that the additional influence of CO can be neglected.
| log (H2) | log (H) (cm-2) | ||
|---|---|---|---|
| (cm-2) | 14 | 20 | 22 |
| 14.0 | 9.979(-1) | 9.307(-1) | 7.621(-1) |
| 14.2 | 9.972(-1) | 9.301(-1) | 7.617(-1) |
| 14.4 | 9.964(-1) | 9.293(-1) | 7.610(-1) |
| 14.6 | 9.955(-1) | 9.284(-1) | 7.603(-1) |
| 14.8 | 9.945(-1) | 9.274(-1) | 7.595(-1) |
| 15.0 | 9.934(-1) | 9.264(-1) | 7.586(-1) |
| 15.2 | 9.923(-1) | 9.254(-1) | 7.577(-1) |
| 15.4 | 9.913(-1) | 9.245(-1) | 7.569(-1) |
| 15.6 | 9.904(-1) | 9.237(-1) | 7.562(-1) |
| 15.8 | 9.896(-1) | 9.228(-1) | 7.555(-1) |
| 16.0 | 9.885(-1) | 9.219(-1) | 7.546(-1) |
| 16.2 | 9.873(-1) | 9.207(-1) | 7.536(-1) |
| 16.4 | 9.859(-1) | 9.193(-1) | 7.524(-1) |
| 16.6 | 9.841(-1) | 9.177(-1) | 7.509(-1) |
| 16.8 | 9.821(-1) | 9.157(-1) | 7.492(-1) |
| 17.0 | 9.797(-1) | 9.134(-1) | 7.472(-1) |
| 17.2 | 9.767(-1) | 9.105(-1) | 7.447(-1) |
| 17.4 | 9.729(-1) | 9.069(-1) | 7.418(-1) |
| 17.6 | 9.681(-1) | 9.023(-1) | 7.380(-1) |
| 17.8 | 9.619(-1) | 8.964(-1) | 7.335(-1) |
| 18.0 | 9.541(-1) | 8.890(-1) | 7.280(-1) |
| 18.2 | 9.443(-1) | 8.800(-1) | 7.217(-1) |
| 18.4 | 9.319(-1) | 8.685(-1) | 7.141(-1) |
| 18.6 | 9.154(-1) | 8.534(-1) | 7.046(-1) |
| 18.8 | 8.927(-1) | 8.326(-1) | 6.916(-1) |
| 19.0 | 8.615(-1) | 8.040(-1) | 6.738(-1) |
| 19.2 | 8.198(-1) | 7.658(-1) | 6.496(-1) |
| 19.4 | 7.663(-1) | 7.164(-1) | 6.175(-1) |
| 19.6 | 7.012(-1) | 6.563(-1) | 5.766(-1) |
| 19.8 | 6.281(-1) | 5.887(-1) | 5.280(-1) |
| 20.0 | 5.540(-1) | 5.201(-1) | 4.758(-1) |
| 20.2 | 4.875(-1) | 4.583(-1) | 4.259(-1) |
| 20.4 | 4.333(-1) | 4.078(-1) | 3.830(-1) |
| 20.6 | 3.886(-1) | 3.660(-1) | 3.457(-1) |
| 20.8 | 3.446(-1) | 3.251(-1) | 3.081(-1) |
| 21.0 | 2.940(-1) | 2.781(-1) | 2.645(-1) |
| 21.2 | 2.327(-1) | 2.213(-1) | 2.113(-1) |
| 21.4 | 1.630(-1) | 1.561(-1) | 1.497(-1) |
| 21.6 | 9.495(-2) | 9.178(-2) | 8.843(-2) |
| 21.8 | 4.260(-2) | 4.164(-2) | 4.030(-2) |
| 22.0 | 1.375(-2) | 1.359(-2) | 1.320(-2) |
| 22.2 | 3.210(-3) | 3.200(-3) | 3.120(-3) |
| 22.4 | 5.737(-4) | 5.734(-4) | 5.600(-4) |
| 22.6 | 6.110(-5) | 6.108(-5) | 5.969(-5) |
| 22.8 | 2.146(-6) | 2.146(-6) | 2.094(-6) |
| 23.0 | 1.151(-8) | 1.151(-8) | 1.118(-8) |
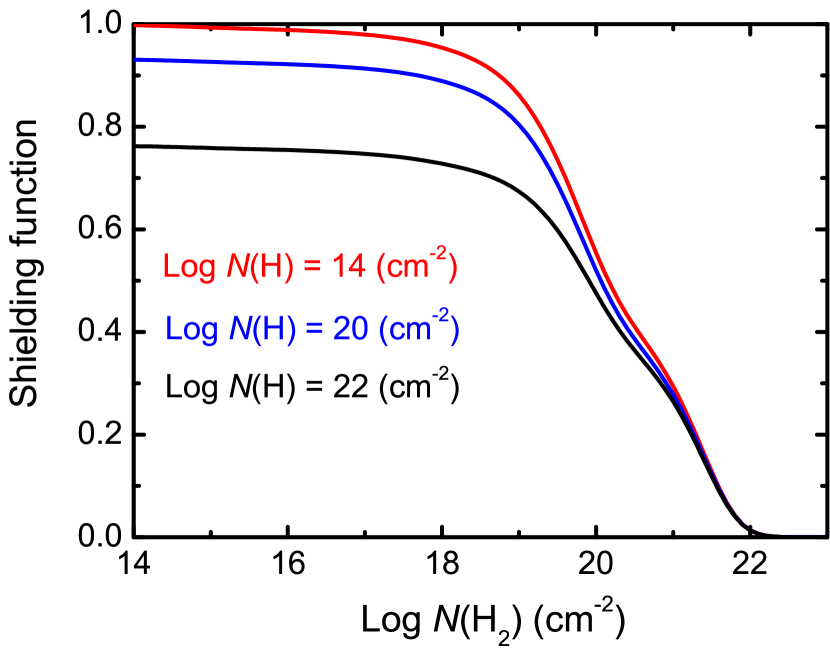
Two-dimensional shielding functions for a range of H2 and H column densities have been calculated. These are tabulated in Table 3 and shown graphically in Fig. 8. For these calculations an excitation temperature of 50 K was assumed for both N2 and H2, and (the nonthermal broadening) was set to 3 km s-1. Obviously, the shielding function decreases with increasing (H2) and (H), but H2 plays the more important role (as is the case for the shielding of CO; Visser et al. 2009). Specifically, N2 is close to fully shielded () when , and totally shielded by cm-2. Electronic tables of the calculated shielding functions can be obtained from www.strw.leidenuniv.nl/ewine/photo.
Since N2 does not possess a permanent dipole moment, radiative decay from excited rotational levels of its electronic-vibrational ground state is slow. Then, the excitation temperature of N2 is likely to be higher than that of CO and other molecules, and closer to the kinetic temperature. The effect of temperature on shielding by H2+H was investigated and is illustrated in Fig. 9. The same excitation temperatures are adopted for H2 and N2 because both are zero-dipole-moment molecules. The calculated shielding functions are somewhat erratic, and even show a peculiar non-monotonic temperature dependence at low H2 column density. This arises from the small degree of overlap occurring between atomic H lines and N2 bands. The distribution of N2 lines over additional rotational transitions at higher temperatures leads to the variability of Fig. 9 and illustrates the need for high-resolution reference spectra in these kinds of applications. For significant H2 column densities, and in contrast with N2 self-shielding, the amount of shielding increases with increasing temperature. This results from a H2 population that is spread over more rotational levels at higher temperatures, leading to an absorption spectrum featuring more lines available to shield N2. This is clearly evident when comparing the various curves in Fig. 4.
| Shielding due to | Shielding due to dust | |||||
|---|---|---|---|---|---|---|
| (cm-2) | 14N2 | 12COb𝑏bb𝑏bThe CO values are from Visser et al. (2009). | Interstellar | Protoplanetary | ||
| 0.31 | 0 | 8.916(-1) | 0.9 | 3.318(-1) | 8.290(-1) | |
| 0.32 | 19 | 8.098(-1) | 8.176(-1) | 3.175(-1) | 8.228(-1) | |
| 0.44 | 20 | 5.543(-1) | 7.223(-1) | 2.134(-1) | 7.691(-1) | |
| 1.56 | 21 | 2.759(-1) | 3.260(-1) | 4.023(-3) | 3.916(-1) | |
| 12.8 | 22 | 1.346(-2) | 1.108(-2) | 0 | 4.585(-4) | |
| 125.3 | 23 | 2.343(-8) | 3.938(-7) | 0 | 0 | |
Table compares the H+H2 shielding of N2 with the CO shielding calculations of Visser et al. (2009). The two molecules follow a similar pattern, within 50%, up to cm-2. This difference becomes more significant when cm-2, but photodissociation has long ceased to be important as an N2 destruction mechanism by then.
3.4 Shielding by dust
Dust grains compete with molecules in the cloud by also absorbing UV photons. For the 912–1000 Å wavelength range, the attenuation by dust is largely independent of wavelength and can be taken into account by an additional shielding term (van Dishoeck et al., 2006). For the wavelength range appropriate for N2, a value of is found, using the method of Roberge et al. (1981) and standard diffuse-cloud grain properties of Roberge et al. (1991). For larger dust grains of a few m in size, such as is appropriate for protoplanetary disks, (van Dishoeck et al., 2006). The visual extinction is computed from the total hydrogen column =(H) + 2(H2) through the relation , based on Savage et al. (1977).
For diffuse clouds with total visual extinctions around 1 mag, radiation from the other side of the cloud may result in a shallower depth dependence than given by the above single exponential form. In such cases, a bi-exponential form may be more appropriate (van Dishoeck & Dalgarno, 1984; van Dishoeck, 1988). For =1 mag, and are found.
The shielding of N2 by dust under various conditions is listed in Table . This shows that shielding by normal interstellar dust is larger than that by H2 and H for any and implies that the ‘smoke screen’ by dust also plays a significant role in diffuse and translucent clouds and photon-dominated regions. However, in protoplanetary disks where the larger dust particles absorb and scatter less efficiently, the effects of H2 and H shielding become comparable, or even dominant, at large .
4 Chemical models
As an example of how to apply the new photodissociation rates, we ran chemical models for a set of diffuse and translucent clouds, a photon-dominated region (PDR), and a vertical cut through a circumstellar disk. The models use the UMIST06 chemical network (Woodall et al., 2007), stripped down to species containing only H, He, C, N and O. Species containing more than two C, N or O atoms are also removed since they are not relevant for our purposes. Freeze-out and thermal evaporation are added for all neutral species, but no grain-surface reactions are included other than H2 formation according to Black & van Dishoeck (1987). Self-shielding of CO is computed using the shielding functions of Visser et al. (2009); for N2, we use the self-shielding functions calculated here at 50 K. The elemental abundances relative to H are for He, for C, for N and for O (Aikawa et al., 2008). Enhanced formation of CH+ (and thus also CO) at low is included following Visser et al. (2009) by supra-thermal chemistry, boosting the rate of ion-neutral reactions by setting the Alfvén speed to 3.3 km s-1 for column densities less than cm-2. Unless stated otherwise, the model of impinging UV flux is the Draine field of Eq. (3) modified by a scaling factor, . In all cases, the abundances of N, N2 and CO reach steady state after 1 Myr, regardless of whether the gas starts in atomic or molecular form.
4.1 Diffuse and translucent clouds
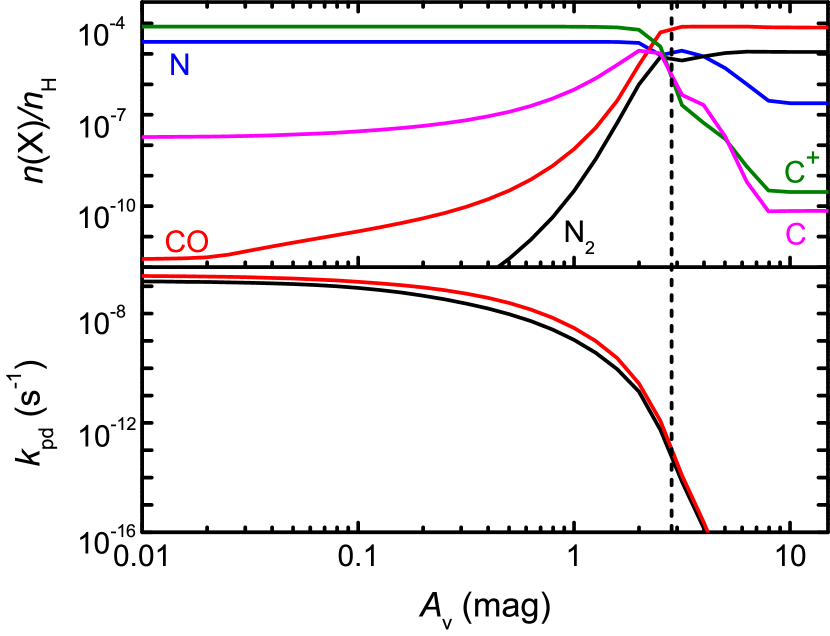
A set of diffuse and translucent cloud models was run for central densities and cm-3, at a temperature of 30 K, and assuming scaling factors of the UV flux of and 5. Figure 10 shows the abundances of N, N2 and CO and the photodissociation rates of N2 and CO as functions of depth into the cloud (measured in ) for the and =1 model. Both CO and N2 are rapidly photodissociated in the limit of low extinction and carbon and nitrogen are primarily in atomic form. Some CO is formed in a series of (supra-thermal) ion-molecule reactions starting with C+ at the edge (Visser et al., 2009). Since the ionization potential of atomic N lies just above that of H, preventing the formation of N+, N2 can only form through slower neutral-neutral reactions. As a result, the abundance of N2 is three orders of magnitude lower than that of CO at the edge of the cloud. The conversion from N to N2 occurs at an of 1.5 mag, at which point CO has become the main form of carbon. The bottom panel of Figure 10 illustrates that self-shielding and mutual shielding by H and H2 significantly reduce the photodissociation rate relative to dust alone. The column densities of N2 and CO at =1.5 mag are and cm-2. At high , atomic N is maintained at an abundance of by the dissociative recombination of N2H+, which in turn is formed from the reaction between N2 and cosmic-ray-produced H.
To investigate the role of turbulence or non-thermal motions on the results, a model has been run in which the Doppler width of the N2 lines in the self-shielding calculation was increased to 3 km s-1 rather than the thermal width at low temperatures. The resulting N2 abundance as a function of depth is nearly identical to that presented in Fig. 10.
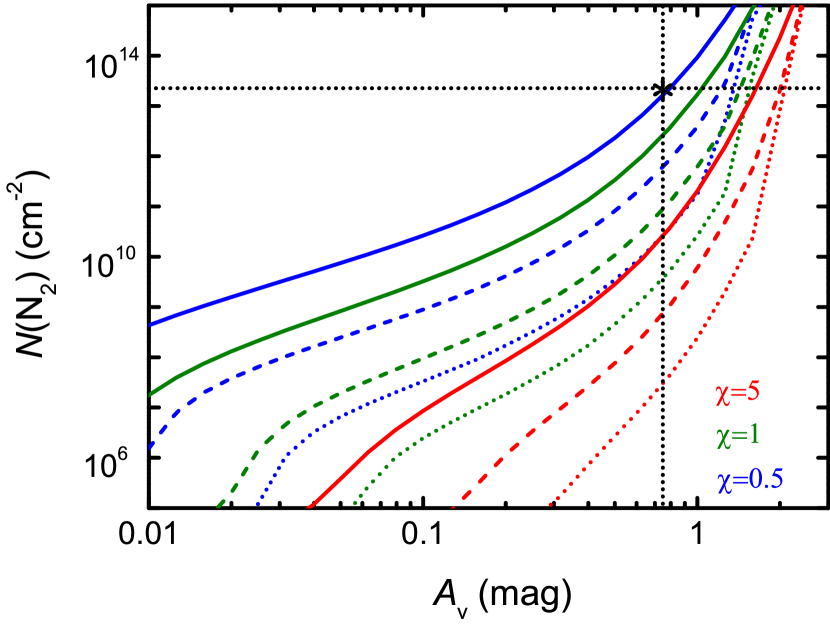
Absorption bands of N2 have possibly been detected in observations of the diffuse cloud toward HD 124314 (Knauth et al., 2004). The two relevant bands, indicated in Fig. 4, are particularly strongly absorbing, and are relatively unshielded by hydrogen. The depth of the observed absorption indicates a total N2 column density of cm-2 and the stellar reddening of HD 124314 provides an estimate of the cloud’s extinction, mag. Figure 11 shows the cumulative N2 column density calculated for a range of radiation field intensities and densities as a function of . For comparison with the model, which considers only half of the cloud from edge to center and is irradiated from one side only, the observed and N2 column density must be halved. These models use the single exponential dust continuum shielding function; if the bi-exponential formulation were used, the model N2 column densities would be even lower for small . The maximum calculated column density occurs where the radiation field is weakest () and for the highest density (. These are extreme physical conditions for a cloud like HD 124314 and inconsistent with its relatively high H/H2 column density ratio (André et al., 2003) and low CO column density (Sheffer et al., 2008). An independent conformation of the N2 detection is warranted. Observed upper limits toward other diffuse clouds with lower are a few cm-2 (Lutz et al., 1979), which are consistent with the current models for typical densities of a few hundred cm-3 and 1.
4.2 Photon-dominated region
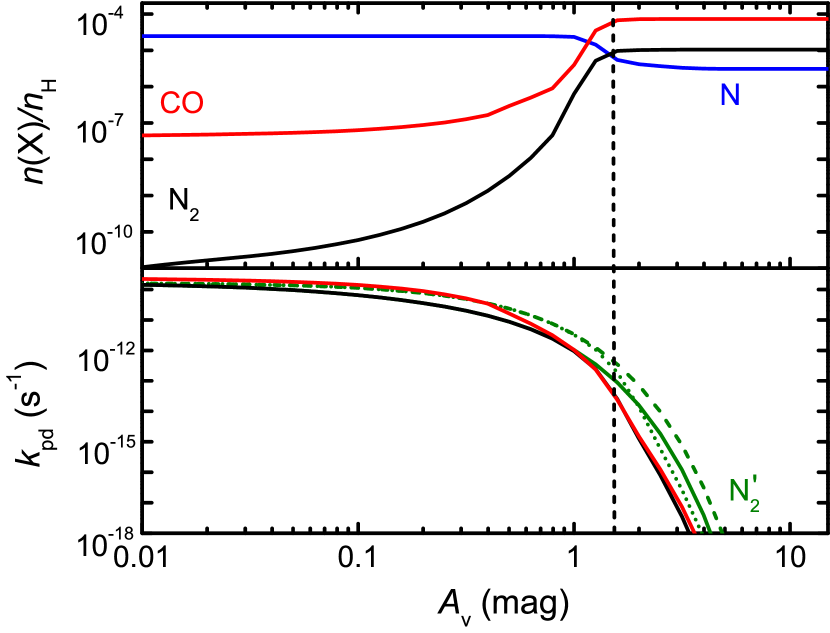
The PDR model is run assuming an density of cm-3, a temperature of 100 K, and a UV flux of . Figure 12 shows the resulting abundances of N, N2, C, C+ and CO and the relevant photodissociation rates as functions of .
The calculated abundances of both N2 and CO at low are lower in the PDR model compared with the diffuse and translucent clouds, because of the stronger UV field. For all models, the abundance of N2 is several orders of magnitude lower than that of CO. Also, because of the increased radiation, the transition from N to N2 occurs deeper into the PDR: at an of about 3 mag. The column densities of N2 and CO at this point are and cm-2. The minor wiggle in the atomic N abundance profiles at –3 mag is due to the abundance patterns of CH and OH. CH is the main destroyer of N at mag but its abundance drops going into the cloud because its main precursor, C+, disappears. The simultaneously increasing extinction allows for an increase in the OH abundance, so that this becomes the main destroyer of N for mag. Interestingly, the transition from NN2 occurs at nearly the same depth into the cloud than that of CCCO.
4.3 Circumstellar disk
The fourth model simulates a vertical slice through a circumstellar disk and its setup is identical to that of Visser et al. (2009). The slice is located at a radius of 105 AU in the standard model of D’Alessio et al. (1999), which supposes a disk of 0.07 and 400 AU radius surrounding a T Tauri star of 0.5 and 2 radius. The surface of the slice, at a height of 120 AU, is illuminated by the Draine (1978) field with . We ran the model assuming dust grain sizes of 0.1 and 1 m. The results are plotted in Fig. 13.
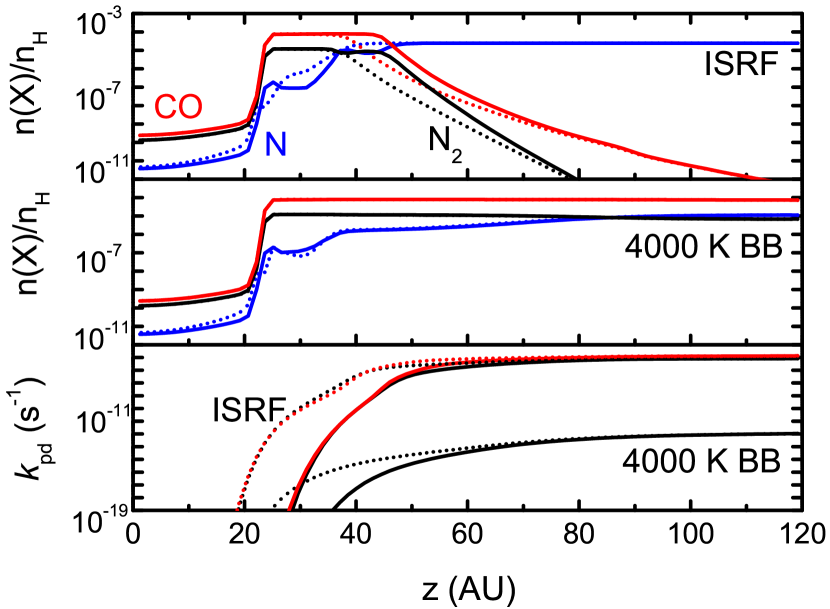
Starting from the disk surface (high ) and moving inwards, the abundance profiles of N, N2 and CO show the same qualitative trends as they do for the translucent cloud and PDR models. The main difference arises from freeze-out of N2 and CO for below 25 AU, at which point the dust temperature drops below 20 K. The depletion of N2 also drives down the abundance of N2H+ which, in turn, restricts the abundance of atomic N. In the models presented here, nitrogen is fully converted into N2 at heights where no freeze-out occurs.
Increasing the grain size from 0.1 to 1 m allows the UV field to penetrate to heights of about 35 instead of 45 AU. The abundances of N2 and CO are then a factor of 10–100 lower in the intervening zone, while that of atomic N is a factor of a few higher. Since atomic N is a prerequisite for an active nitrogen chemistry leading to species like HCN, this result illustrates that larger column densities of nitrogen-containing molecules can be expected in disks with grain growth.
The column densities integrated from surface to midplane are cm-2 for N2 and cm-2 for CO, regardless of the grain size, since the bulk of the N2 and CO are at high densities where UV photodissociation is negligible. The total column of N is cm-2 for 0.1 m grains and cm-2 for 1 m grains.
The models discussed above use a scaled Draine (1978) radiation field. A much cooler radiation field was also considered by assuming a 4000 K blackbody source scaled to the same flux between 912 and 2050 Å. Then, both carbon and nitrogen are fully molecular at the disk surface since photodissociation of both CO and N2 is negligible. A smaller amount of atomic N is maintained by chemical reactions for active nitrogen chemistry. This result is qualitatively consistent with the observation of Pascucci et al. (2009) that the color of the radiation field affects the nitrogen chemistry, although that study applied to the inner rather than the outer disk.
5 Conclusions
In this work, we compute accurate N2 photodissociation rates in the interstellar medium for the first time by employing new molecular data on its electronic transitions. The calculated N2 photodissociation rate in an unattenuated interstellar radiation field is s-1 (50 K), 28% lower than the previously recommended value. This rate increases somewhat with temperature due to dependent predissociation rates.
The simulated spectra reveal that the most important range for photodissociation is 957–980 Å, where H2 and H absorption significantly overlap with N2 absorption. In contrast, CO only weakly shields N2. Self-shielding and mutual shielding functions have been computed for a range of N2, H2 and H column densities. For interstellar grains, shielding by dust is also effective. In protoplanetary disks, where dust particles have grown to m size, the dust shielding becomes less than that of H2.
The new rates have been incorporated into models of diffuse and translucent clouds, of a dense PDR, and a protoplanetary disk. The translucent cloud models show that the observed column of interstellar N2 in a translucent cloud with mag can only be reproduced if the density is higher than and the radiation field has an intensity of less than half of the Draine (1978) field. For dense PDRs, the N2 abundance only becomes significant at extinctions of more than 3 mag into the cloud but the transition of N N2 occurs at nearly the same depth as that of . Disk models show that nitrogen is fully converted into N2 at heights before freeze-out occurs, irrespective of grain size. However, an active nitrogen chemistry can take place in the upper layers of a disk where not all nitrogen is locked up in N2, except for very cool radiation fields. Altogether, data are now available to accurately model N2 photodissociation in a wide variety of interstellar and circumstellar media.
Acknowledgements.
Astrochemistry in Leiden is supported by the Netherlands Research School for Astronomy (NOVA), by a Spinoza grant and grant 648.000.002 from the Netherlands Organisation for Scientific Research (NWO), and by the European Community’s Seventh Framework Programme FP7/2007-2013 under grant agreements 291141 (CHEMPLAN) and 238258 (LASSIE). Calculations of the N2 photodissociation cross sections were supported by the Australian Research Council Discovery Program, through Grant Nos. DP0558962 and DP0773050.References
- Abgrall et al. (1993a) Abgrall, H., Roueff, E., Launay, F., Roncin, J. Y., & Subtil, J. L. 1993a, A&AS, 101, 273
- Abgrall et al. (1993b) Abgrall, H., Roueff, E., Launay, F., Roncin, J. Y., & Subtil, J. L. 1993b, A&AS, 101, 323
- Aikawa et al. (2008) Aikawa, Y., Wakelam, V., Garrod, R. T., & Herbst, E. 2008, ApJ, 674, 984
- Ajello et al. (1989) Ajello, J. M., James, G. K., Franklin, B. O., & Shemansky, D. E. 1989, Phys. Rev. A, 40, 3524
- André et al. (2003) André, M. K., Oliveira, C. M., Howk, J. C., et al. 2003, ApJ, 591, 1000
- Bergin et al. (2002) Bergin, E. A., Alves, J., Huard, T., & Lada, C. J. 2002, ApJ, 570, L101
- Bettens et al. (1995) Bettens, R. P. A., Lee, H.-H., & Herbst, E. 1995, ApJ, 443, 664
- Black & van Dishoeck (1987) Black, J. H. & van Dishoeck, E. F. 1987, ApJ, 322, 412
- Crapsi et al. (2005) Crapsi, A., Caselli, P., Walmsley, C. M., et al. 2005, ApJ, 619, 379
- D’Alessio et al. (1999) D’Alessio, P., Calvet, N., Hartmann, L., Lizano, S., & Cantó, J. 1999, ApJ, 527, 893
- Daranlot et al. (2012) Daranlot, J., Hincelin, U., Bergeat, A., et al. 2012, Proceedings of the National Academy of Science, 109, 10233
- Draine (1978) Draine, B. T. 1978, ApJS, 36, 595
- Dutrey et al. (2007) Dutrey, A., Henning, T., Guilloteau, S., et al. 2007, A&A, 464, 615
- Fontani et al. (2011) Fontani, F., Palau, A., Caselli, P., et al. 2011, A&A, 529, L7
- Gondhalekar et al. (1980) Gondhalekar, P. M., Phillips, A. P., & Wilson, R. 1980, A&A, 85, 272
- Habing (1968) Habing, H. J. 1968, Bull. Astron. Inst. Netherlands, 19, 421
- Haverd et al. (2005) Haverd, V. E., Lewis, B. R., Gibson, S. T., & Stark, G. 2005, J. Chem. Phys., 123, 214304
- Heays (2011) Heays, A. N. 2011, PhD thesis, The Australian National University
- Heays et al. (2011) Heays, A. N., Dickenson, G. D., Salumbides, E. J., et al. 2011, J. Chem. Phys., 135
- Heays et al. (2009) Heays, A. N., Lewis, B. R., Stark, G., et al. 2009, J. Chem. Phys., 131, 194308
- Helm et al. (1993) Helm, H., Hazell, I., & Bjerre, N. 1993, Phys. Rev. A, 48, 2762
- Herbst et al. (1977) Herbst, E., Green, S., Thaddeus, P., & Klemperer, W. 1977, ApJ, 215, 503
- Herbst & Klemperer (1973) Herbst, E. & Klemperer, W. 1973, ApJ, 185, 505
- Huber & Herzberg (1979) Huber, K. P. & Herzberg, G. 1979, Molecular spectra and molecular structure IV: Constants of diatomic molecules (Van Nostrand, New York)
- Knauth et al. (2004) Knauth, D. C., Andersson, B.-G., McCandliss, S. R., & Warren Moos, H. 2004, Nature, 429, 636
- Langer & Graedel (1989) Langer, W. D. & Graedel, T. E. 1989, ApJS, 69, 241
- Le Petit et al. (2006) Le Petit, F., Nehmé, C., Le Bourlot, J., & Roueff, E. 2006, ApJS, 164, 506
- Lee et al. (1996) Lee, H.-H., Herbst, E., Pineau des Forets, G., Roueff, E., & Le Bourlot, J. 1996, A&A, 311, 690
- Lefebvre-Brion & Field (2004) Lefebvre-Brion, H. & Field, R. W. 2004, The spectra and dynamics of diatomic molecules (Elsevier)
- Lewis et al. (2008a) Lewis, B. R., Baldwin, K. G. H., Heays, A. N., et al. 2008a, J. Chem. Phys., 129, 204303
- Lewis et al. (2008b) Lewis, B. R., Baldwin, K. G. H., Sprengers, J. P., et al. 2008b, J. Chem. Phys., 129, 164305
- Lewis et al. (2005a) Lewis, B. R., Gibson, S. T., Sprengers, J. P., et al. 2005a, J. Chem. Phys., 123, 236101
- Lewis et al. (2005b) Lewis, B. R., Gibson, S. T., Zhang, W., Lefebvre-Brion, H., & Robbe, J.-M. 2005b, J. Chem. Phys., 122, 144302
- Lewis et al. (2008c) Lewis, B. R., Heays, A. N., Gibson, S. T., Lefebvre-Brion, H., & Lefebvre, R. 2008c, J. Chem. Phys., 129, 164306
- Liang et al. (2007) Liang, M.-C., Heays, A. N., Lewis, B. R., Gibson, S. T., & Yung, Y. L. 2007, ApJ, 664, L115
- Liu et al. (2008) Liu, X., Shemansky, D. E., Malone, C. P., et al. 2008, J. Geophys. Res., 113, A02304
- Lutz et al. (1979) Lutz, B. L., Snow, Jr., T. P., & Owen, T. 1979, ApJ, 227, 159
- Lyons (2009) Lyons, J. R. 2009, Meteoritics and Planetary Science Supplement, 72, 5437
- Lyons (2010) Lyons, J. R. 2010, Meteoritics and Planetary Science Supplement, 73, 5424
- Maret et al. (2006) Maret, S., Bergin, E. A., & Lada, C. J. 2006, Nature, 442, 425
- Mathis et al. (1983) Mathis, J. S., Mezger, P. G., & Panagia, N. 1983, A&A, 128, 212
- Mauersberger & Henkel (1991) Mauersberger, R. & Henkel, C. 1991, A&A, 245, 457
- Meier & Turner (2005) Meier, D. S. & Turner, J. L. 2005, ApJ, 618, 259
- Meier et al. (1991) Meier, R. R., Samson, J. A. R., Chung, Y., Lee, E.-M., & He, Z.-X. 1991, Planet. Space Sci., 39, 1197
- Muller et al. (2011) Muller, S., Beelen, A., Guélin, M., et al. 2011, A&A, 535, A103
- Ndome et al. (2008) Ndome, H., Hochlaf, M., Lewis, B. R., et al. 2008, J. Chem. Phys., 129, 164307
- Öberg et al. (2010) Öberg, K. I., Qi, C., Fogel, J. K. J., et al. 2010, ApJ, 720, 480
- Pascucci et al. (2009) Pascucci, I., Apai, D., Luhman, K., et al. 2009, ApJ, 696, 143
- Roberge et al. (1981) Roberge, W. G., Dalgarno, A., & Flannery, B. P. 1981, ApJ, 243, 817
- Roberge et al. (1991) Roberge, W. G., Jones, D., Lepp, S., & Dalgarno, A. 1991, ApJS, 77, 287
- Savage et al. (1977) Savage, B. D., Bohlin, R. C., Drake, J. F., & Budich, W. 1977, ApJ, 216, 291
- Sheffer et al. (2008) Sheffer, Y., Rogers, M., Federman, S. R., et al. 2008, ApJ, 687, 1075
- Spelsberg & Meyer (2001) Spelsberg, D. & Meyer, W. 2001, J. Chem. Phys., 115, 6438
- Sprengers et al. (2005) Sprengers, J. P., Reinhold, E., Ubachs, W., Baldwin, K. G. H., & Lewis, B. R. 2005, J. Chem. Phys., 123, 144315
- Sprengers et al. (2003) Sprengers, J. P., Ubachs, W., Baldwin, K. G. H., Lewis, B. R., & Tchang-Brillet, W.-Ü. L. 2003, J. Chem. Phys., 119, 3160
- Sprengers et al. (2004) Sprengers, J. P., Ubachs, W., Johansson, A., et al. 2004, J. Chem. Phys., 120, 8973
- Stark et al. (2008) Stark, G., Lewis, B. R., Heays, A. N., et al. 2008, J. Chem. Phys., 128, 114302
- Strobel (1982) Strobel, D. F. 1982, Origins of Life, 12, 244
- Tobin et al. (2012) Tobin, J. J., Hartmann, L., Bergin, E., et al. 2012, ApJ, 748, 16
- Turner (1974) Turner, B. E. 1974, Ap&SS, 29, 247
- van Dishoeck (1988) van Dishoeck, E. F. 1988, in Rate Coefficients in Astrochemistry, ed. T. J. Millar, and D. A. Williams, Kluwer Academic Publishers, Dordrecht, 49
- van Dishoeck & Black (1988) van Dishoeck, E. F. & Black, J. H. 1988, ApJ, 334, 771
- van Dishoeck & Dalgarno (1984) van Dishoeck, E. F. & Dalgarno, A. 1984, J. Chem. Phys., 277, 576
- van Dishoeck et al. (2006) van Dishoeck, E. F., Jonkheid, B., & van Hemert, M. C. 2006, Faraday Discussions, 303, 231
- van Dishoeck et al. (1984) van Dishoeck, E. F., van Hemert, M. C., Allison, A. C., & Dalgarno, A. 1984, ApJ, 81, 5709
- Viala et al. (1988) Viala, Y. P., Letzelter, C., Eidelsberg, M., & Rostas, F. 1988, A&A, 193, 265
- Visser et al. (2009) Visser, R., van Dishoeck, E. F., & Black, J. H. 2009, A&A, 503, 323
- Walter et al. (1993) Walter, C. W., Cosby, P., & Helm, H. 1993, J. Chem. Phys., 99, 3553
- Wayne (2000) Wayne, R. P. 2000, Chemistry of Atmospheres (Oxford University Press)
- Woodall et al. (2007) Woodall, J., Agúndez, M., Markwick-Kemper, A. J., & Millar, T. J. 2007, A&A, 466, 1197
- Wu et al. (2012) Wu, C. Y. R., Judge, D. L., Tsai, M.-H., et al. 2012, J. Chem. Phys., 136, 044301
Appendix A self-shielding functions
In this section, we provide a table containing the self-shielding functions of N2 at 10, 100 and 1000 K (data for Fig. 6).
| log (N2) | Temperature (K) | ||
|---|---|---|---|
| (cm-2) | 10 | 100 | 1000 |
| 10.0 | 9.998(-1) | 1.000(0) | 1.000(0) |
| 10.2 | 9.997(-1) | 9.999(-1) | 1.000(0) |
| 10.4 | 9.995(-1) | 9.999(-1) | 1.000(0) |
| 10.6 | 9.991(-1) | 9.998(-1) | 1.000(0) |
| 10.8 | 9.986(-1) | 9.997(-1) | 9.999(-1) |
| 11.0 | 9.979(-1) | 9.996(-1) | 9.999(-1) |
| 11.2 | 9.966(-1) | 9.994(-1) | 9.999(-1) |
| 11.4 | 9.947(-1) | 9.990(-1) | 9.998(-1) |
| 11.6 | 9.917(-1) | 9.984(-1) | 9.996(-1) |
| 11.8 | 9.870(-1) | 9.974(-1) | 9.994(-1) |
| 12.0 | 9.798(-1) | 9.960(-1) | 9.991(-1) |
| 12.2 | 9.691(-1) | 9.936(-1) | 9.986(-1) |
| 12.4 | 9.533(-1) | 9.900(-1) | 9.977(-1) |
| 12.6 | 9.305(-1) | 9.844(-1) | 9.964(-1) |
| 12.8 | 8.985(-1) | 9.757(-1) | 9.943(-1) |
| 13.0 | 8.554(-1) | 9.627(-1) | 9.910(-1) |
| 13.2 | 8.001(-1) | 9.436(-1) | 9.859(-1) |
| 13.4 | 7.333(-1) | 9.163(-1) | 9.781(-1) |
| 13.6 | 6.579(-1) | 8.785(-1) | 9.662(-1) |
| 13.8 | 5.778(-1) | 8.282(-1) | 9.486(-1) |
| 14.0 | 4.967(-1) | 7.643(-1) | 9.235(-1) |
| 14.2 | 4.169(-1) | 6.877(-1) | 8.891(-1) |
| 14.4 | 3.400(-1) | 6.022(-1) | 8.440(-1) |
| 14.6 | 2.680(-1) | 5.130(-1) | 7.875(-1) |
| 14.8 | 2.037(-1) | 4.244(-1) | 7.197(-1) |
| 15.0 | 1.505(-1) | 3.394(-1) | 6.412(-1) |
| 15.2 | 1.100(-1) | 2.609(-1) | 5.546(-1) |
| 15.4 | 8.073(-2) | 1.928(-1) | 4.641(-1) |
| 15.6 | 5.945(-2) | 1.384(-1) | 3.747(-1) |
| 15.8 | 4.374(-2) | 9.802(-2) | 2.911(-1) |
| 16.0 | 3.214(-2) | 6.920(-2) | 2.175(-1) |
| 16.2 | 2.361(-2) | 4.886(-2) | 1.567(-1) |
| 16.4 | 1.731(-2) | 3.454(-2) | 1.100(-1) |
| 16.6 | 1.267(-2) | 2.441(-2) | 7.613(-2) |
| 16.8 | 9.250(-3) | 1.717(-2) | 5.229(-2) |
| 17.0 | 6.720(-3) | 1.199(-2) | 3.557(-2) |
| 17.2 | 4.870(-3) | 8.280(-3) | 2.387(-2) |
| 17.4 | 3.510(-3) | 5.640(-3) | 1.574(-2) |
| 17.6 | 2.520(-3) | 3.810(-3) | 1.013(-2) |
| 17.8 | 1.790(-3) | 2.570(-3) | 6.340(-3) |
| 18.0 | 1.270(-3) | 1.740(-3) | 3.850(-3) |
| 18.2 | 8.906(-4) | 1.190(-3) | 2.280(-3) |
| 18.4 | 6.247(-4) | 8.066(-4) | 1.310(-3) |
| 18.6 | 4.359(-4) | 5.425(-4) | 7.183(-4) |
| 18.8 | 2.998(-4) | 3.613(-4) | 3.737(-4) |
| 19.0 | 2.031(-4) | 2.386(-4) | 1.820(-4) |
Appendix B High resolution spectra
In this section, we provide the high resolution spectra of N2 at 50 K (zoom in for Fig. 4). The H2 and H column densities are the same as those used in Figure 4.