Feature Selection Based on Term Frequency and T-Test for Text Categorization
Abstract
Much work has been done on feature selection. Existing methods are based on document frequency, such as Chi-Square Statistic, Information Gain etc. However, these methods have two shortcomings: one is that they are not reliable for low-frequency terms, and the other is that they only count whether one term occurs in a document and ignore the term frequency. Actually, high-frequency terms within a specific category are often regards as discriminators.
This paper focuses on how to construct the feature selection function based on term frequency, and proposes a new approach based on -test, which is used to measure the diversity of the distributions of a term between the specific category and the entire corpus. Extensive comparative experiments on two text corpora using three classifiers show that our new approach is comparable to or or slightly better than the state-of-the-art feature selection methods (i.e., , and IG) in terms of macro- and micro-.
category:
H.4 Information Systems Applications Miscellaneouskeywords:
feature selection, term frequency, -test, text classification1 Introduction
Text classification (TC) is to assign new unlabeled natural language documents to predefined thematic categories [13]. Many classification algorithms have been proposed for TC, e.g., -nearest neighbors [20], centroid-based classifier [7], and support vector machines (SVMs) [3].
Generally, text feature space is often sparse and high-dimensional. For instance, the dimensionality of a moderate-sized text corpus can reach up to tens or hundreds of thousands. The high dimensionality of feature space will cause the “curse of dimensionality”, increase the training time, and affect the accuracy of classifiers [13, 6, 20]. Therefore, feature selection techniques are proposed to reduce the dimensionality under the premise of guaranteeing the performance of classifiers. Existing feature selection methods are based on statistical theory and information theory, such as , IG, MI, and ECE. The theoretical basis of the four methods is sound, but the performances of these methods on TC tasks are different. Both and IG often achieved better accuracy than MI and document frequency (DF) [20]. However, other authors suspected the performance of IG on skewed text corpora [11].
Besides the classical methods, many improved methods have been proposed. For example, Yang et al. [19] considered the terms whose relative term frequency was larger than a predefined threshold , and then modified the IG formula to select features. Forman [5] proposed the Bi-Normal Separation (BNS) method, which used the standard Normal distribution’s inverse cumulative probability function to construct feature selection function. Uguz [15] proposed a two-stage feature selection method for TC by combining IG, principal component analysis and genetic algorithm. More and more methods have been generated, such as, mr2PSO [16], and improved TFIDF method [17]. It is worth noting that -test has been used for gene expression and genotype data [14, 21]. However, the variable in gene expression or genotype data is different from that in text data, i.e., the term frequency. Thus we try to validate the role of -test in text feature selection.
From document frequency perspective, the above methods almost use DF sufficiently. However, no efficient method is proposed from term frequency perspective. It inspires our motivation of this paper. Our paper makes the following contributions:
(1) Using central limit theorem (CLT), we prove that the frequency distribution of a term within a specific category or within the entire collection will be approximately normally distributed.
(2) We model the diversity of the frequency of a term between the specific category and the entire corpus with -test. It means that if the distribution of one term within the specific category is obviously different with that within the entire corpus, the term can be considered to be feature.
(3) We verify our new approach on two common text corpora with three well-established classifiers. The experiments show that our approach is comparable to or even slightly better than the state-of-the-art and ECE in terms of both macro- and micro- , and it outperforms IG and MI methods significantly on unbalanced text corpus.
2 Feature Selection Metrics
Many feature selection approaches have been proposed in TC tasks, but we only give detailed analysis on four methods because they have been widely used and achieved better performance, the formulae can be found in Refs [20, 5, 6]. They are: Chi-Square Statistic (), Information Gain (IG), Mutual Information (MI), and Expected Cross-Entropy (ECE).
was proposed by Pearson early in 1900 [20]. The statistic is used to measure the lack of independence between and , and can be regards as the distribution with one degree of freedom. In real-world corpus, statistic is based, however, on several assumptions that do not hold for most textual analysis [4]. For instance, if term occurs in 50% documents of a specific category and term occurs in 49% documents, but the frequency of is much higher than that of . Experts often think term should have more discriminating power than in the specific category . , however, will be prone to select term as feature, rather than . The problem is that is not reliable for low-frequency terms [4].
The weakness of MI is that the score is strongly influenced by the marginal probabilities of terms, because rare terms will have a higher score than common terms. Therefore, the scores are not comparable across terms of widely differing frequency [20, 9]. Besides, MI gives longer documents higher weights in the estimation of the feature scores.
IG was firstly used as attribute selection measure in decision tree [20]. This measure is from entropy in information theory, which studies the value or “information content” of messages. IG is defined as the difference between the original information requirement (i.e., based on just the proportion of classes) and the new requirement (i.e., obtained after partitioning on term ). IG is also called average mutual information. The weakness of IG method is that it prefers to select terms distributed in many categories, but these terms have less discriminating power in TC tasks. Differing from IG, Expected Cross-Entropy (ECE) [8] only considers the terms occurred in a document and ignores the absent terms.
As we know, if a term (except stop words) occurs frequently within a specific category, the term should be considered as a feature or discriminator of the category. For example, “computer" occurs frequently in the IT category. However, the above methods are all based on document frequency, and ignore the term frequency. In next section, we will propose a new approach based on term frequency, and it can capture the information of high-frequency terms.
3 New Approach Based on term frequency and t-test
The -test, namely the student -test, is often used to assess whether the means of two classes are statistically different from each other by calculating a ratio between the difference of two class means and the variability of the two classes [21]. In this section, we explain why the averaged term frequency within a single category or in the whole corpus is approximately normal using Lindeberg-Levy central limit theorems, and then how the -test is constructed based on the averaged term frequencies.
Let us consider the term frequency in text corpus consisting of documents. Given a vocabulary V, the term frequency () of a term in the th document can be considered as a random variable, which subjects to some unknown distribution, e.g., multinomial model [10]. In the multinomial model, a document is an ordered sequence of word events drawn from the same vocabulary V, and the probability of each word event in a document is independent of the word’s context and position in the document. Therefore, each document is drawn from a multinomial distribution of words with as many independent trials [10]. That is, the occurrence of one term in each document is dominated by a multinomial function. Then,
(1) Let be a random sample of size , where is the number of documents in the collection, and is the term frequency of in th document. That is, a sequence of independent and identically distributed random variables with expected values and variances , where is the distributed probability of term in the collection. Each sample belongs to one of classes .
(2) Let be the sample average of these random variables in terms of .
(3) Let be the sample average of term in category , where is an indicator to discriminate whether document belongs to , and is the total samples in class .
According to Lindeberg-Levy central limit theorems (LV CLT) [1], is approximately normal with mean and variance , denoted as ; And is approximately normal with mean and variance , denoted as .
Then we know that is also approximately normal distributed with mean and variance . The variance (Var) is induced as follows:
| (1) |
Besides, we define the pooled within-class deviation as follows:
| (2) |
According to the definition of the -test [18], we construct the following formula:
| (3) |
where is standard deviation, and .
The Eq. 3 is used to measure whether the means of the two normal distributions (i.e., and ) have the statistically significant difference. The bigger the value of is, the larger the difference of the means is. For some threshold , if the , it implies that the averaged frequency of term in the specific category has the same or similar mean with that in the entire corpus; Otherwise, it implies the averaged frequency of term in the specific category is significantly different from that in the entire corpus, and the term has more discriminating power for the specific category . Compared with the average of term frequency in the entire corpus, the term occurred many or few times in can be considered as the feature of category .
We combine the category-specific scores of a term into two alternate ways:
| (4) |
| (5) |
4 Experimental Setup
4.1 Data Sets
Reuters-21578 111Available on http://ronaldo.cs.tcd.ie/esslli07/sw/step01.tgz: The Reuters corpus is a widely used benchmark collection [4, 5, 20, 19]. According to the ModApte split, we get a collection of 52 categories (9100 documents) after removing unlabeled documents and documents with more than one class label. Reuters-21578 is a very skewed data set. Altogether 319 stop words, punctuation and numbers areremoved. All letters are converted into lowercase, and the word stemming is applied.
20Newsgroup 222Available on http://kdd.ics.uci.edu/databases/20newsgroup.: The Newsgroup is also a widely used benchmark [4, 5, 20], and consists of 19,905 documents, which are uniformly distributed in twenty categories. We randomly divide it into training and test sets by 2:1, and only keep “Subject”, “Keyword” and “Content”. The stop words list has 823 words, and we filter words containing non-characters. All letters are converted into lowercase and word stemming is applied.
Each document is represented by a vector in the term space, and term weighting is calculated by standard [12], and then the vector is normalized to have one unit length.
4.2 Classifiers
In our experiments, we choose three well-established classifiers for the comparison purpose. They are: Support Vector Machines (SVMs) [3], weighted kNN classifier (NN) [20], and classic Centroid-based Classifier (CC) [7]. The SVMs implementation we use is LIBSVM [2] with linear kernels. For NN, we set [20]. The similarity measure we use is the cosine function.
4.3 Performance Measures
We measure the effectiveness of classifiers in terms of widely used for TC. For multi-class task, is estimated in two ways, i.e., the macro-averaged (macro-) and the micro-averaged (micro-), as the following:
| (6) |
| (7) |
where is the value of the predicted th class, and and are the precision and recall values across all classes, respectively. In general, macro- gives the same weight to all categories. In contrast, micro- gives the same weight to each instance, which can be dominated by the performance of common or majority categories.
5 Results
Firstly, We show one case study of -test in real-world corpus. Tables 1 lists the scores of seven different feature selection functions for the selected four terms in category “acq” from the real-life corpus, i.e., Reuters-21578. Based on the literal meaning, the first two terms, i.e., “acquir" and “stake", are closely related to the content of category “acq”, while the last two terms, i.e., “payout" and “dividend", belong to other category. However, according to the , ECE, and TF methods, we wrongly select “acquir" and “dividend" as the features of category “acq”, whereas -test, IG and MI select the features correctly.
| acquir | stake | payout | dividend | |
| 28.053 | 22.567 | 3.272 | 17.796 | |
| 479.482 | 270.484 | 131.104 | 344.045 | |
| 0.078 | 0.042 | 0.009 | 0.036 | |
| 1.283 | 1.126 | 0.362 | 0.830 | |
| 0.084 | 0.050 | 0.028 | 0.060 | |
| 749 | 646 | 232 | 903 |
Then, we show the performance of -test on two corpora with three classifiers. For Reuters-21578, the number of feature space is all, 17000, 15000, 13000, 11000, 10000, 8000, 6000, 4000, and 2000, respectively, accounting to ten groups of data sets. On 20 Newsgroup corpus, the original feature space reaches up to 210 thousand and we only select less terms as features to save training time. The dimensionality of feature space is all, 2000, 1500, 1000, 500, and 200, respectively, accounting to six groups of data sets.
For , MI, and -test methods, we tested the two alternative combinations, i.e., and ways. We observed that the averaged way was always better than the maximized way for multi-classes problem. Thus we only report the best results of three methods.
5.1 Performance of t-test with kNN classifier
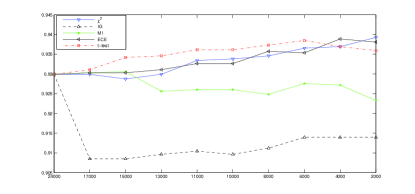
The macro- and micro- of five methods with NN on imbalanced Reuters-21578 are shown in Fig. 1, Fig. 2, respectively. It is clear that -test, , and ECE achieve evidently better performance than MI and IG in terms of macro-. However, the diversity among the three methods is small. As shown in Fig. 1, when the number of feature space is larger than 13000, , and ECE is a little better than -test; However, when the number of features falls in [8000, 13000], -test performs the best macro-.
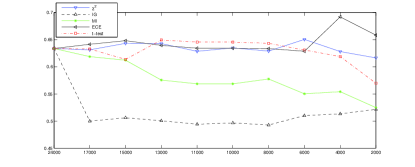
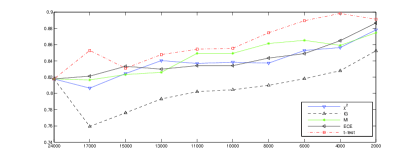
The micro- of five methods increases as the number of features decreases, as shown in Fig. 2. It demonstrates that NN often obtains better performance with less features. Our -test method performs consistently the best in distinct feature dimensionality, and the highest micro- of -test is 89.8% when the number of features is 4000, which improves up to 4.2% than . IG achieves the worst performance in the all experiments on skewed corpus with NN.
As shown in Fig. 1 and Fig. 2, for unbalanced multi-class tasks, we find IG is inferior to MI in terms of both macro- and micro-, whereas IG is superior to MI for binary classification tasks according to the comparative experiments of Yang et al [20]. The conflict shows that feature selection methods depends on the practical classification problem.
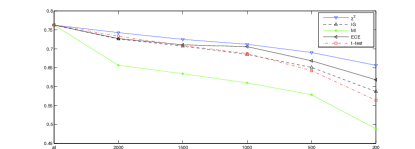
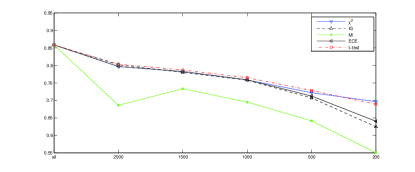
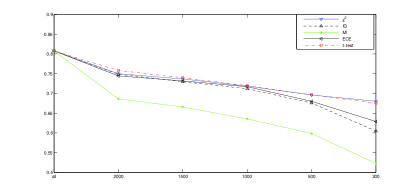
Because macro- on balanced corpus is close to micro- , we only show the results of micro- on 20 Newsgroup. As shown in Fig. 3, the micro- of both and IG are slightly better than our -test method, and the four methods are obviously better than MI. Especially, the performance of IG is comparable to , and ECE on balanced corpus.
5.2 Performance of t-test with SVMs classifier
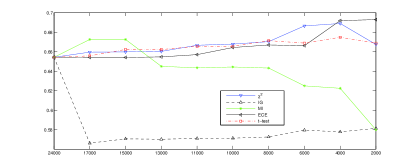
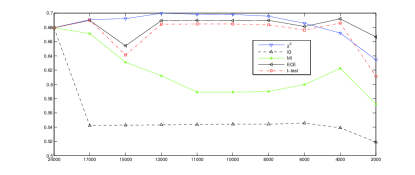
Fig. 4 and Fig. 5 depict the macro- and micro- of different methods on the Reuters-21578 corpus using SVMs. The -test, , and ECE methods perform similar performances, which are better than IG and MI methods. Meanwhile, the macro- scores of three methods increase as the number of features reduces. It is worth noting that MI does better than other methods when the number of features is in [15,000, 24,411], and then MI falls dramatically.
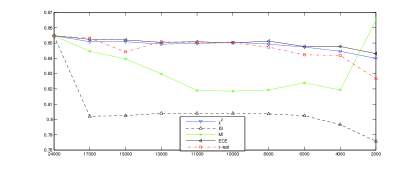
The performance of these methods in terms of micro- on Reuters-21578 corpus is shown in Fig. 5. The micro- points of different feature selection methods show a tendency to increase as the number of the features decreases. However, these methods show consistent performance in micro-, and the -test method is still the best among these methods.
5.3 Performance of t-test with Centroid-based classifier
For centroid-based classifier, the macro- of five methods is shown in Fig. 7. We can observe that , ECE, and -test do better than MI and IG methods, and is slightly better than ECE and -test. The same conclusion can be done in terms of micro-, as shown in Fig. 8.
Meanwhile, our -test is slightly better than , ECE, and IG methods on 20 Newsgroup corpus. The four methods outperform the MI method significantly.
6 Conclusion and Future Work
In this paper, we proposed a new feature selection method based on term frequency and -test. Then we compare our approach with the state-of-the-art methods on two corpora using three classifiers in terms of macro- and micro-. Extensive experiments have indicated that our new approach offers comparable performance with , and ECE, even slightly better than them. In future work, we will verify our method on more text collections.
References
- [1] P. Billingsley. Probability and Measure (Third ed.). John Wiley & sons, 1995, 357-363.
- [2] C. Chang and C. Lin. Libsvm: a library for support vector machines. 2001.
- [3] C. Cortes and V. Vapnik. Support-vector networks. Machine Learning, 1995, (20), 273-297.
- [4] T. Dunning. Accurate methods for the statistics of surprise and coincidence. Comput. Linguist., 1993, 19(1), 61-74.
- [5] G. Forman. An extensive empirical study of feature selection metrics for text classification. Journal of Machine Learning Research, 2003, 3, 1289-1305.
- [6] I. Guyon and A. Elisseeff. An introduction to variable and feature selection. Journal of Machine Learning Research, 2003, 3, 1157-1182.
- [7] E.-H. Han and G. Karypis. Centroid-based document classification: Analysis & experimental results. In: Proceedings of PKDD, 2000.
- [8] D. Koller and M. Sahami. Hierarchically classifying documents using very few words. In: Proceedings of ICML, 1997, 170-178.
- [9] S. Li, R. Xia, C. Zong, and C. Huang. A framework of feature selection methods for text categorization. In: Proceedings of 47th ACL and the 4th AFNLP, 2009.
- [10] A. McCallum and K. Nigam. A comparison of event models for naive bayes text classification. In Proceedings of the AAAI-98 Workshop, 1998.
- [11] D. Mladenic and M. Grobelnik. Feature selection for unbalanced class distribution and naive bayes. In: Proceedings of ICML, 1999.
- [12] G. Salton and C. Buckley. Term-weighting approaches in automatic text retrieval. Information Processing & Management, 1988, 24(5), 513-523.
- [13] F. Sebastiani. Machine learning in automated text categorization. ACM Comput Surv, 2002, 34(1), 1-47.
- [14] R. Tibshirani, T. Hastie, B. Narasimhan, and G. Chu. Diagnosis of multiple cancer types by shrunken centroids of gene expression. Proc. Natl. Acad. Sci., 2002, 99: 6567-6572.
- [15] H. Uguz. A two-stage feature selection method for text categorization by using information gain, principal component analysis and genetic algorithm. Knowl.-Based Syst., 2011, 24(7): 1024-1032.
- [16] A. Unler, A. Murat, and R. B. Chinnam. mr2pso: A maximum relevance minimum redundancy feature selection method based on swarm intelligence for support vector machine classification. Inf. Sci., 2011, 181(20):4625-4641.
- [17] Y.-Q. Wei, P.-Y. Liu, and Z.-F. Zhu. A feature selection method based on improved tfidf. In: Proceedings of the ICPCA, 2008, 94-97.
- [18] S. William. The probable error of a mean. Biometrika, 1908, 6(1), 1-25.
- [19] S.-M. Yang, X. Wu, and Z. Deng. Relative term-frequency based feature selection for text categorization. In: Proceedings of ICMLC, 2002.
- [20] Y.-M. Yang and J.-P. Pedersen. A comparative study on feature selection in text categorization. In: Proceedings of ICML, 1997, 412-420.
- [21] N.-N. Zhou and L.-P. Wang. A modified t-test feature selection method and its application on the hapmap genotype data. Geno. Prot. Bioinfo., 2007, 5(3-4), 242-249.