Braess’s Paradox in Epidemic Game: Better Condition Results in Less Payoff
Abstract
Facing the threats of infectious diseases, we take various actions to protect ourselves, but few studies considered an evolving system with competing strategies. In view of that, we propose an evolutionary epidemic model coupled with human behaviors, where individuals have three strategies: vaccination, self-protection and laissez faire, and could adjust their strategies according to their neighbors’ strategies and payoffs at the beginning of each new season of epidemic spreading. We found a counter-intuitive phenomenon analogous to the well-known Braess’s Paradox, namely a better condition may lead to worse performance. Specifically speaking, increasing the successful rate of self-protection does not necessarily reduce the epidemic size or improve the system payoff. This phenomenon is insensitive to the network topologies, and can be well explained by a mean-field approximation. Our study demonstrates an important fact that a better condition for individuals may yield a worse outcome for the society.
I Introduction
Recent outbreaks of global infectious diseases, including SARS (Severe Acute Respiratory Syndrome), H1N1 (Swine Influenza) and H5H1 (Avian Influenza), have caused major public healthy threats owing to their potential mortalities and substantial economic impacts. According to the report of WHO, infectious diseases cause more than 10 million deaths annually and accounting for 23% of the global disease burden Organization et al. (2004). Various interventions thus have been developed to control infectious diseases, such as vaccination, treatment, quarantining and behavior change programs (e.g., social distancing and partner reduction) Enns et al. (2011).
Though preemptive vaccination is the fundamental method for preventing transmission of infectious diseases as well as reducing morbidity and mortality Bauch et al. (2003); Bauch and Earn (2004); Perisic and Bauch (2009a), practically, the immunization of individuals is more than a voluntary behavior owing to the economic costs, logistical limitations, religious reasons, side effects, and so on Schimit and Monteiro (2011). Therefore, instead of vaccinating, people may prefer to take some self-protective actions including reducing outside activities, detouring to avoid epidemic areas, wearing face masks, washing hands frequently, and so forth Meloni et al. (2011); Perra et al. (2011); Fenichel et al. (2011); Sahneh et al. (2012). Generally speaking, these self-protective actions are less costly and cannot guarantee the safety against the diseases.
Under such complicated environment, an individual’s strategy usually results from a tradeoff between cost and risk. For instance, people may be laissez-faire to the spreading of common flu, while they will take vaccination for hepatitis B since the vaccines are very effective and hepatitis B is very difficult to be eradicated. In contrast, people prefer to take self-protection against HIV since its consequence is terrible while the effectivity and side effects of vaccines are both unknown. Accordingly, game-theoretic models may be suitable to characterize these decision-making processes Bauch et al. (2003); Bauch and Earn (2004); Bauch (2005); Vardavas et al. (2007); Basu et al. (2008); Perisic and Bauch (2009b). Bauch et al. Bauch et al. (2003); Bauch and Earn (2004) analyzed population behavior under voluntary vaccination policies for childhood diseases via a game-theoretic framework, and they found that voluntary vaccination is unlikely to reach the group-level optimum due to the risk perception in vaccines and the effect of herd immunity. Bauch Bauch (2005) studied a game model in which individuals adopt strategies according to an imitation dynamics, and found that oscillations in vaccine uptake can emerge under different conditions, for example, vaccinating behavior is very sensitive to the changes in disease prevalence. Vardavas et al. Vardavas et al. (2007) considered the effects of voluntary vaccination on the prevalence of influenza based on a minority game, and found that severe epidemics could not be prevented unless vaccination programs offer incentives. Basu et al. Basu et al. (2008) proposed an epidemic game model for HPV vaccination based on the survey data on actual perceptions regarding cervical caner, showing that the actual vaccination level is far lower than the overall vaccination goals. Perisic and Bauch Perisic and Bauch (2009b) studied the interplay between epidemic spreading dynamics and individual vaccinating behavior on social contact networks. Compared with the homogeneously mixing model, they found that increasing the neighborhood size of the contact network can eliminate the disease if individuals decide whether to vaccinate by accounting for infection risks from neighbors.
As mentioned above, in most related works, individuals are usually divided into two opposite classes: vaccinated and laissez-faire, while less attention is paid on other alterative strategies in between. In this paper, we propose an evolutionary epidemic game model to study the effects of self-protection on the system payoff and epidemic size. We find a counter-intuitive phenomenon analogous to the well-known Braess’s Paradox Braess1968 in network traffic, that is, the increasing of successful rate of self-protection may, on the contrary, decrease the system payoff. We provide a mean-field solution, which well reproduces such observations. This study raises an unprecedent challenge on how to lead the masses of people when facing an epidemic, since sufficient knowledge about and effective protecting skills to the infectious disease, which sound very helpful for every individual, may eventually enlarge the epidemic size and cause losses for the society.
II Model definition
Considering a seasonal flu-like disease that spreads through a social contact network Fu et al. (2011); Wu et al. (2011). At the beginning of a season, each individual could choose one of the three strategies: vaccination, self-protection or laissez faire. If an individual gets infected during this epidemic season, she will pay a cost . A vaccinated individual will pay a cost that accounts for not only the monetary cost of the vaccine, but also the perceived vaccine risks, side effects, long-term healthy impacts, and so on. We assume that the vaccine could perfectly protect vaccinated individuals. A self-protective individual will pay a less cost , while a laissez-faire individual pays nothing. Denote the successful rate of self-protection, that is, a self-protective individual will be equivalent to a vaccinated individual with probability or be equivalent to a laissez-faire individual with probability . This will be determined right after an individual’s decision for simplicity. Obviously, . Without loss of generality, we set the cost of being infected as . Table 1 presents the payoffs for different strategies and outcomes.
When the strategy of every individual is fixed, all individuals can be divided into two classes: susceptible ones including laissez-faire individuals and part of self-protective individuals, and irrelevant individuals (they are equivalent to be removed from the system) including vaccinated ones and all other self-protective individuals. The susceptible individuals probably get infected while the irrelevant individuals will not affect or be affected by the epidemic dynamics. Among all susceptible individuals, individuals are randomly selected and set to be infected initially. The spreading dynamics follows the standard susceptible-infected-removed (SIR) model Anderson and May (1992), where at each time step, each infected individual will infect all her susceptible neighbors with probability , and then she will turn to be a removed individual with probability . The spreading ends when no infected individual exists. Then, the number of removed individuals, , is called the epidemic size or the prevalence.
| Healthy | Infected | |
|---|---|---|
| Laissez-faire | ||
| Self-protected | ||
| Vaccinated | N/A |
After this epidemic season, every individual updates her strategy by imitating her neighborhood. Firstly, she will randomly select one neighbor and then decide whether to take this neighbor’s strategy. We apply the Fermi rule Traulsen et al. (2006); Perc and Szolnoki (2010), namely an individual will adopt the selected neighbor ’s strategy with probability
| (1) |
where means the strategy of , is ’s payoff in the last season, and the parameter characterizes the strength of selection: smaller means that individuals are less responsive to payoff difference. After the moment all individuals have decided their strategies (and thus their roles in the epidemic spreading are also decided), a new season starts.
III Results
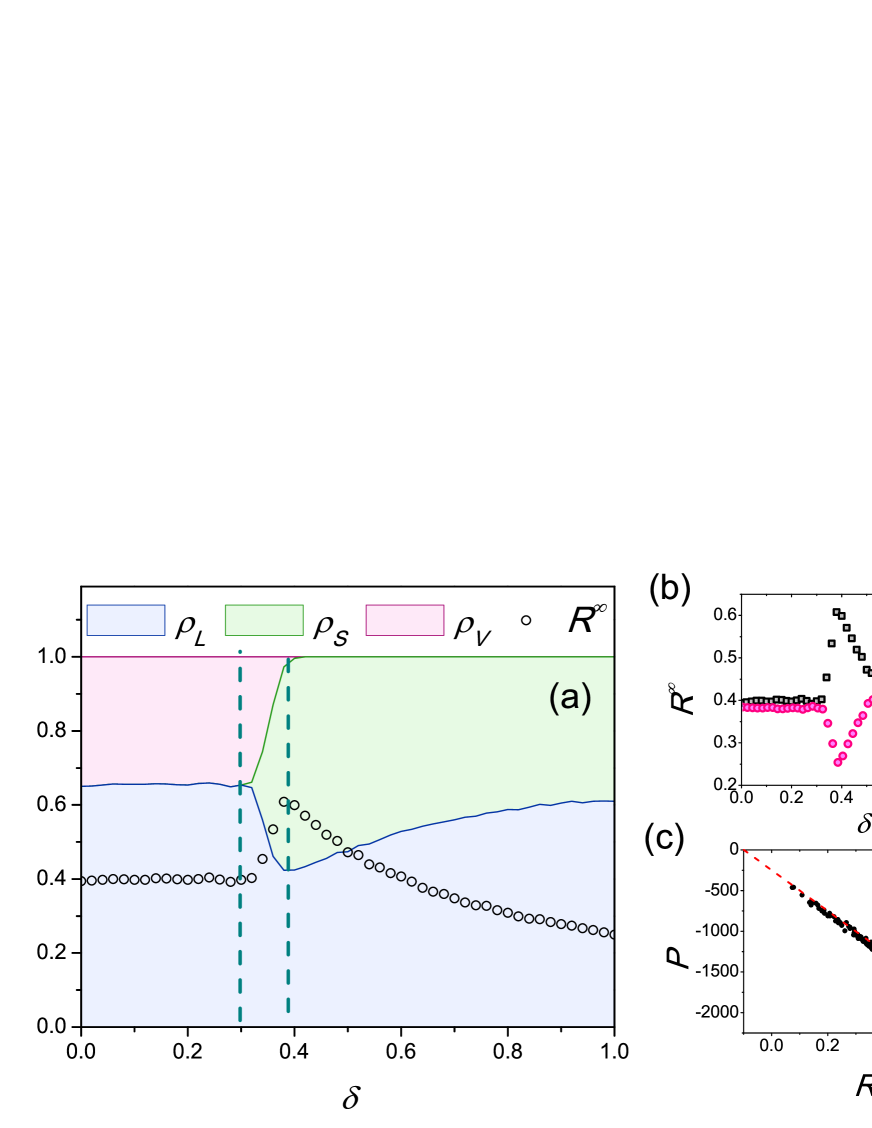
We first study the model on square lattices with von Neumann neighborhood and periodic boundary conditions. Figure 1(a) presents the effects of the successful rate of self-protection, , on the decision makings of individuals and the epidemic size. Clearly, as the increasing of , the condition gets better and better. A counter-intuitive phenomenon is observed when lies in the middle range (from about 0.3 to about 0.4), during which a better condition leads to a larger epidemic size. One may think that though the epidemic size becomes larger, the system payoff (the sum payoff of all individuals) could still get higher since individuals pay less in choosing self-protection than vaccination. However, as shown in figure 1(b) and 1(c), the system payoff is strongly negatively correlated with the epidemic size. That is to say, a better condition (i.e., a larger ) could result in worse performance in view of both the larger epidemic size and the less system payoff. This is very similar to the so-called Braess’s Paradox, which states that adding extra capacity to a network when the moving entities selfishly choose their route, can in some cases reduce overall performance Braess1968 ; Roughgarden2005 .
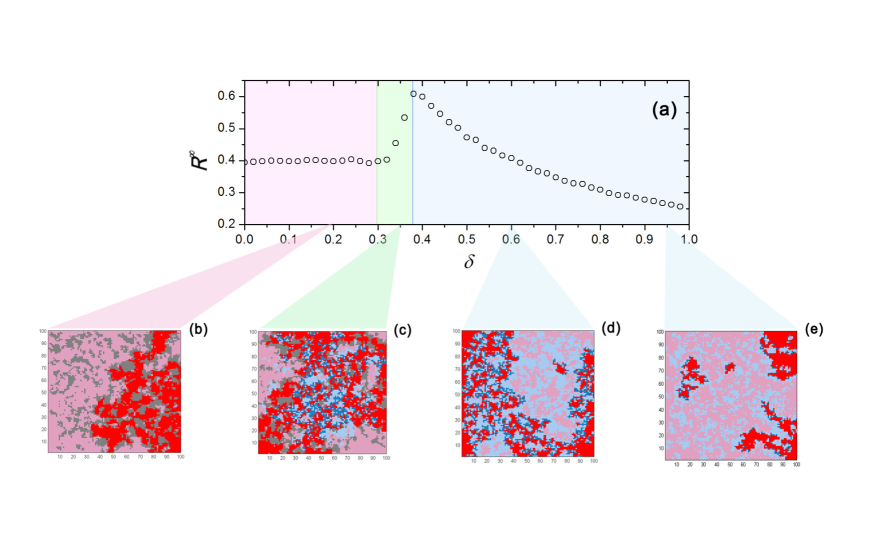
Figure 2 shows the strategy distribution patterns of four representative cases. When is small, it is unwise to take self-protection because of its low efficiency, and people prefer to take vaccination or laissez faire. As shown in figure 2(b), there are only two strategies, vaccination and laissez faire, and thus has no effect on the epidemic size. Both infected and not infected laissez-faire individuals form percolating clusters, and are nearly (not fully) separated by vaccinated individuals. Of course, this kind of partial separation can only be possible when the number of vaccinated individuals is considerable. When gets larger, more and more individuals take self-protection and fewer and fewer individuals take vaccination or laissez faire. Since only a fraction, , of self-protective individuals are equivalent to the vaccinated individuals, the system contains more susceptible individuals. In addition, these susceptible individuals are less protected since the number of irrelevant individuals becomes smaller. Such two factors lead to the increase of the epidemic size and the decrease of the system payoff. As shown in figure 2(c), the light-red percolating cluster is fragmented into pieces due to the decrease of irrelevant individuals, which is also a reason of the decrease of the fraction of laissez-faire individuals: being laissez-faire becomes more risky now. When is large, the superiority of self-protection becomes more striking and no one takes vaccination, then the epidemic size decreases as increases. As shown in figure 2(d), self-protective and laissez-faire individuals coexist. As the increasing of , though the self-protection strategy is more efficient, the laissez faire strategy is more attractive since the irrelevant individuals becomes more and thus for susceptible individuals, the risk of being infected becomes smaller. This is the reason why the fraction of laissez-faire individuals become more and more in the right range. In fact, when is very large, the laissez-faire and not infected individuals again form a percolating cluster. Please see figure 2(e) for the example case at .
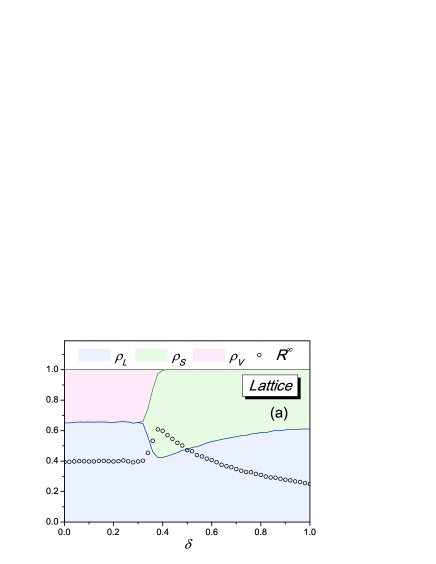
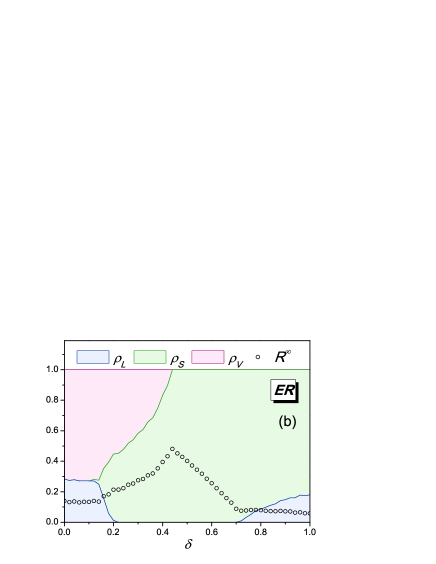
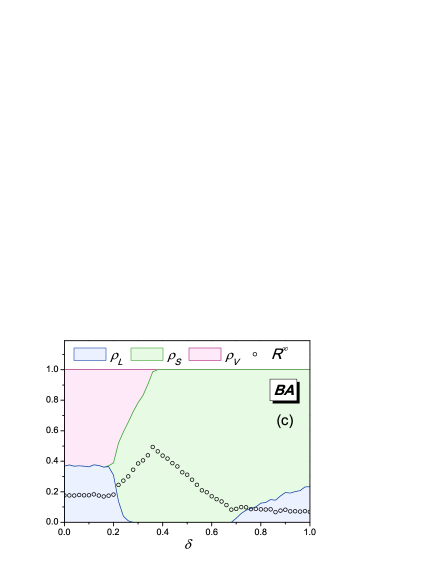
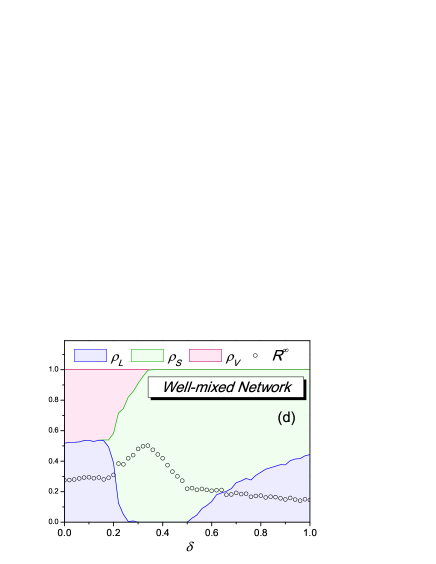
Figures S1-S5 verify the universality of the counter-intuitive phenomenon. Figure S1 reports the epidemic size as a function of for square lattices with different sizes, suggesting that our main results are insensitive to the network size. To verify the insensitivity to network structures, we implement the model on disparate networks including the Erdös-Rényi (ER) networks Erdős and Rényi (1959), the Barabási-Albert (BA) networks Barabási and Albert (1999) and the well-mixed networks (i.e., fully connected networks or called complete networks). As shown in figure 3, in despite to the quantitative difference, the counter-intuitive phenomenon is observed for all kinds of networks. Figures S2-S5 present systematical simulation results about the effects of different parameters on different kinds of networks. For every kind of networks, one can observe the counter-intuitive phenomenon when the condition is hold.
Although the phenomenon is qualitatively universal for different kinds of networks, as shown in figure 3, there are quantitative differences between square lattices and other kinds of networks: (i) in ER, BA and well-mixed networks, the self-protection strategy gets promoted and could become the sole strategy in a certain range of ; (ii) the epidemic size in ER, BA and well-mixed networks is smaller than that in square lattices. In square lattices, laissez-faire individuals could form clusters that are guarded by the surrounding irrelevant individuals. Then they paid nothing but can escape from the infection. On the contrary, ER, BA and well-mixed networks do not display localized property and thus to choose laissez-faire strategy is of high risk. Therefore, with delocalization, the laissez-faire strategy is depressed while the self-protection strategy gets promoted and less individuals will get infected.
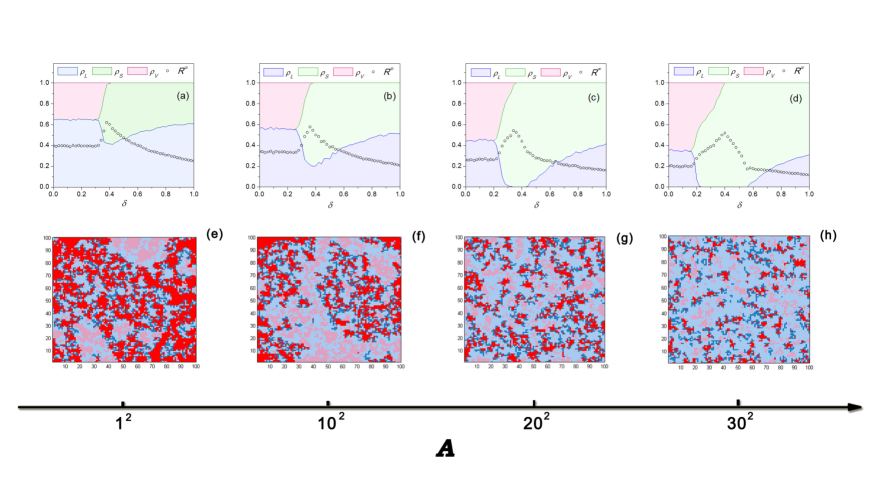
To verify the above inference, we remove a number of edges in the square lattice and randomly add the same number of edges. During this randomizing process, the network connectivity is always guaranteed and the self-connections and multi-connections are always not allowed. The number of removed edges, , can be used to quantify the strength of delocalization. As shown in figure 4, with the increasing of , the self-protection strategy gets promoted and the clusters of not infected laissez-faire individuals are fragmented into small pieces. When gets larger and larger, the strategy distribution pattern becomes closer and closer to that of ER, BA and well-mixed networks. The gradually changing process in figure 4 clearly demonstrates that the main reason resulting in the quantitative differences is the structural localization effects. In a word, the ER, BA and well-mixed display essentially the same results since they do not have many localized clusters.
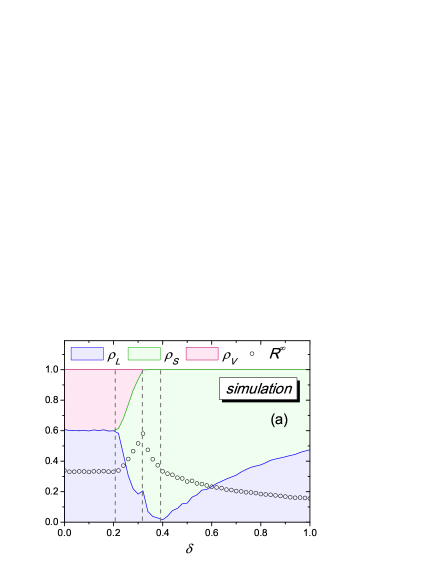
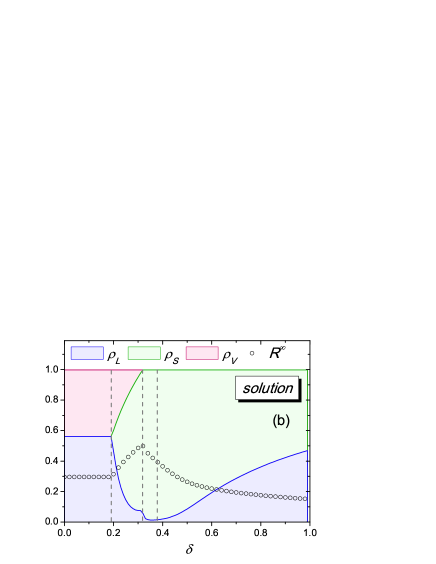
Lastly, we present an analytical solution based on the mean-field approximation for well-mixed networks (see Methods), which could reproduce the counter-intuitive phenomenon. Figure 5 compares the analytical prediction with simulation, indicating a good accordance.
IV Discussion
Spontaneous behavioral responses to epidemic situation are recognized to have significant impacts on epidemic spreading, and thus to incorporating human behavior into epidemiological models can enhance the models’ utility in mimicking the reality and evaluating control measures Zhang et al. (2012, 2010); Salathé and Bonhoeffer (2008); Poletti et al. (2011); Funk et al. (2009); Coelho and Codeço (2009); Funk et al. (2010). To this end, we proposed an evolutionary epidemic game where individuals can choose their strategies towards infectious diseases and adjust their strategies according to their neighbors’ strategies and payoffs.
Strikingly, we found a counter-intuitive phenomenon that a better condition (i.e., larger successful rate of self-protection) may unfortunately result in less system payoff. It is because when the successful rate of self-protection increases, people become more speculative and less interested in vaccination. Since a vaccinated individual indeed brings benefit to the system by statistically reducing the infection probability of susceptible individuals, the decreasing of vaccinated individuals will eventually lead to the loss of system payoff. Qualitatively speaking, the counter-intuitive phenomenon is insensitive to the network topology, while quantitatively speaking, networks with delocalized structure (e.g., ER, BA and well-mixed networks) have more self-protective individuals and less laissez-faire individuals than networks with localized structure (e.g., square lattices), and the epidemic size is larger in the latter case. Without the diverse behavioral responses of individuals, epidemic in delocalized structure usually spreads more quickly and widely than in localized structure Eguiluz2002 ; Zhou2006 . The opposite observation reported in the current model again results from more and more speculative choices (i.e., to be laissez-faire) at a low-risky situation. Therefore, this can be considered as another kind of “less payoff in better condition” phenomenon.
The observed counter-intuitive phenomenon reminds us of the well-known Braess’s Paradox in network traffic Braess1968 ; Roughgarden2005 . Zhang et al. Zhang2007 showed that to remove some specific edges in a network can largely enhance its information throughput, and Youn et al. Youn2008 pointed out that some roads in Boston, New York City and London could be closed to reduce predicted travel times. Actually, Seoul has removed a highway to build up a park, which, beyond all expectations, maintained the same traffic but reduced the travel time Baker2009 . Very recently, Pala et al. Pala2012 showed that Braess’s Paradox may occur in mesoscopic electron systems, that is, adding a path for electrons in a nanoscopic network may paradoxically reduce its conductance. This work provides another interesting example analogous to Braess’s Paradox, namely a higher successful rate of self-protection may eventually enlarge the epidemic size and thus cause system loss. Let’s think of the prisoner’s dilemma, if every prisoner stays silent, they will be fine, while one more choice, to betray, makes the situation worse for them. Analogously, if the successful rate is small, few people will choose to be self-protective, while for larger , people have more choices, which may eventually reduce the number of vaccinated people and thus enlarge the epidemic size. Basically, both the original Braess’s Paradox and the current counter-intuitive phenomenon are partially due to the additional choices to selfish individuals. This is easy to be understood in a simple model like the prisoner’s dilemma game, but it is impressive to observe such phenomenon in a complex epidemic game.
Human-activated systems are usually much more complex than our expectation, since people’s choices and actions are influenced by the environment and at the same time their choices and actions have changed the environment. This kind of interplay leads to many unexpected collective responses to both emergencies and carefully designed policies, which, fortunately, can still be modeled and analyzed to some extent. This work raises an unprecedent challenge to the public health agencies about how to lead the population towards an epidemic. The government should take careful consideration on how to distribute their resources and money on popularizing vaccine, hospitalization, self-protection, self-treatment, and so on.
V Methods
Given a well-mixed network with size , the dynamical equations are
| (2) | |||||
| (3) | |||||
| (4) |
where , and stand for the fraction of susceptible, infected and recovered individuals, respectively. Dividing Eq. (2) by Eq. (4), one has
| (5) |
where is the basic reproduction number for the standard SIR model in well-mixed population Anderson and May (1992). Integrating Eq. (5), we get
| (6) |
which leads to the solution
| (7) |
Clearly, , , and in the thermodynamic limit, . Accordingly,
| (8) |
Let , and be the fraction of vaccinated, self-protective and laissez-faire individuals, such that . Since only a fraction of individuals are susceptible, using the similar techniques, one can easily obtain the epidemic size as
| (9) |
where . Then, the probability of a susceptible individual to be infected reads
| (10) |
The payoffs of different strategies and states are thus easily to be obtained, which are summarized in Table 2.
| Strategy & State | Fraction | Payoff |
|---|---|---|
| Vaccinated & Healthy | ||
| Self-protective & Healthy | ||
| Self-protective & Infected | ||
| Laissez-faire & Healthy | ||
| Laissez-faire & Infected |
The imitation dynamics governing the time evolution of the fractions of strategies in the population is similar to the replicator dynamics of evolutionary game theory Wu et al. (2011); Poletti et al. (2009), as
| (11) | |||||
| (12) | |||||
where
| (13) | |||||
and the others are similar.
Denote by the initial fraction of vaccinated individuals before the th season of epidemic spreading. Given , and , and for each season, we apply the initial conditions as , and , where , depending on the distribution of strategies at this season. Then, can be obtained by Eq. (9) and by Eq. (10). Using the evolutionary dynamics described in Eqs. (11)-(13) and the fractions presented in Table 2, one can obtain the values of , and , which are also the initial fractions of strategies at the beginning of the next season. Repeat the above steps until the steady state, then we can calculate the desired variables.
Acknowledgements.
This work was partially supported by the National Natural Science Foundation of China under Grant Nos. 11005001, 11005051, 11222543, 11135001, 11275186, 91024026 and 10975126. H.-F.Z. acknowledges the Doctoral Research Foundation of Anhui University under Grant No. 02303319. T.Z. acknowledges the Program for New Century Excellent Talents in University under Grant No. NCET-11-0070.References
- Organization et al. (2004) W. H. Organization, R. Beaglehole, A. Irwin, and T. Prentice, The world health report 2004: Changing history (World Health Organization, 2004).
- Enns et al. (2011) E. Enns, J. Mounzer, and M. Brandeau, Mathematical Biosciences 235, 138 (2011).
- Bauch et al. (2003) C. T. Bauch, A. P. Galvani, and D. J. D. Earn, Proceedings of the National Academy of Sciences of the United States of America 100, 10564 (2003).
- Bauch and Earn (2004) C. Bauch and D. Earn, Proceedings of the National Academy of Sciences of the United States of America 101, 13391 (2004).
- Perisic and Bauch (2009a) A. Perisic and C. Bauch, BMC Infectious Diseases 9, 77 (2009a).
- Schimit and Monteiro (2011) P. Schimit and L. Monteiro, Ecological Modelling 222, 1651 (2011).
- Meloni et al. (2011) S. Meloni, N. Perra, A. Arenas, S. Gómez, Y. Moreno, and A. Vespignani, Scientific Reports 1, 62 (2011).
- Perra et al. (2011) N. Perra, D. Balcan, B. Gonçalves, and A. Vespignani, PLoS ONE 6, e23084 (2011).
- Fenichel et al. (2011) E. Fenichel, C. Castillo-Chavez, M. Ceddia, G. Chowell, P. Parra, G. Hickling, G. Holloway, R. Horan, B. Morin, C. Perrings, et al., Proceedings of the National Academy of Sciences of the United States of America 108, 6306 (2011).
- Sahneh et al. (2012) F. Sahneh, F. Chowdhury, and C. Scoglio, Scientific Reports 2, 632 (2012).
- Bauch (2005) C. Bauch, Proceedings of the Royal Society B: Biological Sciences 272, 1669 (2005).
- Vardavas et al. (2007) R. Vardavas, R. Breban, and S. Blower, PLoS Computational Biology 3, e85 (2007).
- Basu et al. (2008) S. Basu, G. Chapman, and A. Galvani, Proceedings of the National Academy of Sciences of the United States of America 105, 19018 (2008).
- Perisic and Bauch (2009b) A. Perisic and C. Bauch, PLoS Computational Biology 5, e1000280 (2009b).
- (15) D. Braess, Unternehmensforschung 12, 258 (1968).
- Fu et al. (2011) F. Fu, D. Rosenbloom, L. Wang, and M. Nowak, Proceedings of the Royal Society B: Biological Sciences 278, 42 (2011).
- Wu et al. (2011) B. Wu, F. Fu, and L. Wang, PLoS ONE 6, e20577 (2011).
- Anderson and May (1992) R. Anderson and R. May, Infectious diseases of humans: dynamics and control (Oxford Univ Press, Oxford, UK, 1992).
- Traulsen et al. (2006) A. Traulsen, M. Nowak, and J. Pacheco, Physical Review E 74, 011909 (2006).
- Perc and Szolnoki (2010) M. Perc and A. Szolnoki, BioSystems 99, 109 (2010).
- (21) T. Roughgarden, Selfish Routing and the Price of Anarchy (MIT Press, 2005).
- Erdős and Rényi (1959) P. Erdős and A. Rényi, Publ. Math. Debrecen 6, 290 (1959).
- Barabási and Albert (1999) A. Barabási and R. Albert, Science 286, 509 (1999).
- Zhang et al. (2012) H. Zhang, M. Small, X. Fu, G. Sun, and B. Wang, Physica D: Nonlinear Phenomena 241, 1512 (2012).
- Zhang et al. (2010) H. Zhang, J. Zhang, C. Zhou, M. Small, and B. Wang, New Journal of Physics 12, 023015 (2010).
- Salathé and Bonhoeffer (2008) M. Salathé and S. Bonhoeffer, Journal of The Royal Society Interface 5, 1505 (2008).
- Poletti et al. (2011) P. Poletti, M. Ajelli, and S. Merler, PLoS ONE 6, e16460 (2011).
- Funk et al. (2009) S. Funk, E. Gilad, C. Watkins, and V. Jansen, Proceedings of the National Academy of Sciences of the United States of America 106, 6872 (2009).
- Coelho and Codeço (2009) F. Coelho and C. Codeço, PLoS Computational Biology 5, e1000425 (2009).
- Funk et al. (2010) S. Funk, M. Salathé, and V. Jansen, Journal of The Royal Society Interface 7, 1247 (2010).
- (31) V. M. Eguíluz, K. Klemm, Physical Review Letters 89, 108701 (2002).
- (32) T. Zhou, Z.-Q. Fu, B.-H. Wang, Progress in Natural Science 16, 452 (2006).
- (33) G.-Q. Zhang, D. Wang, G.-J. Li, Physical Review E 76, 017101 (2007).
- (34) H. Youn, M. T. Gastner, H. Jeong, Physical Review Letters 101, 128701 (2008).
- (35) L. Baker, Scientific American pp. 20-21, Feb. 2009.
- (36) M. G. Pala, S. Baltazar, P. Liu, H. Sellier, B. Hackens, F. Martins, V. Bayot, X. Wallart, L. Desplanque, S. Huant, Physical Review Letters 108, 076802 (2012).
- Poletti et al. (2009) P. Poletti, B. Caprile, M. Ajelli, A. Pugliese, and S. Merler, Journal of Theoretical Biology 260, 31 (2009).