Late-Time Dust Emission from the Type IIn Supernova 1995N
Abstract
The Type IIn supernovae (SNe IIn) have been found to be associated with significant amounts of dust. These core-collapse events are generally expected to be the final stage in the evolution of highly-massive stars, either while in an extreme red supergiant phase or during a luminous blue variable phase. Both evolutionary scenarios involve substantial pre-supernova mass loss. I have analyzed the SN IIn 1995N in MCG 0238017 (Arp 261), for which mid-infrared archival data obtained with the Spitzer Space Telescope in 2009 (14.7 yr after explosion) and with the Wide-field Infrared Survey Explorer (WISE) in 2010 (15.6–16.0 yr after explosion) reveal a luminous () source detected from 3.4 to 24 m. These observations probe the circumstellar material, set up by pre-SN mass loss, around the progenitor star and indicate the presence of – of pre-existing, cool dust at K. This is at least a factor 10 lower than the dust mass required to be produced from SNe at high redshift, but the case of SN 1995N lends further evidence that highly massive stars could themselves be important sources of dust.
Subject headings:
dust, extinction — circumstellar matter — Stars: mass-loss — supernovae: general — supernovae: individual (SN 1995N) — galaxies: individual (MCG 0238017, Arp 261)1. Introduction
The origin of cosmic dust is still an open question. The dust grains may well have come from stars, although dust may also form in situ in the interstellar medium (Draine, 2009). The presence of in quasi-stellar objects at redshift (cosmic age 700 Myr) indicates that dust formation in these very young systems must have been rapid (Bertoldi et al., 2003). Asymptotic giant branch (AGB) stars, evolved from main sequence stars with , are most efficient, but can only contribute significantly to the “dust budget” in a galaxy after Myr (Dwek & Cherchneff, 2011), and will dominate dust production for galaxy ages –2 Gyr (Galliano, Dwek, & Chanial, 2008). A faster dust-production channel is massive stars () and their endpoints as core-collapse supernovae (CCSNe). To account for the total dust mass in these early galaxies, of dust from each SN is necessary (Todini & Ferrara, 2001; Nozawa et al., 2003). The problem is that, for nearby CCSNe, the most common of which are the SNe II-Plateau (II-P), the dust yields inferred from mid-infrared observations of the SNe II-P with the Spitzer Space Telescope are in the general range of (Meikle et al., 2007) to a few (Kotak et al., 2009; Andrews et al., 2011a). One caveat is that much of the dust formed in these SNe could be cold, particularly for older events. Evidence to this effect exists in the form of the – at –23 K found by Matsuura et al. (2011) for SN 1987A with the Herschel Space Observatory.
The progenitors of SNe II-P are thought to have initial masses (Smartt et al., 2009; Van Dyk et al., 2012). Another class of CCSNe, the SNe II-narrow (SNe IIn; Schlegel, 1996; Filippenko, 1997), likely arise from progenitor stars that initially were significantly more massive than this. For example, the SN IIn 1998S may have come from a highly-massive red supergiant (RSG), which, prior to explosion, experienced a “superwind” (Fransson et al., 2005), possibly analogous to the very luminous Galactic RSG VY CMa (Smith, Hinkle, & Ryde, 2009; Mauerhan & Smith, 2012). On the other hand, indications are that the SN IIn 2005gl was the explosion of a star which was experiencing a luminous blue variable phase at the time (Gal-Yam et al., 2007; Gal-Yam & Leonard, 2009). The most extreme SNe IIn may be pair-instability events (with ; e.g., Woosley, Blinnikov, & Heger, 2007). A number of SNe IIn show evidence, via radio, X-ray, and optical observations (e.g., Williams et al., 2002; Milisavljevic et al., 2008; Chandra et al., 2012), for sustained interaction between the SN shock and a dense, massive circumstellar medium (CSM) set up through extensive pre-SN mass loss (e.g., Kiewe et al., 2012). The potential, therefore, exists for SNe IIn to be associated with more substantial quantities of dust than SNe II-P.
Searches for and detections of dust from SNe IIn have been conducted, with some promising results (e.g., Gerardy et al., 2002; Fox et al., 2009; Andrews et al., 2011b; Fox et al., 2011; Tanaka et al., 2012). Fox et al. (2011), for instance, found a range of dust masses associated with their sample of SNe IIn, from to , within an order-of-magnitude of the required dust mass from SNe in high-redshift galaxies. The origin of the infrared (IR) dust emission is uncertain: It could arise from circumstellar dust heated by the forward SN shock (Tanaka et al., 2012) or from dust formed in a cold, dense shell (CDS) within the interaction region between the SN shock and the CSM (e.g. Smith, Foley, & Filippenko, 2008). Fox et al. (2011) concluded that the IR emission from SNe IIn detected at late times most likely arises from pre-existing CSM dust, which is heated by radiation emitted from ongoing shock-CSM interaction. Two regimes of warm dust (in the shock or CDS) and cool dust (in the heated CSM) both could exist for some SNe IIn (Stritzinger et al., 2012).
Here I consider SN 1995N. This SN was discovered on 1995 May 5 at an age 10 months and was spectroscopically classified as a SN IIn (Pollas et al., 1995). The SN host galaxy is MCG 0238017 (Arp 261), at a distance of 24 Mpc (Fransson et al., 2002). Optical photometry and spectroscopy of the SN were obtained for over a decade by Gruendl et al. (2002), Li et al. (2002), and Pastorello et al. (2005, 2011). Fransson et al. (2002) analyzed Hubble Space Telescope (HST) ultraviolet (UV) and optical spectroscopy. SN 1995N is also a luminous and long-lived radio (Chandra et al., 2009) and X-ray (Fox et al., 2000; Chandra et al., 2005; Zampieri et al., 2005) source. Pastorello et al. (2011) noted that the narrow-width ( km s-1) components of the emission lines, observed by Fransson et al. (2002), weakened over time and the high-ionization forbidden lines, seen at early times, disappeared altogether, while intermediate-width (3000–4000 km s-1) lines of H, [O i], [O ii], and [O iii], which are thought to be associated with the unshocked ejecta, increased in prominence at late times.
Fransson et al. (2002) determined that the velocities and densities measured and inferred from the narrow lines in the spectra were typical for the CSM of RSGs. Based on the overall properties for SN 1995N, they speculated that the progenitor was analogous to the highly-luminous RSG VY CMa and post-RSG IRC +10420, both of which have superwinds with mass-loss rates of – yr-1 and initial masses . Such a high mass-loss rate is necessary to account for the dense CSM and strong SN-CSM interaction. From their near-IR photometry and spectroscopy, Gerardy et al. (2002) found a significant IR excess from SN 1995N at ages –2493 d, which they argued could be explained by an IR echo of the initial flash from the SN, although reprocessing by dust of the X-ray/UV emission from the CSM interaction could feasibly provide additional IR emission at late times.
2. Observations
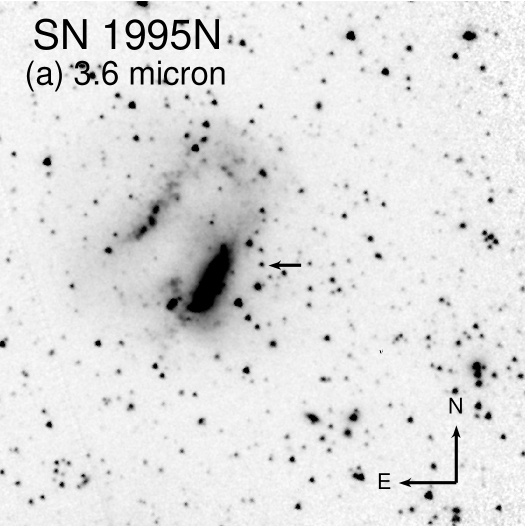
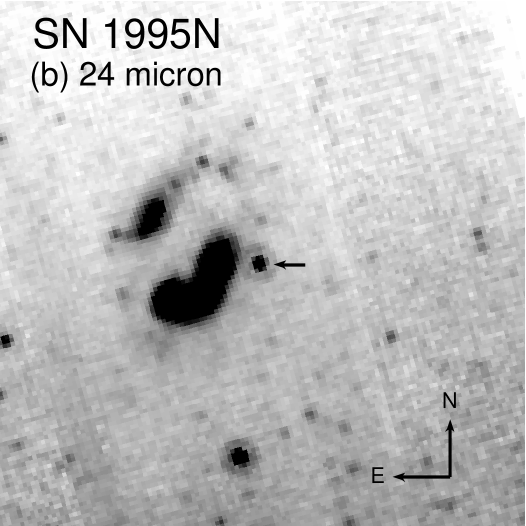
The host galaxy of SN 1995N was observed with Spitzer with the Infrared Array Camera (IRAC; Fazio et al., 2004) at 3.6, 4.5, 5.8, and 8.0 m and with the Multiband Imaging Photometer for Spitzer (MIPS; Rieke et al., 2004) at 24 and 70 m on 2009 March 19 and 29, respectively, as part of program 50454 (PI: B. J. Smith). (UT dates are used throughout this manuscript.) I obtained the publicly available data from the Spitzer Heritage Archive. A source, as shown in Figure 1, is clearly detected at all observed wavelengths, except at 70 m, for which the observations were most likely not sensitive enough. In fact, as seen in Figure 1b, it is one of the brightest objects seen in or around the host galaxy in the 24 m data. Its position in the 3.6 m data is RA (J2000) = 14h 49m , Dec (J2000) = °10′, in very good agreement with the radio position (Chandra et al., 2009), making it highly likely that this is the old SN. The separation of the SN from the host undoubtedly contributes to the ease of detection in these bands. For the explosion date of 1994 July 4 assumed by Fransson et al. (2002), the age of the SN when the Spitzer data were obtained is 14.7 yr. SN 1995N, then, can be included in the “transitional” age range for CCSNe, discussed by Tanaka et al. (2012), between younger SNe and SN remnants.
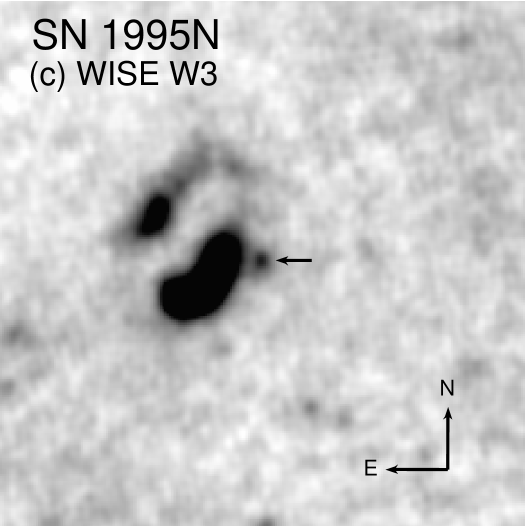
The SN field was also observed on 2010 January 31/February 1 (age 15.6 yr) and July 31/August 1 (16.0 yr) by the Wide-field Infrared Survey Explorer (WISE; Wright et al., 2010) in all four of its cryogenic bands at 3.4, 4.6, 12, and 22 m. I show in Figure 1c the SN as seen in the Atlas Image in band W3 (12 m). I will discuss the photometry from these WISE data below.
3. Analysis
I used the MOPEX (MOsaicking and Point source EXtraction; Makovoz & Khan, 2005; Makovoz & Marleau, 2005) package provided by the Spitzer Science Center (SSC) to mosaic the individual artifact-corrected Basic Calibrated Data (BCDs) and produce a single image mosaic in each band (for both IRAC and MIPS, I left the first frame out of each set of observations when mosaicking, since it often has a far shorter exposure time than the rest of the BCDs and therefore adds mostly noise to the mosaic). I also applied the array location-dependent photometric corrections to the IRAC BCDs within MOPEX. Flux measurements were obtained with point-response function (PRF) fitting within APEX (Astronomical Point source EXtractor), in multi-frame mode for IRAC and single-frame mode for MIPS. I used a spatially-variable PRF mapping, provided online by the SSC, for the IRAC image analysis. A single SSC-provided PRF was used to obtain the photometry from the MIPS 24 m mosaic. The PRF fluxes were aperture- and color-corrected following the prescriptions provided by the online instrument handbooks111For IRAC, http://irsa.ipac.caltech.edu/data/SPITZER/docs/irac/iracinstrumenthandbook/ and, for MIPS, http://irsa.ipac.caltech.edu/data/SPITZER/docs/mips/mipsinstrumenthandbook/.. The flux densities for SN 1995N in each band are listed in Table 1 and are shown in Figure 2.
One can see in Figure 2 that the data are nominally consistent with a blackbody spectrum at dust temperature K. The blackbody radius is cm ( AU or pc). (This holds if the dust is optically thick, whereas I assume, below, that the dust is optically thin; so, this radius is effectively a lower limit on the actual size of the dust shell; e.g., Fox et al. 2011.) For the progenitor wind speed of km s-1 (Fransson et al., 2002), matter at this radius was lost by the star yr prior to explosion. Assuming the SN shock was expanding at km s-1 (Zampieri et al., 2005) when the Spitzer data were obtained, after yr the shock radius would have been cm. The shock therefore appears to be within the blackbody radius, so it is unlikely that the dust was freshly formed in the SN ejecta (the dust is also relatively cold, and, if freshly formed, we would expect it to be warmer) or within the CDS in the interaction region. It is more likely that the emission arises from pre-existing dust in the unshocked CSM.
Following Dwek (1983), I can estimate the radius, , of the dust-free cavity that the SN evacuated in the dusty CSM by its initial outburst. I can constrain the maximum blue luminosity from the optical light curves shown in Pastorello et al. (2005); note, however, that we do not know the actual maximum, since the SN was discovered at months in age. I therefore estimate that the luminosity erg s-1, based on the earliest available data in the and bands and assuming Galactic foreground extinctions from Schlafly & Finkbeiner (2011; NED222NED is the NASA/IPAC Extragalactic Database, http://ned.ipac.caltech.edu/.). From Dwek (1983; his Equation 8), assuming a grain emissivity (appropriate for silicate grains; see below), m, and K (i.e., the evaporation temperature for silicates), I estimate that this radius is cm, likely well within both the blackbody and shock radius in 2009.
Following Hildebrand (1983) and Bouchet et al. (2006), the wavelength-dependent flux density for an optically thin point source (an “idealized dust cloud”) is
| (1) |
where is the Planck function at the dust temperature , is the dust mass, is the distance to the host galaxy in Mpc, and is the mass absorption coefficient for the dust. This latter term is given by
| (2) |
where is the wavelength-dependent dust absorption coefficient, is the dust grain radius, and is the grain mass density. Here I have assumed the dust models from Laor & Draine (1993) for graphite and smoothed UV “astronomical silicates,” with g cm-3 (Weingartner & Draine 2001) and g cm-3 (Draine & Lee 1984), respectively. I have selected a single grain size, m, although the choice of has little impact on in the Rayleigh limit ().
One can see in Figure 2 that the silicate dust model spectrum from Equation 1 compares reasonably well with the 8 and 24 m data points, less so for the shorter-waveband data. Dust models that are predominantly silicates have been applied previously for a number of SNe (e.g., Bouchet et al. 2006; Meikle et al. 2007; Kotak et al. 2009; Tanaka et al. 2012). Additionally, if the SN 1995N progenitor were analogous to IRC +10420, we might expect the CSM to be composed primarily of silicate dust (e.g., Blöcker et al. 1999). The graphite model provides a better comparison at the shortest bands, however, it is a comparatively poorer match at 8 and 24 m. Unfortunately, the overall dust spectrum, compared to the Spitzer data, is relatively unconstrained, since no Spitzer observations were obtained of this field with the Infrared Spectrograph (IRS) in either Peak-Up Imaging mode at 16 m or in Staring spectroscopic mode. (The observations that were conducted, although obtained during the cryogenic phase of the Spitzer mission, did not become publicly available till well after the cryogen was exhausted, when IRS observations were no longer possible.) The high 70 m upper limit (not shown) provides a poor constraint on the model.
Although no additional Spitzer observations were obtained, I consider the flux densities for the SN from the WISE All-Sky Data Release in all four bands, using the zero points and color corrections provided in the WISE Explanatory Supplement333http://wise2.ipac.caltech.edu/docs/release/allsky/expsup/.. The flux densities are given in Table 2 and shown in Figure 3. Interestingly, the WISE data tend to agree better with the graphite model than with the silicate one. I note, however, as the Explanatory Supplement warns, that the flux densities in bands W1 and W2 at these low levels are systematically underestimated. Additionally, a measure of the reliability of a WISE flux extraction is a comparison of the number of individual frames for which profile fitting for the photometry was possible, for sources with a signal-to-noise ratio on each frame, versus the total number of available individual frames. For these observations, the total in all four bands was 25 frames; the numbers of frames for which profile-fit flux measurements were possible were 15, 3, 12, and 0, respectively, for W1, W2, W3, and W4 (the ultimate is only in W4). Therefore, as a result of the lower sensitivity of the WISE survey data compared to the relatively deep, pointed Spitzer observations, the WISE data for SN 1995N should possess less weight in the overall analysis.
Integrating the silicate model dust spectrum, the total IR luminosity emitted by the dust would then be erg s-1, or . The IR luminosity of the blackbody alone is erg s-1 (the luminosity of the graphite model is essentially the same as this). Gerardy et al. (2002) modeled the near-IR emission from SN 1995N using an IR echo model from a pre-existing, spherically-symmetric CSM, following the formalism of Emmering & Chevalier (1988). I show in Figure 4 the luminosity of the SN in 2009, estimated both from the blackbody and the silicate dust model, and compare these with an extrapolation in time of the model light curve that Gerardy et al. (2002) constructed with the assumption that the input luminosity from the SN is a short flash. One can see that the echo model underpredicts the observations by a factor . The echo alone, therefore, cannot account for the observed SN mid-IR luminosity. Note, however, that the model light curve was fit by Gerardy et al. (2002) to an extrapolation of the near-IR color, which represents only the hottest dust. (Mid-IR observations at earlier times, had they been feasible, would have provided a better constraint on the total IR evolution and would have sampled dust at a larger range of temperatures.) Note also that for this light curve model Gerardy et al. assumed that some pre-SN event had created the dust-free cavity in the CSM, rather than the SN itself, and they treated and as being independent of each other. However, we would not necessarily expect such an event for a progenitor star analogous to the post-RSG IRC +10420.
The luminosity from the echo model potentially can be augmented if I also take into account the dust emission resulting from the absorption and reprocessing of the X-ray and UV radiation arising from the shock-CSM interaction. Gerardy et al. (2002) also pointed out that the IR emission from SN 1995N at very late times could be better explained by sustained emission from the CSM interaction. The X-rays from this interaction were first detected on 1996 July 23 (Lewin et al. 1996; Fox et al. 2000; Chandra et al. 2005), d after explosion (it is unknown when this X-ray emission from the interaction began). The time-averaged X-ray (0.1–2.4 and 0.5–7.0 keV) unabsorbed flux from the light curves in Chandra et al. (2005) corresponds to erg s-1. No similar UV light curve exists for the SN, however, a partial estimate of the UV luminosity can be obtained by integrating the HST FOS UV spectrum analyzed by Fransson et al. (2002) and by assuming an extinction of mag (NED; Schlafly & Finkbeiner 2011). This results in erg s-1. From Draine & Lee (1984; their Figure 11) the Planck-averaged emissivity of silicate grains at K is , irrespective of grain size. Thus, although without constructing a detailed model, I can account for an additional erg s-1 of reprocessed X-ray and UV flux from the dust. (This estimate does not include the sustained optical emission from the CSM interaction.) In total, then, it is feasible that the very late-time IR luminosity from SN 1995N is a combination of both a fading IR echo from the initial SN flash and dust re-radiation of the emission produced by the long-term interaction of the shock and the CSM.
It is not known what was the level of CSM interaction occurring when the Spitzer data were obtained. The epochs of the Spitzer and WISE observations were well past the last X-ray and radio data obtained by Chandra et al. (2005) and Chandra et al. (2009), respectively. Furthermore, the last optical spectrum from 2010 shown in Pastorello et al. (2011) appears to be dominated by the intermediate-width H and forbidden O lines, presumably from the unshocked ejecta.
The dust mass that results from the simple silicate model spectrum (Equation 1) is . The graphite model, which provides an overall poor comparison with the Spitzer data, requires an even larger dust mass of . Assuming a gas-to-dust ratio of (Savage & Mathis 1979), this implies that the total mass in the nebula containing the dust is –. The mass-loss rate from the progenitor star was likely high, at yr-1 (Zampieri et al. 2005). Such a mass-loss rate is consistent with that found for IRC +10420 (– yr-1; e.g., Humphreys et al. 1997). Zampieri et al. (2005) concluded that the wind was clumpy up to yr of the X-ray light curve for SN 1995N, and that the CSM density distribution must have been smoother farther out (at later times in the interaction). No indication exists, even at later times (e.g., Pastorello et al. 2011), for any extinction other than that from the Galactic foreground (e.g., Fransson et al. 2002). So, the assumption of optically thin dust in the nebula is supported.
However, if the SN 1995N progenitor was analogous to IRC +10420, the latter star is currently surrounded by an optically thick dust shell (e.g., Blöcker et al. 1999). Much of the dust that existed outside of the dust-free cavity in the inner CSM of SN 1995N could have been destroyed by the outgoing shock in the assumed months after explosion and before discovery — at an expansion velocity of 10000 km s-1 (the highest velocity inferred from the broad emission line component; Fransson et al. 2002), the shock would have expanded to cm, or % of the blackbody radius. The broad component has weakened in more recent spectra (Pastorello et al. 2011), so the expansion has decelerated (as the shock moved through the dense CSM). Nonetheless, as calculated above, the shock was already at % of the blackbody radius in 2009, so a significant fraction of the dust in the CSM possibly has been destroyed. The star IRC +10420 shows outer, spherical circumstellar shells ejected from the star 3000 yr ago (e.g., Tiffany et al. 2010) — if the SN 1995N progenitor was analogous to this star, then the dust emission from 2009–2010 may have been from similar shells in the outermost extent of the CSM. In summary, this indicates that the total gas and dust mass of the CSM around the progenitor initially may have been substantially larger than the estimate I have made, above, based on the dust mass implied by the Spitzer observations.
4. Conclusions
I have detected very late-time (14.7–16 yr) emission in the mid-IR (3.4–24 m) from the SN IIn 1995N, using archival data from Spitzer and WISE. This emission provides an important probe of the circumstellar environment of the progenitor star. I have applied a simple silicate dust model, which agrees best with the Spitzer data, and have found that this model is consistent with a blackbody temperature of 240 K and a IR luminosity of erg s-1 for the dust. A graphite model does not compare as well with the Spitzer observations, although it does compare better with the less-sensitive WISE data. I conclude that the dust emission did not arise from freshly-formed dust in the ejecta or from dust condensing in the CDS of the shock interaction region. This emission more likely arose from pre-existing circumstellar dust, heated by a combination of the long-lived IR echo from the initial SN flash and the sustained X-ray/UV (and, probably, optical) flux from the SN shock/CSM interaction, e.g., as modeled by Gerardy et al. (2002). Much of the original dust in the progenitor pre-SN wind has likely been destroyed as the shock has expanded through the CSM. This result, of heated pre-existing dust in the CSM, is consistent with what has been found for the SN IIn 2010jl by Andrews et al. (2011b) and for the Type “Ibn” SN 2006jc by Mattila et al. (2008).
Fransson et al. (2002) speculated that the SN 1995N progenitor was a highly-luminous RSG which had experienced a super-wind, analogous to the extreme Galactic RSG VY CMa and the post-RSG IRC +10420. The size of the dust-emitting region (radius AU) inferred for SN 1995N is comparable to the largest extent of the CSM around VY CMa and IRC +10420, and the mass in the SN 1995N progenitor nebula is comparable to that found for the two Galactic stars (Smith et al. 2001; Smith, Hinkle, & Ryde 2009; Tiffany et al. 2010). The mid-IR data, therefore, lends credence to this view of the SN progenitor.
The observed late-time dust emission from SN 1995N implies that the dust mass was –. I note that, although the observed dust is relatively cool, K, even colder dust, at K, may exist in even larger quantities and simply was not detected in the mid-IR by Spitzer and WISE, as has been found for SN 1987A (Matsuura et al. 2011) and, e.g., the Crab Nebula (Gomez et al. 2012). Unfortunately, no Herschel observations of SN 1995N will have been conducted during that mission’s operations. As has been suggested before, e.g., by Mattila et al. (2008), evidence is continuing to accrue that the highly-massive progenitors of these strongly-interacting SNe, rather than the SNe themselves, may contribute significant amounts of dust to galaxies. Such a scenario could be extendable to galaxies early in cosmic history.
References
- Andrews et al. (2011a) Andrews, J. E., Sugerman, B. E. K., Clayton, G. C., et al. 2011a, ApJ, 731, 47
- Andrews et al. (2011b) Andrews, J. E., Clayton, G. C., Wesson, R., et al. 2011b, AJ, 142, 45
- Bertoldi et al. (2003) Bertoldi, F., Carilli, C. L., Cox, P., et al. 2003, A&A, 406, L55
- Blöcker et al. (1999) Blöcker, T., Balega, Y., Hofmann, K.-H., et al. 1999, A&A, 348, 805
- Bouchet et al. (2006) Bouchet, P., Dwek, E., Danziger, J., et al. 2006, ApJ, 650, 212
- Chandra et al. (2005) Chandra, P., Ray, A., Schlegel, E. M., Sutaria, F. K., & Pietsch, W. 2005, ApJ, 629, 933
- Chandra et al. (2009) Chandra, P., Stockdale, C. J., Chevalier, R. A., et al. 2009, ApJ, 690, 1839
- Chandra et al. (2012) Chandra, P., Chevalier, R. A., Chugai, N., et al. 2012, ApJ, 755, 110
- Draine (2009) Draine, B. T. 2009, Cosmic Dust - Near and Far, 414, 453
- Draine & Lee (1984) Draine, B. T., & Lee, H. M. 1984, ApJ, 285, 89
- Dwek (1983) Dwek, E. 1983, ApJ, 274, 175
- Dwek & Cherchneff (2011) Dwek, E., & Cherchneff, I. 2011, ApJ, 727, 63
- Emmering & Chevalier (1988) Emmering, R. T., & Chevalier, R. A. 1988, AJ, 95, 152
- Fazio et al. (2004) Fazio, G. G., Hora, J. L., Allen, L. E., et al. 2004, ApJS, 154, 10
- Filippenko (1997) Filippenko, A. V. 1997, ARA&A, 35, 309
- Fox et al. (2000) Fox, D. W., Lewin, W. H. G., Fabian, A., et al. 2000, MNRAS, 319, 1154
- Fox et al. (2009) Fox, O., Skrutskie, M. F., Chevalier, R. A., et al. 2009, ApJ, 691, 650
- Fox et al. (2011) Fox, O. D., Chevalier, R. A., Skrutskie, M. F., et al. 2011, ApJ, 741, 7
- Fransson et al. (2002) Fransson, C., Chevalier, R. A., Filippenko, A. V., et al. 2002, ApJ, 572, 350
- Fransson et al. (2005) Fransson, C., Challis, P. M., Chevalier, R. A., et al. 2005, ApJ, 622, 991
- Galliano, Dwek, & Chanial (2008) Galliano, F., Dwek, E., & Chanial, P. 2008, ApJ, 672, 214
- Gal-Yam et al. (2007) Gal-Yam, A., Leonard, D. C., Fox, D. B., et al. 2007, ApJ, 656, 372
- Gal-Yam & Leonard (2009) Gal-Yam, A., & Leonard, D. C. 2009, Nature, 458, 865
- Gerardy et al. (2002) Gerardy, C. L., Fesen, R. A., Nomoto, K., et al. 2002, ApJ, 575, 1007
- Gomez et al. (2012) Gomez, H. L., Krause, O., Barlow, M. J., et al. 2012, ApJ, 760, 96
- Gruendl et al. (2002) Gruendl, R. A., Chu, Y.-H., Van Dyk, S. D., & Stockdale, C. J. 2002, AJ, 123, 2847
- Hildebrand (1983) Hildebrand, R. H. 1983, QJRAS, 24, 267
- Humphreys et al. (1997) Humphreys, R. M., Smith, N., Davidson, K., et al. 1997, AJ, 114, 2778
- Kiewe et al. (2012) Kiewe, M., Gal-Yam, A., Arcavi, I., et al. 2012, ApJ, 744, 10
- Kotak et al. (2009) Kotak, R., Meikle, W. P. S., Farrah, D., et al. 2009, ApJ, 704, 306
- Laor & Draine (1993) Laor, A., & Draine, B. T., 1993, ApJ, 402, 441
- Lewin et al. (1996) Lewin, W. H. G., Zimmermann, H.-U., & Aschenbach, B. 1996, IAU Circ., 6445, 1
- Li et al. (2002) Li, W., Filippenko, A. V., Van Dyk, S. D., et al. 2002, PASP, 114, 403
- Makovoz & Khan (2005) Makovoz, D., & Khan, I. 2005, Astronomical Data Analysis Software and Systems XIV, 347, 81
- Makovoz & Marleau (2005) Makovoz, D., & Marleau, F. R. 2005, PASP, 117, 1113
- Matsuura et al. (2011) Matsuura, M., Dwek, E., Meixner, M., et al. 2011, Science, 333, 1258
- Mattila et al. (2008) Mattila, S., Meikle, W. P. S., Lundqvist, P., et al. 2008, MNRAS, 389, 141
- Mauerhan & Smith (2012) Mauerhan, J., & Smith, N. 2012, MNRAS, 424, 2659
- Meikle et al. (2007) Meikle, W. P. S., Mattila, S., Pastorello, A., et al. 2007, ApJ, 665, 608
- Milisavljevic et al. (2008) Milisavljevic, D., Fesen, R. A., Leibundgut, B., & Kirshner, R. P. 2008, ApJ, 684, 1170
- Nozawa et al. (2003) Nozawa, T., Kozasa, T., Umeda, H., Maeda, K., & Nomoto, K. 2003, ApJ, 598, 785
- Pastorello et al. (2005) Pastorello, A., Aretxaga, I., Zampieri, L., Mucciarelli, P., & Benetti, S. 2005, 1604-2004: Supernovae as Cosmological Lighthouses, 342, 285
- Pastorello et al. (2011) Pastorello, A., Benetti, S., Bufano, F., et al. 2011, Astronomische Nachrichten, 332, 266
- Pollas et al. (1995) Pollas, C., Albanese, D., Benetti, S., Bouchet, P., & Schwarz, H. 1995, IAU Circ., 6170, 1
- Rieke et al. (2004) Rieke, G. H., Young, E. T., Engelbracht, C. W., et al. 2004, ApJS, 154, 25
- Savage & Mathis (1979) Savage, B. D., & Mathis, J. S. 1979, ARA&A, 17, 73
- Schlafly & Finkbeiner (2011) Schlafly, E. F., & Finkbeiner, D. P. 2011, ApJ, 737, 103
- Schlegel (1996) Schlegel, E. M. 1996, AJ, 111, 1660
- Smartt et al. (2009) Smartt, S. J., Eldridge, J. J., Crockett, R. M., & Maund, J. R. 2009, MNRAS, 395, 1409
- Smith et al. (2001) Smith, N., Humphreys, R. M., Davidson, K., et al. 2001, AJ, 121, 1111
- Smith, Foley, & Filippenko (2008) Smith, N., Foley, R. J., & Filippenko, A. V. 2008, ApJ, 680, 568
- Smith, Hinkle, & Ryde (2009) Smith, N., Hinkle, K. H., & Ryde, N. 2009, AJ, 137, 3558
- Stritzinger et al. (2012) Stritzinger, M., Taddia, F., Fransson, C., et al. 2012, ApJ, 756, 173
- Tanaka et al. (2012) Tanaka, M., Nozawa, T., Sakon, I., et al. 2012, ApJ, 749, 173
- Tiffany et al. (2010) Tiffany, C., Humphreys, R. M., Jones, T. J., & Davidson, K. 2010, AJ, 140, 339
- Todini & Ferrara (2001) Todini, P., & Ferrara, A. 2001, MNRAS, 325, 726
- Van Dyk et al. (2012) Van Dyk, S. D., Cenko, S. B., Poznanski, D., et al. 2012, ApJ, 756, 131
- Weingartner & Draine (2001) Weingartner, J. C., & Draine, B. T. 2001, ApJ, 548, 296
- Williams et al. (2002) Williams, C. L., Panagia, N., Van Dyk, S. D., et al. 2002, ApJ, 581, 396
- Woosley, Blinnikov, & Heger (2007) Woosley, S. E., Blinnikov, S., & Heger, A. 2007, Nature, 450, 390
- Wright et al. (2010) Wright, E. L., Eisenhardt, P. R. M., Mainzer, A. K., et al. 2010, AJ, 140, 1868
- Zampieri et al. (2005) Zampieri, L., Mucciarelli, P., Pastorello, A., et al. 2005, MNRAS, 364, 1419
| Wavelength | Measured | PRF-CorrectedaaAperture and pixel-phase corrections from the IRAC Instrument Handbook. | Color-CorrectedbbColor corrections from the IRAC Instrument Handbook, assuming a blackbody at 240 K. |
|---|---|---|---|
| Flux Density | Flux Density | Flux Density | |
| (m) | (Jy) | (Jy) | (Jy) |
| 3.6 | 61.3 | 43.8 | |
| 4.5 | 123.1 | 100.4 | |
| 5.8 | 211.4 | 187.1 | |
| 8.0 | 607.4 | 559.0 | |
| 24 | 3631.6 | ||
| 70 | 30000 |
| Wavelength | All-Sky Release | Color-CorrectedaaColor corrections from the WISE Explanatory Supplement, assuming a blackbody at 240 K. |
|---|---|---|
| Flux Density | Flux Density | |
| (m) | (Jy) | (Jy) |
| 3.4 | 53 | |
| 4.6 | 84 | |
| 12 | 1543 | |
| 22 | 3595 |