Observations of The High Mass X-ray Binary A 0535+26 in Quiescence
Abstract
We have analyzed 3 observations of the High Mass X-ray Binary A 0535+26 performed by the Rossi X-ray Timing Explorer (RXTE) 3, 5, and 6 months after the last outburst in 2011 February. We detect pulsations only in the second observation. The 3–20 keV spectra can be fit equally well with either an absorbed power law or absorbed thermal bremsstrahlung model. Re-analysis of 2 earlier RXTE observations made 4 years after the 1994 outburst, original BeppoSAX observations 2 years later, re-analysis of 4 EXOSAT observations made 2 years after the last 1984 outburst, and a recent XMM-Newton observation in 2012 reveal a stacked, quiescent flux level decreasing from 2 to ergs cm-2 s-1 over 6.5 years after outburst. Detection of pulsations during half of the quiescent observations would imply that accretion onto the magnetic poles of the neutron star continues despite the fact that the circumstellar disk may no longer be present. The accretion could come from material built-up at the corotation radius or from an isotropic stellar wind.
Subject headings:
pulsars: general – X-rays: stars – stars: individual (A 0535+26) – stars: neutron1. Introduction
A 0535+26 is a Be/X-ray binary system, discovered by Ariel V during a giant outburst in 1975 (Rosenberg et al., 1975). The binary system consists of the neutron star pulsar A0535+26 and O9.7-B0 IIIe optical companion HDE 245770 (Steele et al., 1998). The neutron star moves in an eccentric orbit with e = 0.47, an orbital period = 111.070.07 days, and exhibiting a pulse period of 103.25 s (Camero-Arranz et al., 2012, and references therein). The estimated distance to the system d = 2 kpc (Steele et al., 1998). Extensive reviews of the system are given in Giovannelli & Graziati (1992) and Caballero (2009). A 053526 belongs to a class of high mass systems, called Be/X-ray binaries, known for having outbursts where matter accretes onto the magnetic poles via an accretion disk that is filled at periastron passage from a circumstellar decretion disk of the primary. When this stellar disk retreats, the accretion disk shrinks and the source enters quiescence. This allows the observer to study other source(s) of accretion that may be present. Campana et al. (2002) have studied high mass systems in quiescence where the neutron star spin period is relatively short ( 5 s), and they conclude that X-ray emission is due to material falling onto the magnetospheric boundary or burning on the neutron star surface. Longer period high mass systems are less well studied.


The X-ray intensity of A 0535+26 varies by almost three orders of magnitude with three basic intensity states: 1) quiescence, 2) normal, or type I, outbursts, generally associated with periastron passages, and 3) giant, or type II, outbursts that may occur at any orbital phase. The companion, HDE 245770, has an equatorial circumstellar disk whose size has varied over time. It is this material that drives the normal outbursts at periastron. The giant outbursts may arise from large asynchronous mass outflows from the companion. An indicator of the disk size is the H equivalent width, as well as that of He I and the overall visual magnitude (Grundstrom et al., 2007). The results of monitoring of these quantities are given in Figure 1 of Camero-Arranz et al. (2012) for the past 37 years. A large reduction in the H strength occurred in 1998 (MJD 51000) in conjunction with the ceasing of outbursts for 7 years. New outbursts began anew with the giant outburst of 2005 (Fig. 1 (Left)). Beginning in 2009, the H strength again declined with an apparent leveling-off at the time of the 2011 February outburst. Since then the H strength has continued to decline (Camero-Arranz pvt. comm.) and no outbursts have been detected.
Since its discovery, nine giant outbursts have been detected: in 1977 December (Giovannelli & Graziati, 1992), 1980 October (Nagase et al., 1982), 1983 June (Sembay et al., 1990), 1989 March/April (Makino et al., 1989), 1994 February (Finger, Wilson, & Hagedon, 1994), 2005 May/June (Tueller et al., 2005), 2009 December (Wilson-Hodge et al., 2009), 2010 October (Mihara et al., 2010), and 2011 February (Camero-Arranz et al., 2012). Normal outbursts are seen at periastron passages (see Figure 4 in Motch et al., 1991), but may not occur for years at a time. After the 1998 normal outburst, the source went into the quiescent state until resuming in 2005 (Fig. 1 (Left)). The last outburst was the giant one in 2011 February. Since then, A052526 has exhibited no outbursts at all (Fig. 1 (Right)).

In quiescence, the system is expected to be in the centrifugally inhibited regime (Illarionov & Sunyaev, 1975), preventing the continual accretion of matter onto the neutron star. Nevertheless, all historic observation campaigns during quiescence have found pulsations in at least part of their data, indicating that matter is still being accreted along the magnetic field lines. Observations of the quiescent state have been performed by EXOSAT, RXTE, BeppoSAX, and XMM-Newton. The source was observed four times by EXOSAT between 1985 and 1986 and pulsations were detected during two of the observations (Motch et al., 1991). RXTE performed two observations in quiescence between 1998 August and 1998 November (Negueruela et al., 2000), and pulsations were detected during the 1998 November observation, while in August only a weak indication () was found for periodicity at the nominal pulse period. BeppoSAX observed the source during quiescence in 2000 September-October and 2001 March (Orlandini et al., 2004). Mukherjee & Paul (2005) divided the BeppoSAX data into 5 ever-decreasing count-rate bins, and significantly detected pulsations in all but the faintest.
We report here on three RXTE observations made in 2011 after the giant outburst of 2011 February, and pulsations were only detected in the second of the new observations. Combining these three observations with the previous observations and a new XMM-Newton observation made a year after the last outburst (Doroshenko pvt. comm.), we present a detailed study of A053526 in quiescence, where accretion onto the magnetic poles continues, possibly from matter accumulated at the magnetospheric radius or a stellar wind. Section 2 describes the data reduction and analysis, while Section 3 discusses the results and gives the conclusions of this investigation.
2. Data Reduction and Analysis
| Date | ObsID | Ratea,ba,bfootnotemark: | LvtccThe livetime in seconds | PhaseddBased upon =111.1 days, MJD(Periastron)=53613.0 |
|---|---|---|---|---|
| 2011 May 15 | 96421-01-02-00 | 3.90.1 | 2,432 | 0.749 |
| 2011 July 28 | 96421-01-03-00 | 2.30.1 | 2,944 | 0.415 |
| 2011 August 22 | 96421-01-04-00 | 1.40.1 | 2,672 | 0.640 |
RXTE observed A 053526 in quiescence on three occasions in 2011 in order to study its spectral and temporal behavior (Table 1). The data reduction was carried out using HEASOFT version 6.11 software, and XSPEC version 12.7.0 (Arnaud, 1996). The data were extracted observing the standard UCSD/IAAT/ECAP filtering criteria of pointing within 0.01 degrees of the target, elevation above the Earth’s horizon greater than 10∘, time since the center of the last South Atlantic Anomaly passage of 30 minutes, and an electron rate of less than 0.1.
| Date | Satellite | MJD | TaaPCU2 3–90 keV background subtracted counting rate in counts/s | PhasebbUncertainties in rates are 68% confidence | Pulses? |
|---|---|---|---|---|---|
| 2011 May 15 | RXTE | 55696 | 77 | 0.749 | No |
| 2011 July 28 | RXTE | 55770 | 155 | 0.415 | Yes |
| 2011 Aug 22 | RXTE | 55795 | 180 | 0.640 | No |
| 2012 Feb 28 | XMM | 55985 | 370 | 0.350 | Yes |
| 1985 Sept 23 | EXOSAT | 46331 | 600 | 0.545 | Yes |
| 1986 Feb 10 | EXOSAT | 46471 | 740 | 0.284 | No |
| 1986 Feb 18 | EXOSAT | 46479 | 748 | 0.212 | Yes |
| 1986 Mar 9 | EXOSAT | 46498 | 767 | 0.041 | No |
| 1998 Aug 21 | RXTE | 51046 | 1455 | 0.105 | Yes |
| 1998 Nov 12 | RXTE | 51129 | 1538 | 0.358 | Yes |
| 2000 Sept 4-5 | BeppoSAX | 51791 | 2200 | 0.400 | No |
| 2000 Oct 5-6 | BeppoSAX | 51822 | 2231 | 0.121 | No |
| 2001 Mar 6-7 | BeppoSAX | 51974 | 2383 | 0.753 | Yes |
We have also re-analyzed the 1998 RXTE observations of A 053526 reported by Negueruela et al. (2000) and the 1985–1986 EXOSAT observations of Motch et al. (1991) using updated response and background files111Our re-analysis appears to show that Motch et al. (1991) have a typographical error in their Table 2 — the 1–10 keV flux should be 10-11 ergs cm-2 s-1.. The re-analysis of the EXOSAT spectra for A 053526 was performed by downloading the spectral and response files for the EXOSAT ME detector from the HEASARC for the 4 observations. The XMM-Newton results will be the subject of a separate publication, and only the 2–10 keV flux is presented here. The BeppoSAX results are from the publications of Orlandini et al. (2004) and Mukherjee & Paul (2005). In addition, we have used the abundances of Wilms, Allen & McCray (2000) and cross sections of Verner et al. (1996). Table 2 summarizes the 13 observations made in quiescence since 1984 in order of their time since the last outburst preceding them.
2.1. Timing
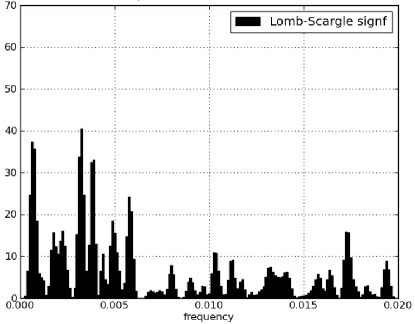
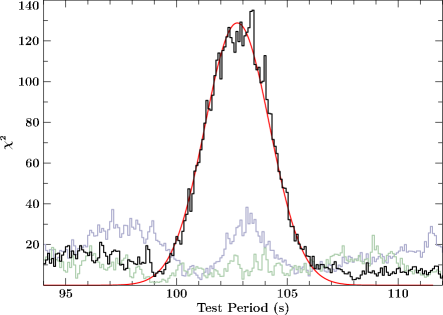
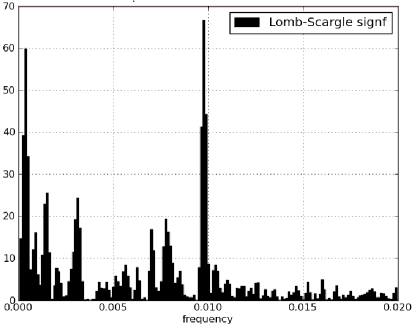
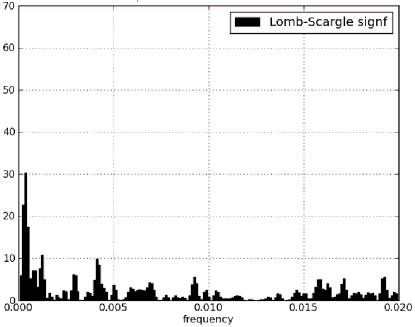
To perform a period search, Proportional Counter Unit 2 (PCU2; Jahoda et al., 2006) lightcurves from the observations in 2011 July (ObsId 96421-01-03-00) and 2011 August (ObsId 96421-01-04-00) were extracted in data mode B_250ms_128M and the lightcurve from the observation in 2011 May (ObsId 96421-01-02-00) in GoodXenon mode. Due to the low luminosity of the source, no significant flux was detected above 20 keV, and therefore only data from pulse height channels 5 to 49, corresponding to energies between 3 and 20 keV, were used in the timing analysis (See Table 1 for the comparative counting rates). For each observation the data were collected into consecutive 2 s time bins. With uniformly sampled and uninterrupted data, the Lomb-Scargle algorithm was applied over the frequency range of 0 to 0.020 Hz (periods greater than 50 s) in 160 frequency steps (approximately 1 s steps in period). The resulting Lomb-Scargle significance is plotted versus frequency for the three data sets in Fig 2 (Left column). The probability of a frequency component occurring in pure Gaussian noise is Pr(occ) (0.01)s/4.6, where is the significance. Thus a significance of 66.7, for the middle observation at 0.0097 Hz, implies a very significant detection. The interpretation of the actual significance is limited by systematic effects, such as aliasing and non-Gaussian variations. The peak of the Lomb-Scargle plot for the middle observation was at 102.36 s. Note that the Lomb-Scargle analysis assumes sinusoidal variations and Gaussian noise, while the pulse profile of A 053526 is somewhat sinusoidal (Fig. 2 (Lower-Right)) and the statistics are Poisson. Epoch folding for periods near the Lomb-Scargle peak value was used to further define the pulse period. The first and last observations produce very little Lomb-Scargle significance near 0.0097 Hz (103 s), and we conclude that pulsing was not detected for those observations. Epoch folding for those data was performed to validate the Lomb-Scargle analysis.
An iterative epoch folding method was utilized whereby pulse-to-pulse changes in luminosity were taken into account by averaging the count rate over the pulse period and subtracting the resulting pulse averaged lightcurve from the original one. This increases the strength of a signal in the epoch folding -distribution (Larsson, 1996). Periodic signals were searched between 94 and 112 s, with 200 test periods in between and 8 phase bins. The resulting distribution for the 2011 July observation is shown in Figure 2 (Top-Right), and the corresponding 16 bin folded light curve for a peak period of 103.48(28)s is given on the Middle-Right. If one compares the second observation profile to those seen in outburst (e.g. Caballero et al., 2007), this 3–20 keV profile resembles the higher energy (15 keV) ones in outburst with the broader minimum, as compared to lower energy ones with a narrow feature defining flux minimum. It also resembles many of the previous quiescent 2–10 keV profiles. The uncertainty in the epoch fold period for the 2011 July data is at the -confidence limit and was determined by Monte Carlo simulations. The 2011 July pulse period is consistent with the detected pulse period of 103.25 s (Camero-Arranz et al., 2012) during the last outburst in February 2011, and considering that the pulse period changes relatively little during non-outburst times. It is surprising that the pulsations were only detected in the 2011 July observation, which has an intermediate flux of the three observations. Even if the lack of a detection of pulsations in the last of the three observations could be attributed to insufficient statistics, the non-detection in the brightest observation remains a puzzle. With exposure roughly equivalent to the 2011 July observation and higher counting rate, one would expect it to have been more sensitive to pulsations. The energy spectra of all 3 observations are quite similar (Fig. 3), so the presence or lack of pulsations does not appear attributable to some kind of state change.
2.2. Spectra
The spectra for each RXTE observation were generated from the PCU2 Standard2 Data files, which represent the full (2–90 keV) energy range in 129 variable width spectral bins. These histograms are independent of the individualized data modes for a given observation. The PCU2 Faint background estimate, provided by the PCA team and based upon detector rates acquired while observing blank fields during the mission, was used in fitting of background subtracted data. The normalization of the background histogram depends upon the dead time estimate, which is also based upon average detector counting rates. The XSPEC recorn function was initially used to correct for the small difference between the estimated and actual PCU2 background normalization, which cannot be measured directly due to the Proportional Counter Array detectors being non-imaging. Consequently the background must be modeled. Comparison of results with and without the recorn function in the model showed that these data were insensitive to this background optimization, and thus results are given for fits without the recorn function included in the modeling. The two spectral models fitted to the three observations in the 3–20 keV range were an absorbed power law (cflux*(tbabs*pegpwrlw)) and absorbed thermal bremsstrahlung (cflux*(tbabs*bremss)), both modified by a maximum in Galactic line of sight absorption (fixed at 4.5 cm-2, Kalberla et al., 2005). cflux was the basis for the measurement of 2–10 keV flux plus 90% errors. The simple power law was used since the statistics did not warrant the use of a more complex model with a high energy cutoff, as utilized for fitting outburst spectra. Both models gave acceptable and similar fits (Fig. 3, Tables 3 and 4). The errors reported in the two Tables are 90% uncertainties. The power law and thermal bremsstrahlung best-fit values for absorption at the source differ by about a factor of two, with the power law one averaging about 91022 cm-2 and bremsstrahlung one averaging a bit less than 41022 cm-2. This is due to the curvature of the bremsstrahlung spectrum with respect to that of a power law at low energies. Above 10 keV, the bremsstrahlung spectrum rolls over with respect to the power law, but poor statistics at these energies preclude the determination of which model provides the better representation of the incident spectrum.
The 1998 RXTE spectral data for A 053526 were extracted with the same acceptance criteria as the 2011 RXTE data, and re-analyzed with updated response and background files. For the present RXTE re-analysis, only data from PCU2 were used for consistency with the later RXTE results. Only 2 upper limits to the column density were found, and the best-fit values of the power law indices were less than but consistent with those found by Negueruela et al. (2000). When applying the bremsstrahlung model, the column density upper limits were again lower than those for the power law fits, and the electron temperatures were somewhat higher, but again consistent with the values found by Negueruela et al. (2000). Tables 3 and 4 give the best-fit values from the re-analysis. While Motch et al. (1991) reported average EXOSAT values for the best-fit parameters for both power law and thermal bremsstrahlung models, we report the individual observation values here (Tables 3 and 4). We found an average power law index of 2.27 and an average electron temperature of 7.5 keV. No simultaneous fitting between different instruments was performed due to the variations in column density, flux, and power law index. Consequently the relative normalizations between the instruments are assumed to be unity.


| Date | aaDays since the peak of the previous outburst; 2011 February 23, 1994, August 27, or 1984 February 1 | Photon Index | FluxbbBased upon =111.1 days, MJD(Periastron)=53613.0 | ccChi-square per degree of freedom for 39 degrees of freedom for RXTE and 52 degrees of freedom for EXOSAT |
|---|---|---|---|---|
| 2011 May 15 | 9.1 | 2.40 | 4.01 | 0.67 |
| 2011 July 28 | 9.1 | 2.59 | 2.37 | 0.75 |
| 2012 Aug 22 | 5.0 | 2.44 | 1.55 | 0.42 |
| 1998 Aug 21ddRe-analysis of Negueruela et al. (2000) RXTE observations | 11.5 | 2.30 | 0.79 | 0.50 |
| 1998 Nov 12ddRe-analysis of Negueruela et al. (2000) RXTE observations | 13.7 | 2.40 | 0.96 | 0.46 |
| 1985 Sept 23eeRe-analysis of Motch et al. (1991) EXOSAT observations | 2.4 | 1.83 | 2.46 | 1.33 |
| 1986 Feb 10eeRe-analysis of Motch et al. (1991) EXOSAT observations | 4.0 | 2.42 | 1.18 | 0.96 |
| 1986 Feb 18eeRe-analysis of Motch et al. (1991) EXOSAT observations | 2.5 | 1.98 | 1.44 | 0.81 |
| 1986 Mar 9eeRe-analysis of Motch et al. (1991) EXOSAT observations | 6.7 | 2.85 | 1.56 | 0.89 |
| Date | aaColumn density in units of 1022 cm-2 | bbAbsorbed 2–10 keV power law flux in units of 10-11 ergs cm-2 s-1 | FluxccAbsorbed 2–10 keV flux ergs cm-2 s-1 | ddChi-square per degree of freedom for 40 degrees of freedom for RXTE and 52 degrees of freedom for EXOSAT |
|---|---|---|---|---|
| 2011 May 15 | 3.7 | 8.22 | 4.22 | 0.60 |
| 2011 July 28 | 3.7 | 6.59 | 2.48 | 0.65 |
| 2012 Aug 22 | 5.4 | 7.44 | 1.62 | 0.41 |
| 1998 Aug 21eeRe-analysis of Negueruela et al. (2000) observations | 7.0 | 9.06 | 0.80 | 0.48 |
| 1998 Nov 12eeRe-analysis of Negueruela et al. (2000) observations | 8.1 | 7.17 | 1.00 | 0.42 |
| 1985 Sept 23ffRe-analysis of Motch et al. (1991) observations | 1.6 | 11.14 | 2.42 | 1.25 |
| 1986 Feb 10ffRe-analysis of Motch et al. (1991) observations | 2.4 | 4.66 | 1.11 | 0.93 |
| 1986 Feb 18ffRe-analysis of Motch et al. (1991) observations | 1.6 | 8.42 | 1.40 | 0.81 |
| 1986 Mar 9ffRe-analysis of Motch et al. (1991) observations | 4.1 | 3.84 | 1.51 | 0.90 |
2.3. Correlations and Trends
The present 2011 RXTE observations that occurred 3, 5, and 6 months after the last outburst (2011 Feb 23) show a clear steeply dropping flux (Fig. 4). However, when the XMM-Newton value from 12 months after the outburst is added, the interpretation is less clear, and a flux level of 2 ergs cm-2 s-1 6–12 months after the outburst is indicated. The addition of the earlier RXTE, BeppoSAX and EXOSAT observations performed 2–6 years into quiescence sample the declining flux from 0.25 to 6 years after an outburst (Fig. 4 (Left)), albeit not the same outbursts and not all either normal or giant outbursts. The dashed line in Fig. 4 (Left) is a least squares fit to all but the first RXTE point, and reflects a Pearson correlation coefficient of 0.785 (a null hypothesis probability of 0.012). If taken at face value, the quiescent flux values indicate a slowly declining quiescent level with a slope of 3.8 ergs cm-2 s-1 per day after these 3 outbursts. The 2011–2012 RXTE data show a slightly raised flux in the first observation, as do the EXOSAT data. This may be indicative of small levels of flaring during quiescence, which would be yet another indication of continuing, variable accretion. It may also be an effect of orbital phase in an isotropic stellar wind.
As the observed intensity decreased linearly as a function of time since outburst, the column density decreased exponentially (Fig. 4 (Right)). The Pearson correlation coefficient for the log of versus time since outburst is 0.897 (a null hypothesis probability of 0.001). This naturally results in column density increasing with the 2–10 keV power law flux (Fig. 5 (Right)), and in this case the Pearson correlation coefficient is 0.772 (a null hypothesis probability of 0.015). Finally, the power law index does not appear to correlate with the power law flux (Fig. 5 (Left)).


3. Discussion and Conclusions
A 053526 continues to show pulsations, as seen in most but not all of the observations. The fact that the first and brightest of the 3 new RXTE observations in quiescence did not exhibit detectable pulsations, while the second, 50% weaker observation did with a similar live time, is strong evidence that the pulsations are not always present in quiescence. This would indicate in general that accretion onto the polar caps was still occurring, but that the accretion may not always be channeled to the magnetic poles. In quiescence the neutron star in A 053526 is expected to be centrifugally inhibited (Campana et al., 2002), and plasma entry into the magnetosphere may be mediated by various instabilities affecting the extent of the emission region (Arons & Lea, 1976).
Okazaki & Negueruela (2001) have modeled the outbursts from Be/X-ray binaries using a viscous decretion model, where the presence of outbursts depends upon the neutron star orbit with respect to various resonances of the gas in the system. If the neutron star’s orbit is outside a given resonance, matter from that resonance will not flow onto the neutron star, whereas if it is within a given resonance, the matter will flow. Okazaki & Negueruela (2001) state for A 053526 that the disk is truncated at the 4:1 resonance when outbursts are detected, and that a slight decrease in viscosity or disk temperature would lower the disk radius to the 5:1 resonance and thus have the system go into dormancy. The observation that the quiescent luminosity is declining in the composite light curve (Fig. 4) could imply that an accumulated mass at the corotation radius (Haigh et al., 2004) is being depleted over time. Then quiescence in A 053526 would be characterized by reduced accretion from the magnetospheric boundary, while the bright outbursts would be characterized by high levels of accretion from the companion’s circumstellar disk.
Another possibility is that the companion may have a stellar wind in addition to that from the circumstellar disk. This would mean that the system could transition from disk accretion to stellar wind accretion. If the disk were to recede, as the H observations imply in 1998 and 2011–2012 (Figure 1 of Camero-Arranz et al. (2012) and V. McBride, pvt. comm.), one might expect the system to transition to spherical wind accretion dominating over that of the disk. If there is a sufficient stellar wind to provide wind accretion as in GX 301-2 (e.g. Suchy et al., 2012), then the generation of X-rays and pulsing seen in quiescence might be explained. The very small number of quiescent data points after each outburst as a function of orbital phase precludes any test of variations with orbital phase, which might have been evidence of stellar wind accretion.
de Loore et al. (1984) adopt a wind mass loss rate for HDE 245770 of 10-8 M⊙ yr-1 from measurements of UV resonance lines and infrared fluxes. Spherical Bondi accretion for a 1.4 M⊙ neutron star at a distance of 267 light-seconds ( for the A 053526 system) and a 2000 km s-1 wind velocity at infinity (e.g., Table 1 in Kudritzki & Puls, 2000) would predict the mass accretion rate onto the neutron star to be of the wind mass loss rate. If the bolometric quiescent X-ray luminosity is about twice the 2-10 keV luminosity, or 2.5 ergs s-1 for a distance of 2 kpc, then one would predict a wind mass loss rate of 10-9 M⊙ yr-1, if the conversion efficiency of gravitational to X-ray energy is 0.1. This estimate is 10% of the de Loore et al. (1984) value, which may be reasonable if 90% of the wind mass loss is due to the circumstellar disk. Waters et al. (1988) predict a factor of 104 for the difference in X-ray luminosities between polar and equatorial mass flows for HDE 245770 (1031 ergs s-1 vs 1035 ergs s-1). If the orbit of the neutron star is inclined to the equator of the companion, and if the mass flow changes with angle from the pole, the neutron star may sample a mass flow that produces fluxes in the 1034 ergs s-1 range.
Should we see orbital variations of the flux due to the eccentric orbit in the RXTE data that was taken within one orbital period? A 2000 km s-1 wind would predict at most a factor of 3 variation in flux between the 3 RXTE phases. The RXTE fluxes are in agreement with this limited variation.
The spectra of A 053526 (Tables 3 and 4 plus the results from BeppoSAX; Orlandini et al., 2004; Mukherjee & Paul, 2005) indicate a decreasing amount of absorption at the source as time since an outburst increases (Fig. 4 (Right)). When comparing the various values of versus orbital phase (given in Table 2) it is clear that this material is present in the line of sight independent of orbital phase. Thus, it must be either all pervasive in the system (the wind?) or very close to the neutron star (a declining accumulation of matter at the corotation radius?). For the former, variations in might imply a variable stellar wind density, which in turn would result in a correlated variable X-ray flux (Fig. 5 (Right)). For the latter, the disk might thin as the material is drained from it. This could be further evidence for a continual draining of the material trapped near the corotation radius (D’Angelo & Spruit, 2012).
The power law index is independent of flux over the flux range of 1–4 ergs cm-2 s-1 (Fig. 5). In addition, the power law indices measured for all of the quiescent observations are significantly steeper ( 2.5 versus 1) than those seen during outbursts (e.g. Caballero et al., 2007). A steeper power law would imply less Compton up-scattering of lower energy photons due to either a thinning of the hot electon scattering plasma, or a cooling of the electron distribution. This may be further indication that the accretion mode is different between outburst and quiescence.
The pulse profile exhibited by the 2011 July 28 RXTE data is single peaked and somewhat sinusoidal, as has been seen in the past for observations made at quiescent luminosities, as noted above. CGRO/BATSE observations hint at a change in the pulse profile to the single peak variety that occurs below 1037 ergs cm-2 s-1 (Bildsten et al., 1997). This change from the double peaked structure of the outburst pulse profiles possibly indicates a change in the accretion regime. For low luminosities the beam pattern is expected to be more pencil beam-like, and more like a fan beam at higher luminosities (Becker et al., 2012, and references therein).
3.1. Conclusions
RXTE observations of A 053526 months after a giant outburst were combined with three other sets of multiple observations of A0535 26 from other X-ray observatories after other outbursts to reveal that they all had a similar (within a factor of 2), or slowly decreasing flux level. At least half of the observations detected pulsations, indicating that accretion onto the magnetic poles was still occurring, but perhaps intermittently. Optical observations of H emission at the times of the measurements indicated that the 1998 and 2011 data were taken during times of a highly diminished Be star disk, allowing for the possibility of sources of accreted material other than that responsible for the outbursts. When combining all 13 observations as a function of time since the last outburst (albeit not the same outbursts), the quiescent flux appears to drop by a factor of 2 over 6.5 years, or ergs cm-2 s-1 with small () flares or possible orbital variations present. Based upon very limited statistics, the line-of-sight column density decreases by a factor of a few over the combined 6.5 years of quiescence, while the power law remained relatively constant. The quiescent flux and subsequent, correlated line of sight column depth could be due to a draining of material built-up at the corotation radius or due to spherical accretion from an isotropic, but diminishing, component of the stellar wind. Further characterization of the quiescent mode of A 053526 will require more observations over a range of times since the last outburst in order to see if the slow downward trend in the flux continues, and to see if one could detect the orbital variations in flux expected for wind accretion in the eccentric orbit.
References
- Arnaud (1996) Arnaud, K. A. 1996, in ASP Conf. Ser. 101, Astronomical Data Analysis Software and Systems, ed. G. Jacoby & J. Barnes (San Francisco, CA: ASP), 17
- Arons & Lea (1976) Arons, J. & Lea, S.M. 1976, ApJ, 210, 792
- Becker et al. (2012) Becker, P.A., Klochkov, D., Schönherr, G., et al. 2012, A&A, 544, 123
- Bildsten et al. (1997) Bildsten L., Chakrabarty, D., Chiu, J., et al. 1997, ApJS, 113, 367
- Caballero et al. (2007) Caballero, I., Kretchmar, P., Santangelo, A., et al. 2007, A&A, 465, 26
- Caballero (2009) Caballero, I. 2009, Ph. D. Thesis, Eberhard Karls Universität Tübingen
- Camero-Arranz et al. (2012) Camero-Arranz, A., Finger, M.H., Wilson-Hodge, et al. 2012, ApJ, 754:20.
- Campana et al. (2002) Campana, S., Stella, L., Israel, G.L., et al. 2002, ApJ, 580, 389
- D’Angelo & Spruit (2012) D’Angelo, C.R. & Spruit, H.C. 2012, MNRAS, 420, 416
- Finger, Wilson, & Hagedon (1994) Finger, M. H., Wilson, R. B., & Hagedon, K. S., 1994, IAU Circ., 5931
- Giovannelli & Graziati (1992) Giovannelli, F., & Graziati, L. S., 1992, Space Science Reviews, 59, 1
- Grundstrom et al. (2007) Grundstrom, E.D., Boyajian, T.S., Finch, C., et al. 2007, ApJ, 660, 1398.
- Haigh et al. (2004) Haight, N.J., Coe, M.J., & Fabregat, J. 2004, MNRAS, 350, 1457
- Illarionov & Sunyaev (1975) Illarionov, A. F., & Sunyaev, R. A., 1975, A&A, 39, 185
- Jahoda et al. (2006) Jahoda, K., Markwardt, C.B., Radeva, Y., et al. 2006, ApJS, 163, 401
- Kalberla et al. (2005) Kalberla, P.M.W., Burton, W.B., Hartmann, Dap, Arnal, , et al. 2005, A&A, 440, 775
- Kudritzki & Puls (2000) Kudritzki, R.-P. & Puls, J. 2000, ARA&A, 38, 613
- Larsson (1996) Larsson, S. 1996, A&AS, 117, 197
- de Loore et al. (1984) de Loore, C., Giovannelli, F., van Dessel, E.L., et al. 1984, A&A, 141, 279
- Makino et al. (1989) Makino, F., Cook, W., Grunsfeld, J., et al., 1989, IAU Circ., 4769
- Mihara et al. (2010) Mihara, T., Nakajima, M., Yamamoto, T., et al. 2010, ATel 2970
- Motch et al. (1991) Motch, C., Stella, L., Janot-Pacheco, E., & Mouchet, M., 1991, ApJ, 369, 490
- Mukherjee & Paul (2005) Mukherjee, U., & Paul, B., 2005, A&A, 431, 667
- Nagase et al. (1982) Nagase, F., Hayakawa, S., Kunieda, H., et al., 1982, ApJ, 263, 814
- Negueruela et al. (2000) Negueruela, I., Reig, P., Finger, M. H., & Roche, P., 2000, A&A, 356, 1003
- Orlandini et al. (2004) Orlandini, M., Bartolini, C., Campana, S., et al., 2004, Nuclear Physics B Proceedings Supplements, 132, 476
- Okazaki & Negueruela (2001) Okazaki, A.T. & Negueruela, I. 2001, A&A, 377, 161
- Rosenberg et al. (1975) Rosenberg, F. D., Eyles, C. J., Skinner, G. K., & Willmore, A. P., 1975, Nature, 256, 628
- Sembay et al. (1990) Sembay, S., Schwartz, R. A., Orwig, L. E., Dennis, B. R., & Davies, S. R., 1990, ApJ, 351, 675
- Steele et al. (1998) Steele, I. A., Negueruela, I., Coe, M. J., & Roche, P., 1998, MNRAS, 297, L5
- Suchy et al. (2012) Suchy, S., Fürst, F., Pottschmidt, K., et al. 2012, ApJ, 745, 124
- Tueller et al. (2005) Tueller, J., Ajello, M., Barthelmy, S., Krimm, H., Markwardt, C., & Skinner, G., 2005, ATel, 504
- Verner et al. (1996) Verner, E.M., Ferland, G.J., Korista, K.T., & Yakovlev, D.G. 1996, ApJ, 465, 487
- Waters et al. (1988) Waters, L.B.F.M., Taylor, A.R., van den Heuvel, E.P.J., Habets, G.M.H.J., & Persi,P. 1988, A&A, 198, 200
- Wilms, Allen & McCray (2000) Wilms, J., Allen, A., & McCray, R., 2000, ApJ, 542, 914
- Wilson-Hodge et al. (2009) Wilson-Hodge, C., Finger, M.H., Camero-Arranz, A., & Connaughton, V. 2009, ATel 2324