11email: acaratti;rgarcia;weigelt@mpifr-bonn.mpg.de
22institutetext: Pulkovo Astronomical Observatory of the Russian Academy of Sciences, Pulkovskoe shosse 65, 196140 St. Petersburg, Russia
22email: lvtamb@mail.ru; grinin@gao.spb.ru
33institutetext: The V.V. Sobolev Astronomical Institute of the St. Petersburg University, Petrodvorets, 198904 St. Petersburg, Russia
44institutetext: School of Physics and Astronomy, EC Stoner Building, University of Leeds, Leeds, LS2 9JT, UK
44email: pyjdi@leeds.ac.uk
55institutetext: School of Physics and Astronomy, University of St Andrews, North Haugh, St Andrews, KY16 9SS, UK email: jdi3@st-andrews.ac.uk
LBT/LUCIFER NIR spectroscopy of PV Cephei.
Abstract
Context. Young stellar objects (YSOs) occasionally experience enhanced accretion events, the nature of which is still poorly understood. The discovery of various embedded outbursting YSOs has recently questioned the classical definition of EXors and FUors.
Aims. We present a detailed spectroscopic investigation of the young eruptive star PV Cep, to improve our understanding of its nature and characterise its circumstellar environment after its last outburst in 2004.
Methods. The analysis of our medium-resolution spectroscopy in the near-IR (0.9–2.35 m), collected in 2012 at the Large Binocular Telescope with the IR spectrograph LUCIFER, allows us to infer the main stellar parameters (visual extinction, accretion luminosity, mass accretion and ejection rates), and model the inner disc, jet, and wind.
Results. The NIR spectrum displays several strong emission lines associated with accretion/ejection activity and circumstellar environment. Our analysis shows that the brightness of PV Cep is fading, as well as the mass accretion rate (210-7 M☉ yr-1 in 2012 vs 510-6 M☉ yr-1 in 2004), which is more than one order of magnitude lower than in the outburst phase.
Among the several emission lines, only the [Fe ii] intensity increased after the outburst. The observed [Fe ii] emission delineates blue- and red-shifted lobes, both with high- and low-velocity components, which trace an asymmetric jet and wind, respectively. The observed emission in the jet has a dynamical age of 7–8 years, indicating that it was produced during the last outburst. The visual extinction decreases moving from the red-shifted (=10.10.7 mag) to the blue-shifted lobe (=6.50.4 mag). We measure an average electron temperature of 17 500 K and electron densities of 30 000 cm-3 and 15 000 cm-3 for the blue and the red lobe, respectively. The mass ejection rate in both lobes is 1.510-7 M☉ yr-1, approximately matching the high accretion rate observed during and immediately after the outburst (/0.05–0.1). The observed jet/outflow asymmetries are consistent with an inhomogeneous medium.
Our modelling of the CO emission hints at a small-scale gaseous disc ring, extending from 0.2-0.4 AU to 3 AU from the source, with an inner temperature of 3000 K. Our H i lines modelling indicates that most of the observed emission comes from an expanding disc wind at =10 000 K. The line profiles are strongly affected by scattering, disc screening, and outflow self-absorption.
Conclusions. According to the classical definition, PV Cep is not an EXor object, because it is more massive and younger than typical EXors. Nevertheless, its spectrum shows the signature of an ‘EXor-like’ outburst, suggesting a common origin.
Key Words.:
stars: formation – stars:circumstellar matter – stars: pre-main sequence – ISM:individual objects: PVCep – Infrared: ISM1 Introduction
Young stellar objects (YSOs) are characterised by accretion and ejection processes, which are closely related to and accompany the whole star-formation period from the protostellar to the pre-main sequence phase, with highly variable strength and duration.
In addition to continuous accretion, YSOs may occasionally experience enhanced accretion events, which produce episodic increments of their optical and infrared brightness. These objects are called young eruptive stars, usually divided into FUors (named after FU Orionis, the prototype) and EXors (from EX Lupi). FUors exhibit a large brightening up to 5–6 mag in the optical lasting from few years to decades (Hartmann & Kenyon 1996), whereas EXors (Herbig 1989) display smaller bursts (1–3 mag) with shorter duration (from days to months), and higher frequency (every few years). The two subclasses also differ from each other in the observed spectral features in the optical/NIR regime. Namely, EXors have emission-line spectra, similar to those from Classical TTauri stars (see e. g., Herbig 2007), whereas FUors show absorption-line spectra, which render distinct spectral types (SpTs) as a function of the wavelength (i. e. F or G SpTs can be inferred in the optical, M SpT in the NIR; see e. g., Hartmann & Kenyon 1996). Moreover, EXors and FUors have been historically classified as low-mass, pre-main sequence objects. However, the discovery of various embedded outbursting YSOs, especially in the NIR (e. g., OO Ser, V1647 Ori, HBC 722, V2492 Cyg, V2775 Ori; see e. g. Hodapp et al. 1996; Fedele et al. 2007; Kóspál et al. 2011a; Covey et al. 2011; Caratti o Garatti et al. 2011), suggests that these processes may take place in YSOs within a wide range of masses and ages and that there might not be a neat separation between the two sub-groups.
These outburst events are likely produced by disc instabilities, and YSOs may accrete a significant ammount of their mass during such episodes (see, e. g., Evans et al. 2009; Vorobyov 2009). In addition, enhanced accretion increases the outflow activity (Cabrit et al. 1990; Brittain et al. 2007). The material ejected by such outbursts might produce bright knots along the jet by triggering MHD instabilities in the flow (see e. g., Fendt 2009). Like the majority of YSOs, also many young eruptive stars drive outflows, HH or jets. For example, V2492 Cyg and V346 Nor are known to drive Herbig-Haro objects (HH 569 and HH 57, respectively; see Bally & Reipurth 2003; Reipurth & Wamsteker 1983). On the other hand, OO Ser is associated with outflow activity and shock-excited H2 emission (Hodapp et al. 2012), whereas Parsamian 21 shows H knots with dynamical ages of 40–80 years (Staude & Neckel 1992; Kóspál et al. 2008). However, it is difficult to associate specific eruptive/outburst events with knots or augmented ejection along the flows. To the best of our knowledge, Z CMa is the only case where ejected knots along the flow could be associated with observed outbursts (Whelan et al. 2010). Thus, the study of such phenomena is of extreme interest, providing us with information about the accretion/ejection mechanism as a whole.
Among the outbursting sources, PV Cephei is a unique object. It is a pre-main sequence young eruptive star, strongly variable, located in between the L 1155 and L 1158 clouds. Its distance is debated, between 325 pc (Straizys et al. 1992) and 500 pc (Cohen et al. 1981, the latter value is assumed throughout the paper), as well as its spectral type. Although largely recognised as an A5 (because of the H i lines observed in absorption; see e. g., Cohen et al. 1981; Thé et al. 1994; Ábrahám et al. 2000), an absorption spectrum of SpT G8–K0 has also been reported (Magakian & Movsesian 2001). The estimated mass of the central source ranges from 2.4 (Kun et al. 2011) to 4 (Hamidouche 2010) with a massive accretion disc of 0.8 (Hamidouche 2010), which drives a precessing jet with Herbig-Haro objects (HH 215, HH 315 and HH 415; Reipurth et al. 1997) and a massive asymmetric CO outflow (Arce & Goodman 2002b). Adaptive optics (AO) observations exclude the presence of a close companion (down to 50 AU; Connelley et al. 2009), which could trigger the outbursts.
PV Cep was spectroscopically and photometrically classified as EXor (Herbig 1989), after the outburst in 1977. After exhibiting a large outburst in 2004, its brightness faded by several magnitudes (up to four in the I and R bands) between 2005 and 2009 (Kun et al. 2011), with a transient peak in 2008. Its photometric decline was caused by the reduced accretion rate and the increased circumstellar extinction (Kun et al. 2011; Lorenzetti et al. 2011). Recently, Lorenzetti et al. (2011) pointed out that PV Cep is not a genuine EXor, being more massive and complex than typical solar-mass EXors.
To clarify the nature of PV Cep, we present its medium-resolution spectroscopy in the near-IR (0.9–2.35 m), collected at the Large Binocular Telescope with the infrared spectrograph LUCIFER.
This paper is organised as follows. Section 2 illustrates our observations and data reduction. In Sect. 3, we report the results with a detailed description of the detected spectral features, and, in Sect. 4, we derive the main accretion and ejection properties of the YSO and disc physical parameters from the analysis of its [Fe ii], H i, and CO features. In Section 5, we then discuss the accretion/ejection properties in PV Cep, its peculiar asymmetric jet and its circumstellar environment. Finally, our conclusions are drawn in Sect. 6.
2 Observations and data reduction
Our spectroscopic observations of PV Cep were acquired at the Large Binocular Telescope (LBT) on Mount Graham International Observatory (AZ, USA), using the infrared camera and spectrograph LUCIFER at medium resolution (Seifert et al. 2003). The N1.8 camera was used, corresponding to a spatial scale of 025/pixel. The same spectral dataset was taken on the 23rd and 24th of June 2012 (with an average seeing of 1 and 08 seeing, respectively) and covers the (0.88–1.01 m), (1.16–1.31 m), (1.54–1.74 m) and (2.01–2.35 m) spectral segments, with a total integration time (per night and per segment) of 1080, 1680, 480 and 192 s in the , , and bands. We adopted the 210_zJHK grating unit with a 05 slit width, leading to a nominal spectral resolution of 6900, 8500, 7800 and 6700 in the -, -, - and -bands, respectively. The slit was positioned on the target along the main outer outflow axis (P.A.=348). All the raw data were reduced by using the IRAF111IRAF (Image Reduction and Analysis Facility) is distributed by the National Optical Astronomy Observatories, which are operated by AURA, Inc., cooperative agreement with the National Science Foundation. package and applying standard procedures. Each observation was flat fielded, sky subtracted, and corrected for the curvature derived by long-slit spectroscopy, while atmospheric features were removed by dividing the spectra by a telluric standard star (HD 207636, A0 spectral type), normalised to the blackbody function at the stellar temperature, and corrected for its intrinsic photospheric absorption features. The raw spectra were wavelength calibrated using the bright OH lines detected on each frame (Rousselot et al. 2000), with average uncertainties of 0.2–0.4 Å, depending on the number and intensities of the OH lines detected in the considered spectral segment. The average values of the instrumental profile in the dispersion direction, measured from Gaussian fits to the OH sky lines, is 2.1, 2.2, 2.9, 4.9 Å, in the , , , and band segments, respectively. Radial velocities of the observed lines were also obtained through single or multiple Gaussian fits in case of blended lines, measured in the observer local standard of rest (LSR) and corrected for the cloud speed with respect to the LSR ( km s-1, Torrelles et al. 1986). As a result, the velocity calibration is accurate up to 10–20 km s-1, depending on the considered spectral segment. Finally, each spectral segment was flux calibrated through a spectrophotometric standard star (Hip 106737) observed using the same instrumental settings and slit widths of 05 and 15, to estimate and correct for the flux losses due to the seeing.
3 Results
First, the two spectroscopic datasets were analysed separately to check for variability. There is no clear evidence of variability in both line profiles and YSO continuum between the two nights, within the uncertainties (F/F) given by the flux calibration of our spectrophotometric standard star (about 20% in the band, and between 5% and 10% in the , , and bands) Therefore, we combined the two datasets to increase the signal to noise ratio of our spectrum. The final NIR flux-calibrated spectrum of PV Cep is presented in Figure 1 and shows a steeply rising continuum with several strong emission lines. The flux-calibrated spectrum translates into the following , , , and band magnitudes: 14.70.3, 12.300.08, 10.730.08 mag, and 8.800.04, respectively. These values are smaller than those previously observed before, during, and after the outburst in 2004 or the transient peak in 2008 (see e. g., Lorenzetti et al. 2011; Kun et al. 2011), indicating that PV Cep’s brightness is slowly fading, especially in the , , and bands (mI1.5 mag, mJ2.1 mag, mH2.6 mag, and mK2.3 mag, since 2008).

3.1 Detected lines
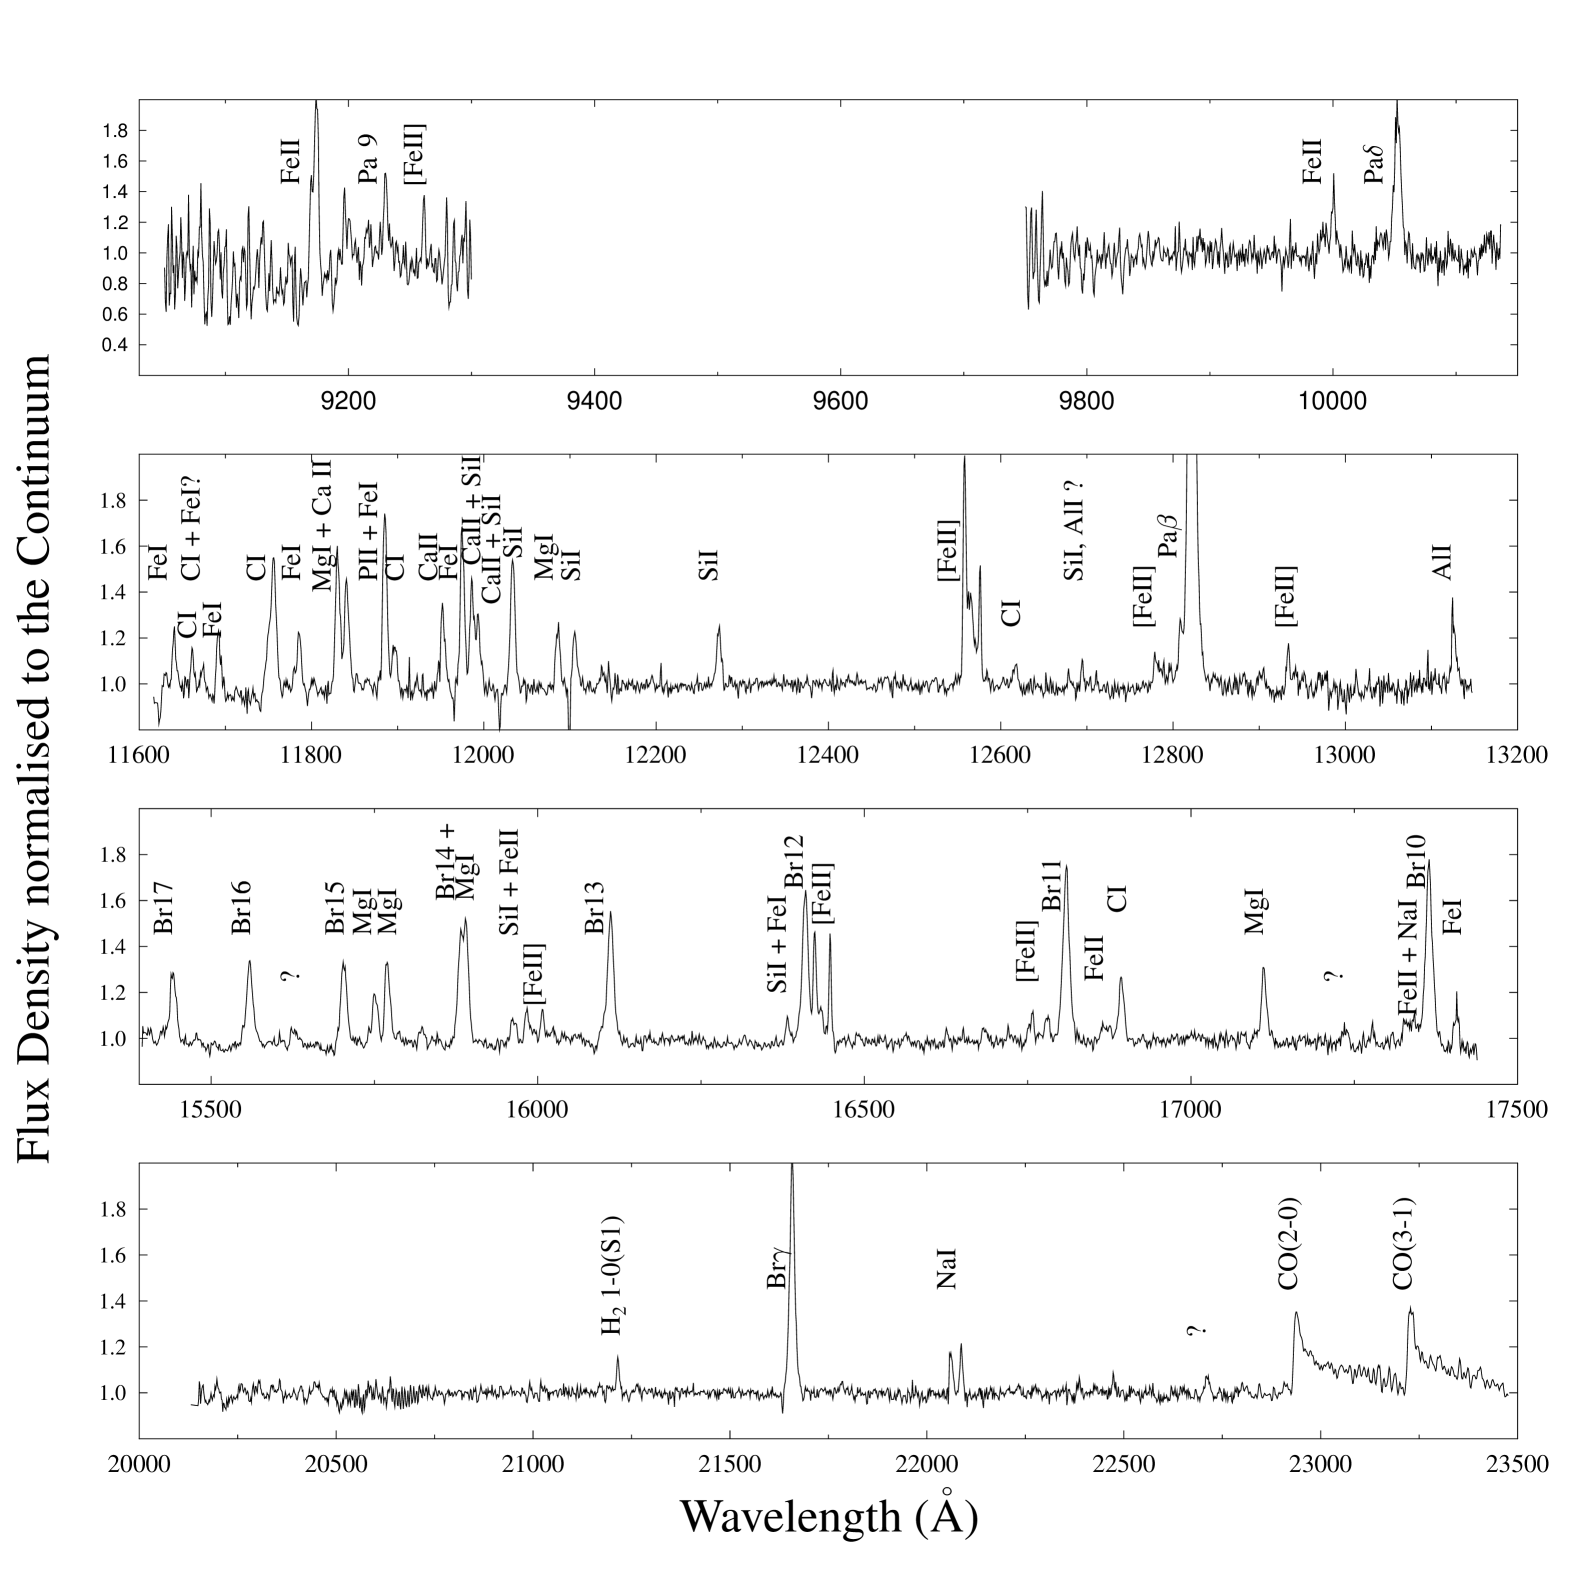
Figure 2 displays our PV Cep continuum-normalised spectrum, labelling the most prominent features. Lines were identified using wavelengths from the NIST Atomic Spectra Database Lines222http://physics.nist.gov/PhysRefData/ASD/lines_form.html. In addition, NIR spectra from several active Classical TTauri stars (CTTSs) and EXors (e. g., Kóspál et al. 2011b; Garcia Lopez et al. 2011; Caratti o Garatti et al. 2012) were also scrutinised to recognise the observed features. We detect several forbidden and permitted lines from atomic and molecular species, but no obvious absorption photospheric feature is visible on the continuum. For each detected line, Table LABEL:lines:tab (shown in Appendix) reports the observed (vacuum) wavelength (), the calibrated flux (uncorrected for the extinction) and its uncertainty (,), the equivalent width (), the full width half maximum (), the observed signal to noise ratio (S/N), the line identification (ID), its vacuum wavelength (), and the resulting radial velocity (). The equivalent widths and line fluxes were calculated by integrating across the line, after subtracting the continuum. A few lines could not be properly identified and are labelled as uncertain (ID + ‘?’) or unidentified (‘?’) in Tab. LABEL:lines:tab.
The most prominent lines in the PV Cep spectrum are circumstellar features, originating from YSO accretion or inner winds, such as, e. g., H i, Ca ii (see e. g., Muzerolle et al. 1998b; Natta et al. 2004; Caratti o Garatti et al. 2012), shocks along the jet, such as, e. g., [Fe ii] and H2 (see e. g., Nisini et al. 2002; Caratti o Garatti et al. 2006), inner disc region (e. g.,Na i, CO) (see e. g., Kóspál et al. 2011b; Lorenzetti et al. 2011), or chromospheric activity (e. g., Fe i, Fe ii, Mg i, C i) (see e. g., Hamann & Persson 1992a, b; Kelly et al. 1994).
A few fluorescent emission lines from Fe ii (i. e., at 1.0 and 1.69 m) and C i (i. e., 1.17–1.19 m) have also been detected. They are usually pumped by UV photons, likely from the Ly or continuum emission of the stellar photosphere (see e. g., Bautista et al. 2004; Johansson & Letokhov 2004; Lumsden et al. 2012; Walmsley et al. 2000).
The detected emission lines are normally observed in the NIR spectra of EXors and very active CTTSs, although the fluorescent lines are more typical of Herbig Ae/Be stars. Some of the brightest lines, namely H i, Mg i, Na i, CO bandheads, were also detected by Lorenzetti et al. (2009) during the transient peak in 2008 through NIR low-resolution (250) spectroscopy. As for the continuum, absolute line fluxes also show a significant decrease of about one order of magnitude, with the exception of the [Fe ii] emission lines, which were barely visible in the NIR low-resolution spectrum (1200) of Connelley et al. (2009), taken in July 2007, and below the detection threshold (310-14 erg s-1 cm-1) of Lorenzetti et al. (2009) spectra, taken between 2007 and 2008.
All lines are spectrally resolved, with values ranging from 100 to 250 km s-1, showing mostly broad single-peaked profiles. All Brackett line peaks are systematically blue-shifted by 20(15) km s-1, whereas of the atomic lines (blended and low S/N lines excluded) is around 0 km s-1, within a 15 km s-1 uncertainty. On the other hand, the bright Pa and Pa lines are double peaked, with strong red-shifted (at 30 km s-1) and weak blue-shifted (at 270 km s-1) peaks. The [Fe ii] lines have both high- and low-velocity components (HVC and LVC, respectively) in both red- and blue-shifted jet lobes (i. e., the bright iron lines show a peculiar four-peaked profile). Values of the [Fe ii] peak velocities, averaged over all the detected lines, are 265 and 99 km s-1 (blue-shifted HVC and LVC, respectively), and 165 and 50 km s-1 (red-shifted HVC and LVC, respectively). The [Fe ii] emissions of the HVCs are spatailly extended in our spectral images, indicating that the blue- and red-shifted lobes point northwards and southwards, respectively, as also observed in the large-scale CO outflow maps (Arce & Goodman 2002b).
4 Analysis and Physical Properties of PV Cep
4.1 Extinction toward the source and the jet
To obtain an accurate value of the visual extinction () towards PV Cep stellar photosphere and its circumstellar region, we use H i and [Fe ii] lines, respectively. The hydrogen atom in the NIR traces regions very close to the central source, whereas the iron forbidden lines delineate the inner jet from few to several hundred AUs. For each species, we employ transitions arising from the same upper level, namely Br and Pa, and [Fe ii] lines at 1.257 and 1.644 m. We assume that the emission arises from optically thin gas, thus their observed ratios depend only on the differential extinction. The theoretical values are derived from the Einstein coefficients and frequencies of the transitions. [Fe ii] transition probabilities were taken from Nussbaumer & Storey (1988). We adopt the Rieke & Lebofsky (1985) extinction law to correct for the differential extinction and compute . From the Br/Pa ratio we infer =10.80.5 mag. We then calculate the [Fe ii] 1.25/1.64 m ratio for both HV and LV components in the red- and blue-shifted lobe of the jet, obtaining =10.10.7 mag and =10.41.9 mag (HVC and LVC red), =6.30.5 mag and =7.10.9 mag (HVC and LVC blue). HV and LV extinction values are identical (within the error bar) in each lobe, thus we derive a weighted mean for the extinction of the red-shifted lobe (=10.10.7 mag), and the blue-shifted lobe (=6.50.4 mag). The difference in the extinction between the red- and blue-shifted lobes is due to the circumstellar matter (mostly caused by the disc in PV Cep), and it is usually observed in protostellar jets close to the source (see e. g., Garcia Lopez et al. 2008; Melnikov et al. 2009). Finally, we note that the towards PV Cep varies with time, due to circumstellar extinction variability, related to dust condensation in the inner disc region after the outburst and/or to the large amount of dust lifted by the jet from the disc during and after the outbursts (Kun et al. 2011). Our values are consistent with those found in literature, ranging between 9 and 14.5 mag (e. g., Lorenzetti et al. 2009; Connelley et al. 2009; Kun et al. 2011).
4.2 Stellar parameters
As already mentioned in Sect. 3.1, our spectrum does not provide any firm conclusion on the spectral type of PV Cep. However, there are several clues from our data and from the literature indicating that the central object is likely an intermediate-mass young star (2–3 ), with a relatively early spectral type (F–A, see also Lorenzetti et al. 2011, and references therein). In particular, it is worth noting: a) the presence of H2O MASER emission (Torrelles et al. 1986; Marvel 2005) with a high isotropic luminosity (310-6 ; Torrelles et al. 1986), which implies that the exciting source is, at least, an intermediate-mass star (see e. g., Anglada et al. 1996); b) the presence of a massive circumstellar disc (0.8 Hamidouche 2010), uncommonly massive even for a young Herbig Ae star.
Additionally, there are at least two other relevant indications in our spectrum supporting that the central object is an intermediate-mass young star: the presence of UV pumped lines in emission, and the inferred jet velocity. It is worth noting that UV pumped lines have been also observed in low-mass eruptive stars. However, they were detected only in the outburst phase (e. g. EX Lup, SpT M; see Kóspál et al. 2011b). In the spectrum of PV Cep, these features are observed during a lower accretion state (likely close to the quiescent phase), supporting the idea that they are excited by the stellar photosphere. An effective temperature () of 8 000 K (with density of 109 cm-3; Kun et al. 2011) is needed to produce the observed Fe ii UV pumped lines (see e. g., Johansson & Letokhov 2004, 2007, and references therein). Therefore, it is quite likely that is the temperature of the stellar photosphere (), which excites the Fe ii emission in the circumstellar region close to the disc.
The high jet velocity (600 km s-1, see Sect. 4.4) implies that the central source is massive enough (2–3 ) to accelerate the ejecta. For example, assuming that the jet velocity is close to the escape velocity, i. e. , and M∗=2.6 , R∗ =2.9 (Thé et al. 1994), we obtain 580 km s-1, very close to the value measured in Sect. 4.4.
4.3 Accretion properties
Several empirical relationships have been proven effective in deriving YSO accretion luminosity from the dereddened line fluxes of different accretion tracers (see, e. g. Muzerolle et al. 1998a, 2001; Calvet et al. 2004; Natta et al. 2006). We use Pa, Br line dereddened fluxes (adopting =10.8 mag, see Sect. 4.1) and the following empirical relationships from Calvet et al. (2000, 2004), which have been specifically calibrated for protostars of intermediate mass (Calvet et al. 2004):
| (1) |
| (2) |
As a result, we obtain =5.8 , and =5.6 . For our analysis, we therefore assume an average value of 5.7 . We note that using the relationships from Muzerolle et al. (1998a), which are calibrated on solar-mass YSOs, we would get larger values which are not self-consistent (namely, 8 and 26 , from the Pa and Br lines, respectively). Moreover, it is worth noting that Lorenzetti et al. (2009) derived and from their multi-epoch spectroscopy using Muzerolle et al. (1998a) relationships. The resulting and values systematically diverge by a factor of three to five (see their Tab. 12), too large even considering the uncertainties on the measured fluxes. On the other hand, their data become self-consistent (within the error bars) if Eq. 1 and 2 are adopted. In this case their values are also coincident with estimates of Kun et al. (2011), ranging from 80 , during the outburst in 2004 down to 40 in 2010. These values are up to one order of magnitude larger than ours, indicating that of PV Cep is still decreasing.
Finally, we get an estimate of the mass accretion rate by combining the obtained accretion luminosity and the adopted stellar parameters. Given that is the energy released by matter accreting from the co-rotational radius (at 5 ) onto the YSO (Gullbring et al. 1998):
| (3) |
Therefore, is given by:
| (4) |
The resulting value is 210-7 M☉ yr-1, i. e. at least one order of magnitude lower than what was measured by Lorenzetti et al. (2009) and Kun et al. (2011) during and immediately after the 2004 outburst. This indicates a decrease in the PV Cep mass accretion rate since its maximum in 2004–2005. The current value is, nevertheless, still about one order of magnitude higher than the typical values of pre-main sequence (PMS) stars of similar mass (e. g., Calvet et al. 2004; Garcia Lopez et al. 2006). This implies that accretion at high rates is still ongoing, as also pointed out by the presence of the CO lines in emission (e g., Davis et al. 2011; Biscaya et al. 1997).
4.4 Jet kinematics and dynamics
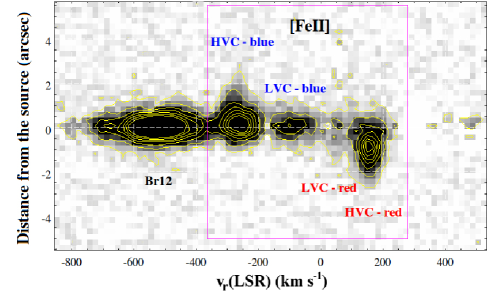
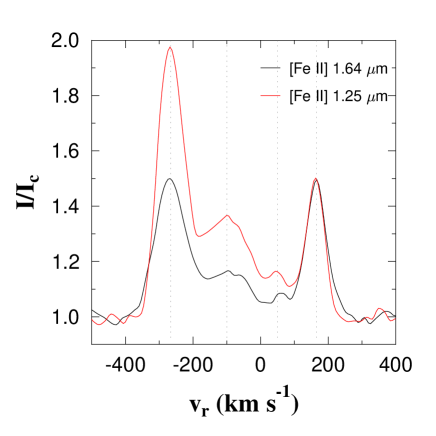
Figure 3 shows a continuum-subtracted spectral-image of PV Cep around the [Fe ii] 1.644 m line in the H-band. Four peaks are detected: two blue-shifted (HVC-blue and LVC-blue) and two red-shifted (HVC-red and LVC-red). Red- and blue-shifted LV components are observed only in the brightest lines (at 1.257 and 1.644 m). They are not spatially resolved, observed on source within 0.8, or 400 AU assuming a distance of 500 pc. On the other hand, the HVC emission extends up to 25 away from the source, tracing part of the jet close to the YSO (the wiggling geometry of the jet did not allow us to encompass the jet full extension). The HVC red-shifted emission peaks at 1 (or 500 AU) from the source, whereas we do not detect any obvious knot emission along the blue-shifted part of the jet, although the emission is clearly elongated. Indeed the actual jet P.A. slightly differs from the adopted slit P.A., and our slit encompassed the southern jet lobe better than the northern lobe. This can be clearly seen in Figure 5 of Hamidouche (2010), where blue- and red-shifted outflow lobes unequivocally show different position angles. [Fe ii] profiles of the 1.257 and 1.644 m lines, normalised to the continuum, are shown in Figure 4. HVC profiles are well defined, with average peak radial velocities of 265 and 165 km s-1 and an average deconvolved line width333=, where in the band, see Sect. 2 () of 70 km s-1. On the other hand, the LVC profiles are less delineated, with average peak radial velocities of 100 and 50 km s-1, and an average of 160 km s-1. Figure 4 indicates that both HVC and LVC peak velocities are asymmetric (i. e. the blue-shifted peak velocities are larger than the red-shifted counterparts) by a factor of 1.6 and 2, respectively. Moreover, as already seen in Sect. 4.1, the decreasing intensity ratio between the two line profiles implies that the visual extinction increases from the blue- to the red-shifted lobe.
Interferometric observations of Hamidouche (2010) provide us with a good estimate of the PV Cep disc inclination (624), indicating that the system axis is relatively close to the plane of the sky (284). From the radial velocity, we can thus derive the tangential and total velocity of the jet ( and , respectively) as well as estimate when the observed knot was ejected. Inferred tangential velocities are 500 and 310 km s-1 for the HV components (blue and red lobe, respectively), and 190 and 90 km s-1 for the LV components (blue and red lobe, respectively), which translate into of 565, 350, 210, and 110 km s-1. Thus, if we assume a of 310 km s-1 for the HVC of the red-shifted jet, we infer that the observed knot has been ejected between 7 and 8 years before our observations (i. e. between 2004 and 2005). Therefore, the observed emission is likely the outcome of the 2004 outburst (Elek & Kun 2010; Kun et al. 2011).
4.5 Jet physical parameters
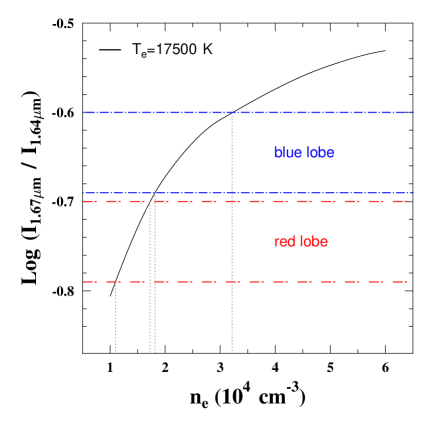
The various [Fe ii] lines also allow us to derive the physical properties of the jet close to the source. These lines come from transitions among the , , , and terms (see Column 7 of Tab. LABEL:lines:tab). Transitions from the first three levels have similar excitation energies (11 000–12 000 K), but they have different critical densities (104–105 cm-3). Therefore, their line ratios can be used to derive the gas electron density () (e. g., Nisini et al. 2002; Takami et al. 2006). On the other hand, transitions originating from the term have a higher excitation energy (20 000 K), and they can thus provide an estimate of the electron temperature (), when combined with lines from different energetic levels.
To infer and of the jet, we use a non-LTE model (Nisini et al. 2002; Garcia Lopez et al. 2008, 2010) that considers the first 16 fine-structure levels of [Fe ii] and thus also includes the lines presented in this paper. Our model employs transition probabilities from Nussbaumer & Storey (1988) as well as level energies and rate coefficients for electron collisions from Zhang & Pradhan (1995).
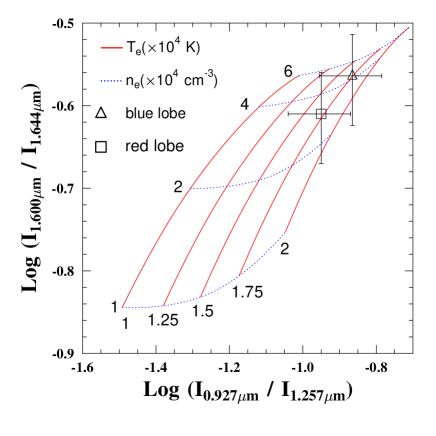
We first construct a diagnostic diagram (top panel of Figure 5) using line ratios sensitive to electron temperature (0.927 m/1.257 m, X axis) and density (1.600 m/1.644 m, Y axis). The logarithmic theoretical ratios are plotted as a function of between 10 000 and 20 000 K (red solid lines) and between 10 000 to 60 000 cm-3 (blue dotted lines). We then plot the logarithmic dereddened line ratios observed in the blue- and red-shifted HVC of the jet (triangular and squared symbols, respectively), using the values found in Sect. 4.1. Because we do not detect any red-shifted emission in the 0.927 m line (due to the high visual extinction), we assume the same electron temperature for both lobes. However, this assumption is not necessarily correct, because the two lobes have different velocities (Sect. 4.4), and, possibly, different excitation conditions. The derived and values for the blue lobe are K and cm-3, whereas a slightly lower density value of cm-3 is inferred for the red lobe.
A further estimate of the in both lobes is obtained from the 1.677 m and 1.644 m line ratio (see Figure 5, bottom panel). For =17 500 K, we derive between 18 000 and 32 000 cm-3 and between 11 000 and 17 000 cm-3. Although lower, these estimates are consistent with those previously obtained, confirming that the electron density of the red lobe is between 1.5 and 2 times lower than the value obtained in the blue part. Thus we get a weighted mean for the electron density of 30 000 cm-3 and 15 000 cm-3 (blue and red lobe, respectively).
4.6 Mass ejection rate
Jet physical and kinematical parameters previously inferred permit us to evaluate the mass ejection rate () in both lobes. Moreover, by means of our velocity-resolved observations, we can infer in the different velocity components, probing the structure of the jet/wind itself. As the [Fe ii] emission is optically thin, its luminosity provides us with an estimate of the total mass of the emitting gas (). The mass ejection rate will be then given by , where is the tangential velocity and is the jet extension on the sky plane. The relation between and [Fe ii] luminosity is , where is the average atomic weight, and are the proton mass and the total density, and is the volume of the emitting region. The term can be reformulated as the luminosity of a particular transition (the 1.644 m line, in this case), or , where L1.644 is the luminosity of the 1.644 m line, for the selected transition, and are the radiative rate and the fractional population of the upper level of the transition, is the ionisation fraction of the considered species with a total abundance of with respect to the hydrogen. To obtain the luminosity of the 1.644 m line, we first deredden the fluxes of the four observed components, according to the values found in Sect. 4.1. The fractional populations were then computed using a constant value of 17 500 K for and values of 30 000 cm-3 and 15 000 cm-3, for the blue and red lobes, respectively (see Sect. 4.5). We also assume the same values for the LV and HV components. Such assumption implies that both components have similar physical properties, which is unlikely because they have different spatial extension and might originate from two different circumstellar regions (e. g., a disc wind and a jet). For example, Garcia Lopez et al. (2008, 2010) find that is higher in the LVC of jets from Class I YSOs (about a factor of two with respect to the HVC values), whereas the opposite is found in more evolved CTTSs (see e. g., Bacciotti et al. 2000; Coffey et al. 2008). In the former case () a lower value (less then a factor of two) is obtained, whereas we get the opposite in the latter case ().
Finally, we assume that all iron is ionised (i. e. =1), with a solar abundance of 2.810-5 (Asplund et al. 2005, i. e., no dust depletion).
As a result, we obtain =1.510-7 M☉ yr-1, and =1.210-7 M☉ yr-1 from the high velocity components of the blue and red lobes, respectively, whereas we get =510-8 M☉ yr-1, and =410-8 M☉ yr-1 from the low velocity components of the blue and red lobes. Uncertainties can be estimated up to a factor of two. Despite the asymmetry in velocity, both lobes have, within the uncertainties, the same mass ejection rates in both HV and LV components, whereas the larger is carried by the HV component, as previously observed in other jets from young and embedded stellar objects (e. g., Garcia Lopez et al. 2008, 2010).
4.7 CO bandhead modelling
We investigate whether the CO emission is likely to originate from a small-scale gaseous disc, interior to the disc structure already resolved by Hamidouche (2010). To evaluate such hypothesis and constrain the physical properties of the CO emitting region, we simultaneously model the CO and bandhead emission. A detailed description of our modelling technique is given in Wheelwright et al. (2010) and in Ilee et al. (2013). In brief, a geometrically thin flat disc is considered, where the excitation temperature and CO surface number density decrease as power laws with increasing radius () as:
| (5) |
| (6) |
where and are the excitation temperature and the CO surface density at the inner edge of the disc ().
The optical depth is given by the absorption coefficient per CO molecule the CO column density (i. e., because of the thin disc). Our model takes into account up to =100 rotational levels in local thermal equilibrium (LTE) for the two transitions, where the CO energy levels and the Einstein coefficients are taken from Farrenq et al. (1991) and from Chandra et al. (1996), respectively. The disc is split into radial and azimuthal cells. The spectrum of each is calculated individually and then summed together to form the spectrum for the entire disc.
We model the kinematics of the emitting region by assuming Keplerian rotation (). We allow the disc to be inclined and calculate the line of sight velocity for each disc cell. The final emission feature is given by summation of the individual cell spectra, which is then convolved to the resolution of the observations. The best-fit model parameters are determined by comparing the observations and model using the downhill simplex algorithm implemented in idl as the amoeba routine. We explored several different initial positions to avoid local minima. The stellar mass and radius are fixed parameters (as reported in Table 1), whereas the , , , inner radius (), intrinsic line width () and the and exponents are free parameters. Model fits are then related to the data employing the reduced chi-squared statistic. The uncertainty in the data is derived from the standard deviation of the flux in the pre-bandhead portion of the spectrum.
Figure 6 shows a close-up of the spectrum around the CO bandheads (in black) with the best-fitting model superimposed in red (=5.2), whilst the fitted parameters are presented in Table 2.
| Physical Parameter | Value |
|---|---|
| 61021±1 cm-2 | |
| 0.30.1 AU | |
| 2.9 AU | |
| 2980 K | |
| 51 | |
| 7 km s-1 | |
| -0.5 | |
| -3.9 |
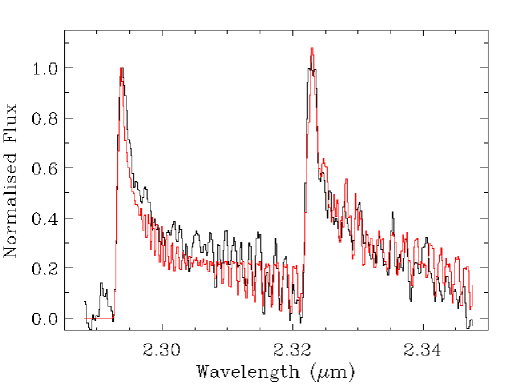
The resulting parameters indicate that the CO bandhead emission can be reproduced using a disc model that has the same inclination as the outer disc. Thus the observed CO emission should not originate from the outflow. This supports the existence of a small scale gaseous disc structure, that extends from 0.30.1 AU up to 2.9 AU from the source and has an inner excitation temperature of 3000 K. These quantities are larger than those found in other EXors with lower , e. g., EX Lupi (0.1 AU, 2500 K, 0.6 M☉; see, Aspin et al. 2010; Kóspál et al. 2011b), or in CTTs (0.1 AU, 0.2 AU), and more similar to values found in Herbig Ae stars (see e. g., Salyk et al. 2011), underlining once more the uncommon EXor nature of PV Cep. Our CO modelling is consistent with a flared irradiated disc, but it is slightly too hot (several hundreds Kelvin). This might be an aftermath of the recent outburst in 2004, which heated and remodelled the inner disc region. Finally, assuming a dust sublimation temperature () of 1500 K (see e. g., Salyk et al. 2011), from Eq. 5 we can estimate that the sublimation radius () is positioned at 0.3-0.5 AU from the source. The same result (0.4 AU) can be obtained from Equation 2 in Salyk et al. (2011)444 assuming a source luminosity () of 100 (see, Lorenzetti et al. 2009, and references therein). The inferred value is very similar to those typical for Herbig Ae stars (see e. g., Salyk et al. 2011), and it is comparable to the value inferred in EX Lup during the outburst (0.2-0.3 AU; Kóspál et al. 2011b).
4.8 HI emission modelling
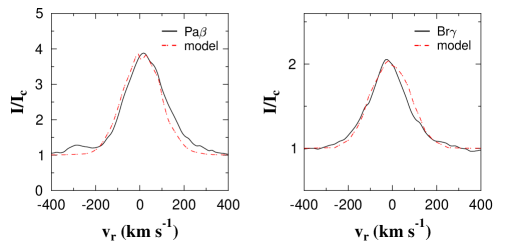
As mentioned in Sect. 3, the observed lines from the Paschen and Brackett series show different shapes and peak velocities: i. e., Brackett lines are blue-shifted and single-peaked (at 20 km s-1), whereas Paschen lines are double peaked (see Figure 7), with bright red-shifted maxima (at 30 km s-1) and weak blue-shifted peaks (at 270 km s-1). We aim at modelling both strengths and profiles of the Paschen and Brackett lines to constrain the physical conditions and study their origin.
In highly reddened objects, the observed emission is the sum of direct and scattered light, both dimmed by the circumstellar dust. Depending on the geometry of the scattering and emitting regions, the line profile of the scattered radiation can strongly differ from the profile given by the direct radiation (Grinin et al. 2012). This circumstance has to be taken into account when analysing emission spectra of objects like PV Cep. Moreover, extinction differentially affects Paschen and Brackett lines observed in the infrared region of the spectrum. Finally, scattering on dust also takes place in a different way for lines of the two considered series (e. g., the scattering coefficient for the Pa line is a factor of 2.6 greater than the Br line one).
To model the H i lines, we therefore consider direct radiation, originating from both magnetospheric accretion and disc wind, as well as emission scattered by the circumstellar disc. Additionally, our model also takes into account a screening effect from the disc. An opaque disc can be a screen that shifts the emission lines towards the blue part of the spectrum. We assume that the disc is opaque beyond the sublimation radius (30 for PV Cep). Therefore, the remote red-shifted part of the wind is partially hidden from the observer. A detailed description of the disc wind, scattering, and magnetospheric accretion models employed here can be found in Grinin & Tambovtseva (2011) (also see Weigelt et al. 2011), Grinin et al. (2012), and Tambovtseva et al. (2001), respectively, whilst a complete description of the full model, which groups the aforementioned models, is given in Tambovtseva et al. (in preparation). For our modelling, we consider an inclination of 60 (angle between the viewing direction and the system axis), as derived from the observations (see Tab. 1, and Sect. 4.7). We let vary the mass accretion and ejection rate values one order of magnitude around those found in Sections 4.3 and 4.6.
The main parameters of our disc wind model are the following (see also Fig. A.1 in Weigelt et al. 2011, for a graphical representation of the disc wind model along with the listed parameters). The disc wind launching region () extends from 3 to 37 (0.04–0.5 AU); half-opening angles () of the disc wind for the first and last streamlines are 30–80; the parameter (, where is the distance of the point , from the rotation axis), which ‘distributes’ the mass load among the streamlines, is 5. The electron temperature is constant and equal to 10 000 K, the mass loss rate is 310-8 M⊙ yr-1, and =4, where the parameter is a power index in the velocity law (, where and are the initial and terminal values of the radial velocity). A scaling factor () between the radial and tangential velocities decreases with the distance from the star, due the magnetic field intensity decrease along the disc. Table 3 lists the main parameters of our best-fit model. In Figure 7, we show the Pa and Br profiles (red dashed lines) resulting from our modelling superimposed over the observed profiles (black solid lines).
| Physical Parameter | Value |
|---|---|
| 3–37 (0.04–0.5 AU) | |
| 30–80 | |
| 5 | |
| 4 | |
| 10 000 K | |
| 60 | |
| 310-8 M⊙ yr-1 |
We then also check for the influence of the magnetosphere on the line profiles applying the magnetospheric model from Tambovtseva et al. (2001), and using an / ratio ranging from 0.1 to 0.3.
From the line profile fitting we note that the contribution of magnetospheric accretion to the line profile is small in comparison to the contribution of the disc wind. In our modelling magnetospheric accretion slightly modifies the width of the line, which is increased less then 10% of its FWHM. Therefore, it is not possible to derive a precise estimate of the mass accretion rate from the line modelling. On the other hand, both screening effect and the scattering shift the line profiles towards the blue side. It is worth noting that both Brackett and Paschen lines would be then blue-shifted, but the shift of the Pa line is partly compensated by the self-absorption effect from the outflow, because the optical depth of this line is larger than that of the Br line.
Finally, the additional blue-shifted peaks in the Paschen lines could not be reproduced by our model. Possibly, this weak emission originates from the jet, which is not included in our model. Indeed, Whelan et al. (2004) observed extended Paschen emission associated to jet tracers in several CTTs. The velocity peaks of the secondary maxima in our Paschen lines (270 km s-1) have the same values of the [Fe ii] blue-shifted HVC. Nonetheless, no obvious red-shifted component is visible in the Paschen profiles. It might be overwhelmed by the main emission, assuming that the red-shifted emission of the jet is also asymmetric. This would explain the faint bump observed on the red-shifted side of the line (see Figure 7, left panel). Otherwise, its non-detection might be due to the opaque disc, which blocks the emission from the counter jet. In this case, the Paschen emission from the jet should be very close to the source. Assuming that the disc is opaque up to 100 AU, it should be closer than 60 AU (assuming an inclination angle of 30 with respect to the plane of the sky).
5 Discussion
5.1 The accretion/ejection connection
The detection of an emerging knot, which can be clearly linked to the PV Cep outburst event in 2004, is indeed an interesting result, which supports the hypothesis that enhanced accretion also generates augmented ejection along YSO outflows. Boosted winds after outbursts were already observed in Z CMa (Benisty et al. 2010) , V1647 Ori (Brittain et al. 2010), and EX Lup (Goto et al. 2011; Kóspál et al. 2011b) by means of H i and CO emission lines. Their intensity has been found to be closely related with the accretion rate variability. However, it is extremely rare that knot formation is observed along the jet immediately after an outburst event from an EXor, because EXors usually do not have jets nor show jet line tracers. Whelan et al. (2010) report the first case observed in the Z CMa companion, which displayed four ‘EXor-like’ outbursts in the past twenty years. The authors present AO imaging in [Fe ii], showing four knots, whose dynamical ages are compatible with the timing of the outbursts. Thus our data strengthen the idea that knots along the flows may have been produced by episodic accretion, possibly similar to the ‘EXor-like’ outbursts, i. e. bursts of short duration, and not as powerful as those from FUors (Ioannidis & Froebrich 2012). In principle, FUor bursts might be so powerful that they disrupt the circumstellar environment and the small-scale magnetic field. Thus the collimated jet/outflow would temporarily switch to a wide-angled wind, failing in developing knots along the flow. This might explain why no knots have been associated to FUor burst episodes.
A fundamental quantity in the star formation process is also given by the mass ejection to accretion rate ratio (/), which provides us with the efficiency of the stellar accretion process. At variance with the single terms of the ratio, which, on average, depends on and decreases as the source evolves (Natta et al. 2006; Caratti o Garatti et al. 2012), / seems to be relatively constant in time (between 0.01 and 0.1), according to both MHD models and observations (e. g., Calvet 2004; Pudritz et al. 2007). It has also been stressed (e. g., Cabrit 2009, and references therein) that such a ratio should not exceed a value of about 0.1, in order to agree with the main MHD launching models. Indeed, the measured ratios are strongly affected by the uncertainty on both and estimates, usually up to one order of magnitude. From our estimates in Sect. 4.3 and 4.6 we would obtain a ratio very close to one, which is too high, even when uncertainties are taken into account. However, we should keep in mind that the inferred estimates might not trace two simultaneous events. In particular, due to the different sizes of the emitting regions, the different cooling times of the two considered species, and the low spatial resolution of our spectral-images (08400 AU), the ejection rate derived from the [Fe ii] emission is averaged over 6 years around the outburst event, whereas the H i emission is mostly tracing the present accretion rate. Therefore we should instead compare with an average value of during and after the outburst (few 10-6 M☉ yr-1; Lorenzetti et al. 2009; Kun et al. 2011). The resulting ratio is then between 0.05 and 0.1. A similar result is obtained comparing the actual / ratio, derived from the H i in Sect. 4.3 and Sect. 4.8.
5.2 An ionised jet/wind
The fading phase of PV Cep gives us a unique opportunity to study the jet and outflow relatively close to the source, also providing us with indications of the accretion/ejection interplay.
Our analysis shows strong evidence of both jet and wind in the PV Cep outflowing material. High-resolution spectroscopy of YSO jets usually reveals the existence of two velocity components close to the source, namely a high- and low-velocity component. The HVC is associated with the extended collimated jet. On the other hand, the LVC is usually confined close to the central object (up to 100–200 AU) and it is probably produced by a disc wind (see e. g., Garcia Lopez et al. 2008; Dougados 2008; Caratti o Garatti & Eislöffel 2009). Both components are usually observed through forbidden emission lines (FELs) in CTTSs and in a few Herbig Ae/Be stars (see, e. g., Pyo et al. 2002; Davis et al. 2003), whereas molecular hydrogen emission lines (MHELs) have been also detected in less evolved Class I objects (see, e. g., Davis et al. 2001). Moreover, the LVC is confined within 200 AU in CTTSs, whereas in the younger and less evolved Class I objects is usually more extended (up to 1000–2000 AU; see Garcia Lopez et al. 2008, 2010). The former picture is more likely in PV Cep, in which the [Fe ii] LV component is positioned close to the source (400 AU), whereas the HV component is extended. In addition, the LVC (in both lobes) has a wide (160 km s-1, see Sect. 4.4), which is 2–3 times larger than the HVC (70 km s-1). Because MHD models predict that the jet terminal velocity is mostly determined by the Alfvén radius, within which the magnetic field lines act as lever arms (see e. g., Konigl & Pudritz 2000), the width of the line is closely related to the size of the emitting region (Pyo et al. 2002). Thus the narrow velocity width of the HVC indicates that the line-emitting jet is launched within a narrow region in the disc, whereas the broad velocity width of the LVC suggests a wider region of the disc. Moreover, the higher peak velocity of the HVC implies that it is launched from a disc region more internal than that of the LVC. This indicates that the HV and LV components trace the jet and the wind, respectively. Notably, the described picture fits well the CO observations in Arce & Goodman (2002a). Based on their analysis of the geometry and kinematics of the molecular emission close to the source, the authors predicted the presence of a wide-angle wind and a collimated jet. Finally, we also note that the jet is fully atomic. Indeed the H2 line at 2.12 m (the only H2 line detected in the spectrum) is not produced along the jet, which is fast enough (600 km s-1) to dissociate the H2 and partially ionise the medium. At variance with the [Fe ii] emission, the 1-0 S(3) line is not spatially resolved and it is confined within the first 400 AU from the source. It shows just one velocity component at 13(15) km s-1, i. e., very close to the rest velocity frame of the system, with a narrow (7.4 Å, i. e. 60 km s-1), pointing to a disc and/or wind origin. The former is more likely, due to the lack of a red-shifted component.
5.3 Origin of the jet/wind asymmetry
Another interesting and peculiar aspect of the PV Cep jet/outflow is its asymmetry. Velocities in the southern red-shifted and northern blue-shifted lobes are asymmetric in both LV and HV components, as well as their inferred electron densities. Asymmetric jets from YSOs have already been observed in various YSOs (see e. g., Hirth et al. 1994; Melnikov et al. 2009; Podio et al. 2011), but this is the first documented case of an asymmetric jet produced during an outburst.
The origin of such asymmetries still remains an open problem. It might be intrinsic to the source and strictly linked to the launching mechanism (e. g., asymmetry in the magnetic field configuration), or extrinsic, i. e. caused by different physical conditions in the circumstellar medium, such as an inhomogeneous medium (for a detailed discussion see, Matsakos et al. 2012). In principle, the former scenario could explain both the observed YSO variability (which cannot be triggered by the presence of a close companion) and the asymmetries observed in the jet.
However, the estimated mass loss rate in the two lobes is comparable, suggesting that the ejection power is similar on both sides of the system, as expected from a magneto-centrifugal ejection mechanism. Notably, two previously analysed asymmetric jets (namely, RW Aur and DG Tau; see Melnikov et al. 2009; Podio et al. 2011) show similar characteristics: velocity and density asymmetries and the same in both lobes. The authors of both works suggest that the observed asymmetries are due to different mass load and/or propagation properties in an inhomogeneous environment. The medium around PV Cep is highly inhomogeneous, as observed in the large-scale CO outflow studied by Arce & Goodman (2002b), and partially suggested by the different values observed along the jet in the northern (blue-shifted) and southern (red-shifted) lobes (see Sect. 4.1). PV Cep is located in the northern edge of its dark cloud, thus the northern and southern lobes interact with environments at very different densities. Hence, the blue-shifted ejected matter (northwards) interacts with a much less dense medium, producing a highly asymmetric jet and, in turn, a highly asymmetric outflow. It is worth noting that the velocity asymmetry in the [Fe ii] LV component implies that such inhomogeneities in the medium density must extend very close to the YSO (at least down to 400 AU), and, more likely, down to the YSO disc. In this case, the disc would directly interact with an inhomogeneous asymmetric ambient medium, producing an asymmetry in magnetic lever arms and/or launch radii between either sides of the disc (Ferreira et al. 2006; Podio et al. 2011). Thus, the power generated by the MHD dynamo and conveyed by the rotating disc to both sides is identical, but the physical conditions of the ejected material may be different on the two sides.
5.4 Circumstellar environment
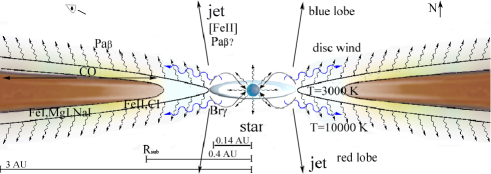
Our analysis provides us with an overview of the circumstellar environment of PV Cep during the pre-quiescent phase, i. e. when the outbursting phase is fading and the inner disc region is rearranging in a more stable state. The inner region is dominated by hydrogen gas (up to 0.14 AU) as delineated by the Br line (see Fig.8). A more extended H i region (up to few AUs) is also traced by the Paschen emission lines. In this region there is also evidence of atomic fluorescent emission lines (Fe ii at 1 and 1.688 m; and C i at 1.17–1.19 m) and other metallic lines (e. g., Fe i, Fe ii, Mg i, C i, Na i), whose excitation potential (4–8 eV) is lower than H i (13.6 eV). According to Kóspál et al. (2011b), the emitting region is placed where the hydrogen is mainly neutral, likely shielded from the shock radiation by the circumstellar disc. On the other hand, the fluorescent emission indicates that the emitting region is located close to the disc surface. Beyond this region, we model a small-scale gaseous disc ring, traced by the CO emission, and extending from 0.2-0.4 AU to 3 AU from the source. The inner region has a temperature of 3000 K. This part of the disc is hotter in comparison with the typical values found in Herbig Ae stars. This might be a result of the heat produced by the outburst. Dust is likely to coexist within this gaseous region, being at 0.3–0.5 AU from the source.
Finally, [Fe ii] analysis proves the existence of both wind and jet emission close to the source. Our modelling suggests that the bulk of the H i emission originates from a wind located close to the source. The presence of a secondary maximum in the Paschen lines also indicates that a small part of the Paschen emission might originate from the blue-shifted part of the jet.
5.5 How close is PV Cep to EXors?
An interesting question to answer is how similar PV Cep is to other EXors. Lorenzetti et al. (2011) already pointed out that PV Cep is not a genuine EXor according to the classical definition given by Herbig (1989). As considered by the authors, the main resemblance with the EXor group resides in both spectrum and recurrent outbursts driven by disc accretion episodes. On the other hand, the most important discrepancies appear to be its higher mass and earlier evolutionary stage with respect to other classical EXors. The remaining differences listed in Lorenzetti et al. (2011) (i. e. circumstellar nebulosity, jet/outflow presence, massive disc, far-infrared excess in the SED, presence of maser and radio continuum emission) can all be a consequence of the previous two.
We can now compare our results with the circumstellar environment of the EXor prototype EX Lup (Kóspál et al. 2011b; Sicilia-Aguilar et al. 2012) to get a more quantitative evaluation. Our analysis shows many similarities between the two objects, both in the physical structure and the observed spectra. However, as already mentioned in Sect. 4.7 and 4.8, the size of the various regions appears to be larger and the excitation conditions are more extreme. This is compatible with a hotter, more massive object. Another significant difference in PV Cep spectrum is the presence of jet tracers. Conical nebulae (namely the outflow cavities), jets, knots and outflows are not present in EXors. This indicates that the PV Cep is young and that its circumstellar environment has not been cleared by the YSO activity, favouring the formation of a jet, shocked knots, and a swept out outflow.
In conclusion, as already pointed out by Lorenzetti et al. (2011), PV Cep is not a classical EXor because it is not a low-mass PMS star. It is more massive, young and embedded than classical EXors. Nevertheless, it shows the signature of an ‘EXor-like’ outburst, which suggests a common origin. We can therefore argue that PV Cep is a younger, high-mass counterpart of classical EXors. Indeed, the discovery and study of more embedded outbursting YSOs in the near future will increase our knowledge of and statistics on these phenomena and possibly confirm that enhanced accretion processes are common to all YSOs, despite the difference in their mass or evolutionary stage. Therefore, on the basis of the new discoveries, it is quite likely that the two main sub-classes (FUors and EXors) will be revised.
6 Conclusions
We have presented near-IR medium-resolution spectroscopy of PV Cep taken with LUCIFER at the LBT in 2012, i. e. eight years after its last outburst. By means of the many emission lines detected in the spectrum, we are able to trace both accretion and ejection activity, deriving the physical and dynamical conditions in its circumstellar region. The main results of this work are the following:
-
-
The NIR spectrum of PV Cep displays several strong emission lines and a steeply rising continuum without photospheric absorption features. The most prominent features in the PV Cep spectrum are circumstellar features, originating from YSO accretion or inner winds, as, e. g., H i, Ca ii, shocks along the jet ([Fe ii]), inner disc region (e. g.,Na i, CO) or chromospheric activity (e. g., Fe i, Fe ii, Mg i, C i). A few fluorescent emission lines from Fe ii (i. e., at 1 and 1.688 m) and C i (i. e., 1.17–1.19 m) are pumped by UV photons.
-
-
Compared to the outburst in 2004 and subsequent photometry, our data show that PV Cep’s brightness is fading, indicating that the outburst phase is declining. However, the many detected lines show that accretion and ejection activities still proceed at high rate.
-
-
The actual mass accretion rate is 210-7 M☉ yr-1, i. e. at least more than one order of magnitude lower than values measured during the 2004 outburst.
-
-
Among the several emission lines, only the [Fe ii] intensity increased since the outburst in 2004. The observed emission traces blue- and red-shifted lobes of an asymmetric jet/outflow. In each lobe, two velocity components are detected: a LVC, not spatially resolved (within 400 AU from the source), likely tracing a disc wind, and an extended HVC tracing the jet. Velocities between the two lobes are asymmetric (1.6 ratio between blue- and red-shifted part). Total velocities for the HVC and LVC are 570 and 350 km s-1, and 210 and 130 km s-1, respectively.
-
-
The observed emission has a dynamical age of 7–8 years, indicating that it was produced during the 2004 outburst.
-
-
Jet physical properties are derived from different [Fe ii] transition ratios. The visual extinction decreases moving from the red-shifted (=10.10.7 mag) to the blue-shifted lobe (=6.50.4 mag). We derive an average electron temperature of =17 500 K, and electron densities of 30 000 cm-3 and 15 000 cm-3 for the blue and the red lobe, respectively.
-
-
The measured mass ejection rate is 1.510-7 M☉ yr-1 in both lobes. These estimates fairly match the high accretion rate observed during and immediately after the outburst (/0.05–0.1).
-
-
The similar mass loss rate in the two lobes suggests that the ejection power is comparable on both sides of the disc, as expected from MHD ejection mechanisms. The observed asymmetries are thus consistent with an inhomogeneous medium, as also indicated by the large-scale CO analysis in Arce & Goodman (2002a).
-
-
Our modelling of the CO emission hints at a small-scale gaseous disc ring, extending from 0.2-0.4 AU to 3 AU from the source. This region has an inner temperature of 3000 K (exponentially decreasing).
-
-
Our H i line modelling indicates that most of the observed emission comes from an expanding wind at =10 000 K. Brackett and Paschen line profiles are strongly affected by scattering, disc screening, and outflow self-absorption.
-
-
PV Cep is not an EXor object, according to the classical definition given by Herbig (1989). It is more massive and younger than typical EXors. Nevertheless, it shows the signature of an ‘EXor-like’ outburst, suggesting a similar outburst mechanism.
In conclusion, EXors and related objects offer a unique opportunity to investigate the fundamental accretion/ejection mechanism, because the physical properties of the accretion process and, only few years later, the corresponding ejection event can be related and studied in detail.
Acknowledgements.
We wish to thank the referee, Dr. Ágnes Kóspál, for her useful insights and comments. J.D. Ilee acknowledges funding from the European Union FP72011 under grant agreement no. 284405. This research has also made use of NASA’s Astrophysics Data System Bibliographic Services and the SIMBAD database, operated at the CDS, Strasbourg, France.References
- Ábrahám et al. (2000) Ábrahám, P., Leinert, C., Burkert, A., Henning, T., & Lemke, D. 2000, A&A, 354, 965
- Anglada et al. (1996) Anglada, G., Estalella, R., Pastor, J., Rodriguez, L. F., & Haschick, A. D. 1996, ApJ, 463, 205
- Arce & Goodman (2002a) Arce, H. G. & Goodman, A. A. 2002a, ApJ, 575, 928
- Arce & Goodman (2002b) Arce, H. G. & Goodman, A. A. 2002b, ApJ, 575, 911
- Aspin et al. (2010) Aspin, C., Reipurth, B., Herczeg, G. J., & Capak, P. 2010, ApJ, 719, L50
- Asplund et al. (2005) Asplund, M., Grevesse, N., & Sauval, A. J. 2005, in Astronomical Society of the Pacific Conference Series, Vol. 336, Cosmic Abundances as Records of Stellar Evolution and Nucleosynthesis, ed. T. G. Barnes, III & F. N. Bash, 25–+
- Bacciotti et al. (2000) Bacciotti, F., Mundt, R., Ray, T. P., et al. 2000, ApJ, 537, L49
- Bally & Reipurth (2003) Bally, J. & Reipurth, B. 2003, AJ, 126, 893
- Bautista et al. (2004) Bautista, M. A., Rudy, R. J., & Venturini, C. C. 2004, ApJ, 604, L129
- Benisty et al. (2010) Benisty, M., Malbet, F., Dougados, C., et al. 2010, A&A, 517, L3+
- Biscaya et al. (1997) Biscaya, A. M., Rieke, G. H., Narayanan, G., Luhman, K. L., & Young, E. T. 1997, ApJ, 491, 359
- Brittain et al. (2010) Brittain, S. D., Rettig, T. W., Simon, T., Gibb, E. L., & Liskowsky, J. 2010, ApJ, 708, 109
- Brittain et al. (2007) Brittain, S. D., Simon, T., Rettig, T. W., et al. 2007, in IAU Symposium, Vol. 243, IAU Symposium, ed. J. Bouvier & I. Appenzeller, 223–230
- Cabrit (2009) Cabrit, S. 2009, Observational Constraints to Steady Jet Models in Young Stars, ed. K. Tsinganos, T. Ray, & M. Stute, 247–257
- Cabrit et al. (1990) Cabrit, S., Edwards, S., Strom, S. E., & Strom, K. M. 1990, ApJ, 354, 687
- Calvet (2004) Calvet, N. 2004, in IAU Symposium, Vol. 219, Stars as Suns : Activity, Evolution and Planets, ed. A. K. Dupree & A. O. Benz, 599
- Calvet et al. (2000) Calvet, N., Hartmann, L., & Strom, S. E. 2000, Protostars and Planets IV, 377
- Calvet et al. (2004) Calvet, N., Muzerolle, J., Briceño, C., et al. 2004, AJ, 128, 1294
- Caratti o Garatti & Eislöffel (2009) Caratti o Garatti, A. & Eislöffel, J. 2009, Jet kinematics, ed. K. Tsinganos, T. Ray, & M. Stute, 329–339
- Caratti o Garatti et al. (2012) Caratti o Garatti, A., Garcia Lopez, R., Antoniucci, S., et al. 2012, A&A, 538, A64
- Caratti o Garatti et al. (2011) Caratti o Garatti, A., Garcia Lopez, R., Scholz, A., et al. 2011, A&A, 526, L1
- Caratti o Garatti et al. (2006) Caratti o Garatti, A., Giannini, T., Nisini, B., & Lorenzetti, D. 2006, A&A, 449, 1077
- Chandra et al. (1996) Chandra, S., Maheshwari, V. U., & Sharma, A. K. 1996, A&AS, 117, 557
- Coffey et al. (2008) Coffey, D., Bacciotti, F., & Podio, L. 2008, ApJ, 689, 1112
- Cohen et al. (1981) Cohen, M., Kuhi, L. V., Spinrad, H., & Harlan, E. A. 1981, ApJ, 245, 920
- Connelley et al. (2009) Connelley, M. S., Reipurth, B., & Tokunaga, A. T. 2009, AJ, 138, 1193
- Covey et al. (2011) Covey, K. R., Hillenbrand, L. A., Miller, A. A., et al. 2011, AJ, 141, 40
- Davis et al. (2011) Davis, C. J., Cervantes, B., Nisini, B., et al. 2011, A&A, 528, A3
- Davis et al. (2001) Davis, C. J., Ray, T. P., Desroches, L., & Aspin, C. 2001, MNRAS, 326, 524
- Davis et al. (2003) Davis, C. J., Whelan, E., Ray, T. P., & Chrysostomou, A. 2003, A&A, 397, 693
- Dougados (2008) Dougados, C. 2008, in Lecture Notes in Physics, Berlin Springer Verlag, Vol. 742, Jets from Young Stars II, ed. F. Bacciotti, L. Testi, & E. Whelan, 105
- Elek & Kun (2010) Elek, E. & Kun, M. 2010, Journal of Physics Conference Series, 218, 012021
- Evans et al. (2009) Evans, N. J., Dunham, M. M., Jørgensen, J. K., et al. 2009, ApJS, 181, 321
- Farrenq et al. (1991) Farrenq, R., Guelachvili, G., Sauval, A. J., Grevesse, N., & Farmer, C. B. 1991, Journal of Molecular Spectroscopy, 149, 375
- Fedele et al. (2007) Fedele, D., van den Ancker, M. E., Petr-Gotzens, M. G., & Rafanelli, P. 2007, A&A, 472, 207
- Fendt (2009) Fendt, C. 2009, ApJ, 692, 346
- Ferreira et al. (2006) Ferreira, J., Dougados, C., & Cabrit, S. 2006, A&A, 453, 785
- Garcia Lopez et al. (2006) Garcia Lopez, R., Natta, A., Testi, L., & Habart, E. 2006, A&A, 459, 837
- Garcia Lopez et al. (2011) Garcia Lopez, R., Nisini, B., Antoniucci, S., et al. 2011, A&A, 534, A99
- Garcia Lopez et al. (2010) Garcia Lopez, R., Nisini, B., Eislöffel, J., et al. 2010, A&A, 511, A5
- Garcia Lopez et al. (2008) Garcia Lopez, R., Nisini, B., Giannini, T., et al. 2008, A&A, 487, 1019
- Goto et al. (2011) Goto, M., Regály, Z., Dullemond, C. P., et al. 2011, ApJ, 728, 5
- Grinin & Tambovtseva (2011) Grinin, V. P. & Tambovtseva, L. V. 2011, Astronomy Reports, 55, 704
- Grinin et al. (2012) Grinin, V. P., Tambovtseva, L. V., & Weigelt, G. 2012, A&A, 544, A45
- Gullbring et al. (1998) Gullbring, E., Hartmann, L., Briceno, C., & Calvet, N. 1998, ApJ, 492, 323
- Hamann & Persson (1992a) Hamann, F. & Persson, S. E. 1992a, ApJS, 82, 247
- Hamann & Persson (1992b) Hamann, F. & Persson, S. E. 1992b, ApJS, 82, 285
- Hamidouche (2010) Hamidouche, M. 2010, ApJ, 722, 204
- Hartmann & Kenyon (1996) Hartmann, L. & Kenyon, S. J. 1996, ARA&A, 34, 207
- Herbig (1989) Herbig, G. H. 1989, in European Southern Observatory Conference and Workshop Proceedings, Vol. 33, European Southern Observatory Conference and Workshop Proceedings, ed. B. Reipurth, 233–246
- Herbig (2007) Herbig, G. H. 2007, AJ, 133, 2679
- Hirth et al. (1994) Hirth, G. A., Mundt, R., Solf, J., & Ray, T. P. 1994, ApJ, 427, L99
- Hodapp et al. (1996) Hodapp, K., Hora, J. L., Rayner, J. T., Pickles, A. J., & Ladd, E. F. 1996, ApJ, 468, 861
- Hodapp et al. (2012) Hodapp, K. W., Chini, R., Watermann, R., & Lemke, R. 2012, ApJ, 744, 56
- Ilee et al. (2013) Ilee, J. D., Wheelwright, H. E., Oudmaijer, R. D., et al. 2013, MNRAS, 429, 2960
- Ioannidis & Froebrich (2012) Ioannidis, G. & Froebrich, D. 2012, MNRAS, 425, 1380
- Johansson & Letokhov (2004) Johansson, S. & Letokhov, V. S. 2004, A&A, 428, 497
- Johansson & Letokhov (2007) Johansson, S. & Letokhov, V. S. 2007, New A Rev., 51, 443
- Kelly et al. (1994) Kelly, D. M., Rieke, G. H., & Campbell, B. 1994, ApJ, 425, 231
- Konigl & Pudritz (2000) Konigl, A. & Pudritz, R. E. 2000, Protostars and Planets IV, 759
- Kóspál et al. (2011a) Kóspál, Á., Ábrahám, P., Acosta-Pulido, J. A., et al. 2011a, A&A, 527, A133
- Kóspál et al. (2008) Kóspál, Á., Ábrahám, P., Apai, D., et al. 2008, MNRAS, 383, 1015
- Kóspál et al. (2011b) Kóspál, Á., Ábrahám, P., Goto, M., et al. 2011b, ApJ, 736, 72
- Kun et al. (2011) Kun, M., Szegedi-Elek, E., Moór, A., et al. 2011, MNRAS, 413, 2689
- Lorenzetti et al. (2011) Lorenzetti, D., Giannini, T., Larionov, V. M., et al. 2011, ApJ, 732, 69
- Lorenzetti et al. (2009) Lorenzetti, D., Larionov, V. M., Giannini, T., et al. 2009, ApJ, 693, 1056
- Lumsden et al. (2012) Lumsden, S. L., Wheelwright, H. E., Hoare, M. G., Oudmaijer, R. D., & Drew, J. E. 2012, MNRAS, 424, 1088
- Magakian & Movsesian (2001) Magakian, T. Y. & Movsesian, T. A. 2001, Astrophysics, 44, 419
- Marvel (2005) Marvel, K. B. 2005, AJ, 130, 2732
- Matsakos et al. (2012) Matsakos, T., Vlahakis, N., Tsinganos, K., et al. 2012, A&A, 545, A53
- Melnikov et al. (2009) Melnikov, S. Y., Eislöffel, J., Bacciotti, F., Woitas, J., & Ray, T. P. 2009, A&A, 506, 763
- Muzerolle et al. (2001) Muzerolle, J., Calvet, N., & Hartmann, L. 2001, ApJ, 550, 944
- Muzerolle et al. (1998a) Muzerolle, J., Hartmann, L., & Calvet, N. 1998a, AJ, 116, 2965
- Muzerolle et al. (1998b) Muzerolle, J., Hartmann, L., & Calvet, N. 1998b, AJ, 116, 455
- Natta et al. (2004) Natta, A., Testi, L., Muzerolle, J., et al. 2004, A&A, 424, 603
- Natta et al. (2006) Natta, A., Testi, L., & Randich, S. 2006, A&A, 452, 245
- Nisini et al. (2002) Nisini, B., Caratti o Garatti, A., Giannini, T., & Lorenzetti, D. 2002, A&A, 393, 1035
- Nussbaumer & Storey (1988) Nussbaumer, H. & Storey, P. J. 1988, A&A, 193, 327
- Podio et al. (2011) Podio, L., Eislöffel, J., Melnikov, S., Hodapp, K. W., & Bacciotti, F. 2011, A&A, 527, A13
- Pudritz et al. (2007) Pudritz, R. E., Ouyed, R., Fendt, C., & Brandenburg, A. 2007, in Protostars and Planets V, ed. B. Reipurth, D. Jewitt, & K. Keil, 277–294
- Pyo et al. (2002) Pyo, T.-S., Hayashi, M., Kobayashi, N., et al. 2002, ApJ, 570, 724
- Reipurth et al. (1997) Reipurth, B., Hartigan, P., Heathcote, S., Morse, J. A., & Bally, J. 1997, AJ, 114, 757
- Reipurth & Wamsteker (1983) Reipurth, B. & Wamsteker, W. 1983, A&A, 119, 14
- Rieke & Lebofsky (1985) Rieke, G. H. & Lebofsky, M. J. 1985, ApJ, 288, 618
- Rousselot et al. (2000) Rousselot, P., Lidman, C., Cuby, J.-G., Moreels, G., & Monnet, G. 2000, A&A, 354, 1134
- Salyk et al. (2011) Salyk, C., Blake, G. A., Boogert, A. C. A., & Brown, J. M. 2011, ApJ, 743, 112
- Seifert et al. (2003) Seifert, W., Appenzeller, I., Baumeister, H., et al. 2003, in Society of Photo-Optical Instrumentation Engineers (SPIE) Conference Series, Vol. 4841, Society of Photo-Optical Instrumentation Engineers (SPIE) Conference Series, ed. M. Iye & A. F. M. Moorwood, 962–973
- Sicilia-Aguilar et al. (2012) Sicilia-Aguilar, A., Kóspál, Á., Setiawan, J., et al. 2012, A&A, 544, A93
- Staude & Neckel (1992) Staude, H. J. & Neckel, T. 1992, ApJ, 400, 556
- Straizys et al. (1992) Straizys, V., Cernis, K., Kazlauskas, A., & Meistas, E. 1992, Baltic Astronomy, 1, 149
- Takami et al. (2006) Takami, M., Chrysostomou, A., Ray, T. P., et al. 2006, ApJ, 641, 357
- Tambovtseva et al. (2001) Tambovtseva, L. V., Grinin, V. P., Rodgers, B., & Kozlova, O. V. 2001, Astronomy Reports, 45, 442
- Thé et al. (1994) Thé, P. S., de Winter, D., & Perez, M. R. 1994, A&AS, 104, 315
- Torrelles et al. (1986) Torrelles, J. M., Ho, P. T. P., Moran, J. M., Rodriguez, L. F., & Canto, J. 1986, ApJ, 307, 787
- Vorobyov (2009) Vorobyov, E. I. 2009, ApJ, 704, 715
- Walmsley et al. (2000) Walmsley, C. M., Natta, A., Oliva, E., & Testi, L. 2000, A&A, 364, 301
- Weigelt et al. (2011) Weigelt, G., Grinin, V. P., Groh, J. H., et al. 2011, A&A, 527, A103
- Wheelwright et al. (2010) Wheelwright, H. E., Oudmaijer, R. D., de Wit, W. J., et al. 2010, MNRAS, 408, 1840
- Whelan et al. (2010) Whelan, E. T., Dougados, C., Perrin, M. D., et al. 2010, ApJ, 720, L119
- Whelan et al. (2004) Whelan, E. T., Ray, T. P., & Davis, C. J. 2004, A&A, 417, 247
- Zhang & Pradhan (1995) Zhang, H. L. & Pradhan, A. K. 1995, A&A, 293, 953
| F | F | Wλ | FWHM | S/N | ID (term) | |||
|---|---|---|---|---|---|---|---|---|
| (Å) | (10-15 erg cm-2 s-1) | (Å) | (Å) | ratio | (Å) | (km s-1) | ||
| 9173.9 | 11.4 | 2.1 | 10.4 | 6.4 | 5 | Fe ii | 9175.2 | 18 |
| 9230.4 | 6.0 | 1.0 | 6.2 | 5.3 | 6 | Pa 9 | 9231.6 | 14 |
| 9261.3 | 2.3 | 0.5 | 2.1 | 3.1 | 5 | [Fe ii] () | 9270.1 | 262 |
| 9994.4 | 1.7 | 0.5 | 1.1 | 4.3 | 3 | Fe i ? | 9994.0 | 38 |
| 10000.3 | 3.2 | 0.7 | 2.1 | 3.8 | 5 | Fe ii | 10000.3 | 20 |
| 10042.7 | 5.8 | 0.9 | 1.6 | 7.2 | 6 | Pa | 10052.2 | 259 |
| 10052.4 | 15.6 | 1.0 | 8.7 | 7.7 | 16 | Pa | 10052.2 | 31 |
| 11640.5 | 3.2 | 0.3 | 1.1 | 4.3 | 11 | Fe i | 11641.5 | 0 |
| 11661.6 | 2.0 | 0.3 | 0.8 | 4.2 | 7 | C i | 11662.9 | 8 |
| 11673.6 | 2.3 | 0.5 | 0.8 | 6.6 | 5 | C i + Fe i ? | 11672.8 | 44 |
| 11692.2 | 4.9 | 0.4 | 1.8 | 5.0 | 14 | Fe i | 11693.2 | 0 |
| 11750.4 | 4.0 | 0.4 | 1.4 | 6.2 | 9 | C i | 11751.5 | 2 |
| 11756.2 | 13.0 | 0.5 | 4.4 | 7.1 | 26 | C i | 11756.6 | 14 |
| 11780.0 | 1.7 | 0.3 | 0.6 | 4.0 | 6 | C i | 11780.8 | 5 |
| 11785.4 | 5.5 | 0.4 | 1.9 | 6.1 | 13 | Fe i | 11786.5 | 3 |
| 11830.2 | 13.1 | 0.5 | 4.3 | 6.5 | 29 | Mg i | 11831.4 | 6 |
| 11840.9 | 10.7 | 0.5 | 3.5 | 6.9 | 22 | Ca ii | 11842.2 | 9 |
| 11885.1 | 14.8 | 0.5 | 4.7 | 5.7 | 32 | P ii + | 11886.1 | 1 |
| 11885.1 | Fe i | 11886.1 | 1 | |||||
| 11894.9 | 1.5 | 0.4 | 0.7 | 6.3 | 4 | C i | 11896.2 | 7 |
| 11897.5 | 2.1 | 0.4 | 1.1 | 6.7 | 5 | C i | 11899.0 | 13 |
| 11952.2 | 6.9 | 0.5 | 2.1 | 5.9 | 13 | Ca ii | 11953.0 | 4 |
| 11975.1 | 13.9 | 0.5 | 4.4 | 5.8 | 27 | Fe i | 11976.3 | 6 |
| 11986.0 | 8.8 | 0.5 | 2.8 | 5.5 | 18 | Ca ii + | 11987.5 | 13 |
| 11986.0 | Si i | 11987.5 | 13 | |||||
| 11993.5 | 6.2 | 0.5 | 2.0 | 5.3 | 11 | Ca ii + | 11994.8 | 9 |
| 11993.5 | Si i | 11994.8 | 9 | |||||
| 12033.6 | 12.1 | 0.6 | 4.1 | 6.3 | 19 | Si i | 12034.8 | 5 |
| 12085.9 | 5.2 | 0.6 | 1.6 | 5.8 | 9 | Mg i | 12086.6 | 8 |
| 12105.7 | 4.2 | 0.5 | 1.3 | 5.2 | 8 | Si i | 12106.9 | 4 |
| 12272.9 | 6.4 | 0.4 | 1.8 | 6.7 | 16 | Si i | 12274.1 | 3 |
| 12558.2 | 16.6 | 0.2 | 4.4 | 4.0 | 67 | [Fe ii] () | 12570.2 | 263 |
| 12565.2 | 9.9 | 0.3 | 3.0 | 6.8 | 23 | [Fe ii] () | 12570.2 | 96 |
| 12570.9 | 3.7 | 0.4 | 1.5 | 7.0 | 13 | [Fe ii] () | 12570.2 | 40 |
| 12575.9 | 7.0 | 0.2 | 1.8 | 3.4 | 34 | [Fe ii] () | 12570.2 | 160 |
| 12616.9 | 2.2 | 0.4 | 0.6 | 6.9 | 5 | C i | 12617.6 | 9 |
| 12694.6 | 2.0 | 0.3 | 0.5 | 3.3 | 7 | Si i ? | 12694.2 | 32 |
| Al i ? | 12695.0 | 15 | ||||||
| 12779.0 | 1.9 | 0.3 | 0.5 | 3.1 | 7 | [Fe ii] () | 12791.3 | 263 |
| 12785.9 | 1.1 | 0.2 | 0.3 | 4.3 | 5 | [Fe ii] () | 12791.3 | 101 |
| 12796.8 | 1.7 | 0.5 | 0.4 | 5.3 | 4 | [Fe ii] () | 12791.3 | 154 |
| 12808.7 | 4.4 | 0.2 | 1.0 | 4.1 | 20 | Pa | 12821.7 | 279 |
| 12821.7 | 113.0 | 0.8 | 26.8 | 9.4 | 134 | Pa | 12821.7 | 25 |
| 12933.8 | 3.4 | 0.5 | 1.0 | 4.3 | 6 | [Fe ii] () | 12946.2 | 263 |
| 13125.6 | 5.5 | 0.6 | 1.7 | 5.0 | 9 | Al i | 13127.0 | 7 |
| 15441.6 | 16.5 | 1.1 | 4.0 | 12.3 | 15 | Br 17 + ? | 15443.2 | 6 |
| 15559.0 | 24.0 | 1.0 | 4.5 | 11.1 | 24 | Br 16 | 15560.8 | 9 |
| 15624.3 | 3.7 | 1.0 | 1 | 7.5 | 4 | ? | ||
| 15703.1 | 24.0 | 1.0 | 4.5 | 10.7 | 25 | Br 15 | 15705.0 | 12 |
| 15742.2 | 1.9 | 0.5 | 0.6 | 5.4 | 4 | Mg i | 15745.0 | 29 |
| 15750.2 | 10.5 | 1.0 | 3.1 | 11.5 | 10 | Mg i + ? | 15753.2 | 32 |
| 15769.5 | 18.0 | 0.8 | 3.0 | 8.6 | 23 | Mg i + ? | 15770.0 | 15 |
| 15883.0 | 38.0 | 1.3 | 7.0 | 11.0 | 29 | Br 14 | 15885.0 | 12 |
| 15889.5 | 42.0 | 1.3 | 7.0 | 11.0 | 32 | Mg i | 15890.6 | 4 |
| 15961.4 | 3.3 | 0.7 | 0.6 | 5.6 | 5 | Si i + ? | 15964.0 | 25 |
| 15965.8 | 3.6 | 0.7 | 0.6 | 5.8 | 5 | Fe i | 15966.9 | 4 |
| 15983.3 | 6.3 | 0.8 | 1.0 | 7.0 | 8 | [Fe ii] () | 15999.1 | 272 |
| 16007.1 | 5.3 | 0.7 | 0.9 | 5.9 | 7 | [Fe ii] () | 15999.1 | 175 |
| 16111.6 | 41.3 | 1.4 | 6.7 | 11.6 | 30 | Br 13 | 16113.8 | 16 |
| 16382.3 | 5.4 | 0.8 | 0.8 | 6.5 | 7 | Si i + Fe i | 16382.7 | 15 |
| 16409.3 | 55.1 | 1.5 | 8.4 | 9.3 | 30 | Br 12 | 16411.7 | 20 |
| 16424.1 | 21.1 | 0.8 | 3.1 | 6.0 | 27 | [Fe ii] () | 16440.0 | 265 |
| 16433.2 | 14.6 | 0.9 | 2.1 | 10.0 | 8 | [Fe ii] () | 16440.0 | 99 |
| 16442.0 | 7.5 | 0.6 | 1.1 | 10.0 | 5 | [Fe ii] () | 16440.0 | 61 |
| 16447.7 | 13.4 | 0.5 | 2.4 | 4.5 | 28 | [Fe ii] () | 16440.0 | 165 |
| 16626.0 | 2.4 | 0.6 | 0.3 | 4.8 | 4 | [Fe ii] () | 16642.2 | 267 |
| 16757.3 | 4.8 | 0.6 | 0.7 | 4.8 | 8 | [Fe ii] () | 16773.3 | 262 |
| 16781.3 | 4.3 | 0.8 | 0.7 | 7.0 | 5 | [Fe ii] () | 16773.3 | 167 |
| 16808.9 | 62.0 | 1.4 | 8.4 | 11.4 | 45 | Br 11 | 16811.2 | 16 |
| 16875.8 | 6.2 | 1.3 | 0.9 | 8.5 | 5 | Fe ii | 16877.8 | 11 |
| 16893.4 | 18.3 | 1.3 | 2.5 | 9.0 | 15 | C i | 16895.0 | 4 |
| 17111.7 | 25.4 | 1.4 | 3.5 | 9.8 | 19 | Mg i | 17113.3 | 4 |
| 17327.6 | 5.4 | 1.2 | 0.9 | 8.6 | 5 | ? | ||
| 17337.5 | 4.4 | 1.6 | 0.7 | 11.5 | 3 | Fe ii | ||
| 17344.5 | 6.0 | 1.9 | 1.2 | 13.5 | 3 | Na i | 17345.8 | 2 |
| 17364.3 | 85.4 | 1.8 | 10.6 | 12.8 | 48 | Br 10 | 17366.9 | 21 |
| 17406.5 | 12.0 | 1.2 | 1.7 | 8.7 | 10 | Fe i + ? | 17406.9 | 17 |
| 21215.6 | 12.6 | 1.8 | 1.5 | 7.4 | 9 | H2 (1–0 S(1)) | 21218.3 | 13 |
| 21658.1 | 193.0 | 3.0 | 16.6 | 15.5 | 66 | Br | 21661.3 | 20 |
| 22061.0 | 25.6 | 2.2 | 2.1 | 11.2 | 11 | Na i | 22062.4 | 6 |
| 22087.4 | 21.8 | 1.6 | 1.8 | 8.2 | 13 | Na i | 22089.7 | 7 |
| 22711.8 | 18.8 | 3.6 | 1.5 | 16.2 | 5 | ? | ||
| 22937.2 | 267.0 | 3.6 | 5 | CO (2-0) | 22935.0 | 53 | ||
| 23235.0 | 200.0 | 3.6 | 19.0 | 41.0 | 5 | CO (3-1) | 23227.0 | 128 |