SOAR Adaptive Optics Observations of the Globular Cluster NGC 6496
Abstract
We present high–quality photometric data in the field of globular cluster NGC 6496 obtained with the SOAR Telescope Adaptive Module (SAM). Our observations were collected as part of the ongoing SAM commissioning. The distance modulus and cluster color excess as found from the red clump is mag and mag. An age of Gyr is determined from the difference in magnitude between the red clump and the subgiant branch. These parameters are in excellent agreement with the values derived from isochrone fitting. From the color-magnitude diagram we find a metallicity of dex and hence support a disk classification for NGC 6496. The complete data set for NGC 6469 is made available in the electronic edition of the Journal.
Subject headings:
globular clusters: general — globular clusters: individual (NGC 6496) — technique: photometric1. Introduction
The metal-rich globular cluster (GC) NGC 6496 is located at , and Galactic coordinates of , . The compilation by Harris (1996) gives the following distances: kpc from the Sun, kpc from the Galactic center and kpc below the Galactic plane.
The first color-magnitude diagram (CMD) of NGC 6496 was published by Armandroff (1988), reaching mag below the level of its horizontal branch (HB). The cluster harbors a prominent red clump (RC), and its slight tilt was later interpreted to be the result of differential reddening across the cluster (Olsen, 1999). Indeed, the reddening maps of Schlegel et al. (1998)in this region give a range of from to mag.
The fundamental parameters that describe NGC 6496 have a considerable range in the literature. Zinn & West (1984) derived a metallicity of dex and a reddening of mag. From Washington photometry, Friel & Geisler (1991) deduced a much larger reddening of mag and a metallicity of dex, noting that increasing the reddening to mag would result in dex, a metallicity in better agreement with the estimates based on CMD features. In a study of six metal–rich GCs, Sarajedini & Norris (1994) present and photometry for the red giant branch (RGB) and the HB region of NGC 6496, finding dex and mag from the cluster’s RGB color and slope. From new photometry, Richtler et al. (1994) use isochrones to obtain dex, mag, assuming a distance modulus mag and an age of Gyr. Recently, Pulone et al. (2003) used Hubble Space Telescope (HST) observations with the F606W and F814W filters to determine a metal content of [M/H]=–0.5, or dex, mag, a distance modulus of mag and an age of Gyr, from isochrone fitting.
The lack of consensus is not only confined to the cluster’s metallicity, extinction, and distance. Its classification as a disk or halo cluster is also uncertain. Although originally NGC 6496 was believed to be a member of the GC disk system, its inclination was found by Richtler et al. (1994) to be abnormally large for a disk cluster. A recent comparison of the shape of the NGC 6496 and 47 Tuc main sequence (MS) suggests that the NGC 6496 is more metal-rich than what Richtler et al. (1994) adopted, making it extremely unlikely that NGC 6496 is a halo object (Pulone et al., 2003). Unfortunately, the MS comparison stops before the main sequence turnoff (MSTO) which is a particularly critical region to constrain theoretical isochrones, because the photometry of 47 Tuc is saturated there.
In this paper we present results of observations of NGC 6496 using the SOAR Adaptive Module (SAM) installed at the 4.1ṁ SOAR111 Based on observations obtained at the Southern Astrophysical Research (SOAR) telescope, which is a joint project of the Ministério da Ciência, Tecnologia, e Inovação (MCTI) da República Federativa do Brasil, the U.S. National Optical Astronomy Observatory (NOAO), the University of North Carolina at Chapel Hill (UNC), and Michigan State University (MSU). telescope at Cerro Pachón (Chile). These observations extend several magnitudes below the MSTO region, allowing new CMDs to be constructed and interpreted.
The next sections are organized as follows: in Section 2 we describe SAM. Sections 3 and 4 describe the observations and the data reduction procedure. The color–magnitude diagrams and derivations of the fundamental cluster parameters are presented in Section 5. Finally, Section 6 summarizes our main conclusions.
2. Instrument
The SOAR Adaptive Module (SAM) improves image quality by partial correction of turbulence near the ground (Tokovinin et al., 2010, 2012). Ultraviolet light from a pulsed laser scattered by air molecules is used to create the laser guide star (LGS) and to measure wavefront distortion with a 1010 Shack-Hartmann sensor. The distortion is compensated by a 60-element curvature deformable mirror (DM) inside the re-imaging optics of SAM which projects the uncompensated input focal plane of the telescope to the compensated focus of science instruments, with the same scale. The SAM re-imaging system has substantial distortion, typical of optical relays with two off-axis parabolic mirrors. The UV laser light shortward of 370 nm is separated from the science beam by a dichroic. Tip-tilt guiding is provided by two probes in the input (uncorrected) focal plane, using stars outside the main field and compensating tilts with the SOAR fast tertiary mirror.
The SAM can feed corrected images either to a visitor instrument (e.g. the high-resolution camera, see Tokovinin et al., 2010) or to the internal wide-field optical imager, SAMI. SAMI contains a single CCD with 40964112 square pixels of 15 m size from e2v. The pixel scale is 45.4 mas and the total field of view is 186 across. The CCD is operated with the SDSU-III controller which reads the full unbinned chip in 10 s with a noise of 3.8 electrons (without patterns) and a gain of 2.1 . SAMI is equipped with standard Bessell filters and the H filter with 655.9/64 nm pass-band.
3. Observations
Observations were taken as part of SAM engineering tests, and a log of the observations is given in Table 1. The loop was closed and opened several times with the tip-tilt guiding always on to characterize the resolution gain of SAM. As the focus in closed loop (CL) was accurately determined, focusing in open loop (OL) was easily done by measuring focus with the LGS. The flatness of the DM in OL was assured by its calibration which accounts for variable gravity. Therefore, the delivered image quality (DIQ) in OL was not degraded by the SAM optics or defocus. Data was taken without binning to increase the dynamic range of the CCD.
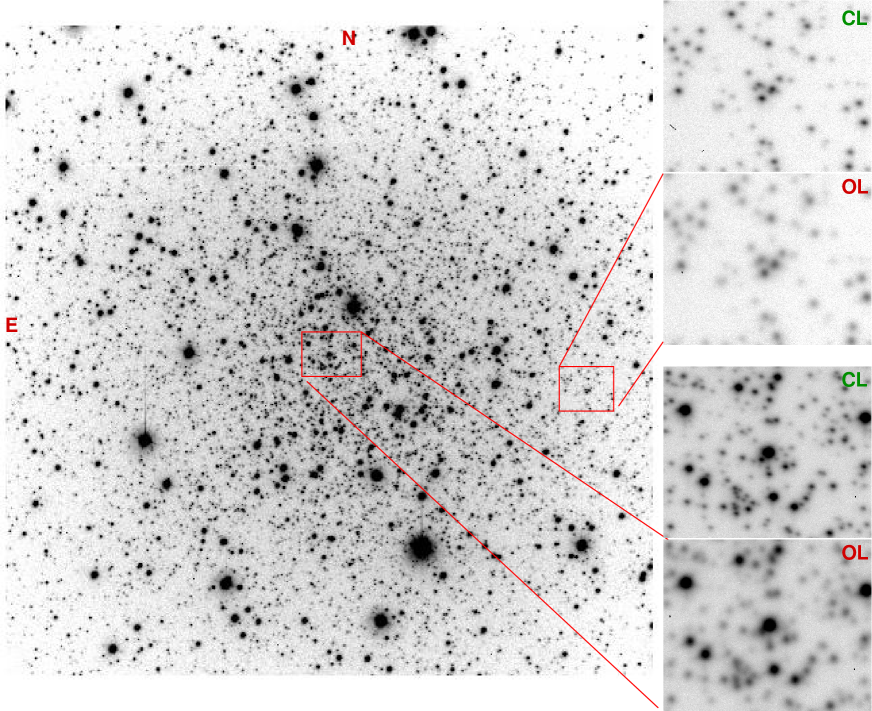
The improvement in the DIQ from the use of SAM depends on the strength of uncompensated turbulence in the upper atmosphere (above a few kilometers). From the excellent and stable seeing in OL we infer that the atmospheric turbulence was weak, but likely variable. In future observations, the site monitor at Cerro Pachón will provide an estimate of the sky conditions (this monitor was not working during our observations). SAM provided a substantial improvement of the DIQ in CL, especially at longer wavelengths. The typical FWHM of stellar images in CL/OL condition (averaged over the field) was 0.48/0.59 in , 0.43/0.66 in , 0.32/0.54 in , and 0.31/0.50 in . This improvement is further illustrated in Figure 1. Here PSF photometry is performed in two OL and CL images, as well as in two CL images. The consistency in the magnitudes is worse when introducing OL photometry, likely due to a greater number of unresolved stellar blends in the OL image. The photometry of central stars in NGC 6496 can be obtained to greater accuracy when using SAM. Similarly, fainter magnitudes can be reached with a more strongly peaked point-spread function (PSF) in CL, resulting in a deeper photometry at a given exposure time.
The images of NGC 6496 in CL show a trend of the DIQ in the East-West direction. In the worst case, the FWHM in the band varies from in the western side of the image to in its eastern side. We believe this trend originates from a combination of two effects: guiding with only one probe and a delay in high-order compensation which displaces the best correction from the field center. The sharpest stars with the smallest PSF are located closest to the guiding probe; when guiding with two probes, the DIQ gradient is less steep.

| Target | Date | Filter | Exposure (sec) | airmass |
|---|---|---|---|---|
| NGC 6496 | 2012 May 08 | B | 1x120 | 1.08 |
| Closed loop | V | 2x120, 1x300 | 1.071.14 | |
| R | 2x120 | 1.071.09 | ||
| I | 6x120, 2x300 | 1.071.19 | ||
| PG 1633 | 2012 June 06 | B | 5x40 | 1.751.78 |
| Open loop | V | 5x20 | 1.791.81 | |
| R | 5x15 | 1.731.71 | ||
| I | 5x10 | 1.741.73 | ||
| PG 1323 | 2012 June 06 | B | 5x30 | 1.08 |
| Open loop | V | 5x15 | 1.08 | |
| R | 5x10 | 1.08 | ||
| I | 5x7 | 1.08 | ||
| SA 107 | 2012 June 06 | B | 5x30 | 1.33 |
| Open loop | V | 5x20 | 1.361.37 | |
| R | 5x15 | 1.35 | ||
| I | 5x10 | 1.34 |
4. Data Reduction & Calibrations
The CCD data frames were reduced in the standard manner using the mosaic reduction (MSCRED) package in IRAF222IRAF is distributed by the National Optical Astronomy Observatories, which are operated by the Association of Universities for Research in Astronomy, Inc., under cooperative agreement with the National Science Foundation. (Valdes, 1998; Valdes & Tody, 1998). The data reduction process includes bias subtraction, flat-fielding, and cosmic-ray cleaning.
4.1. Astrometric calibration
The astrometric solutions were derived using the IRAF task ccmap and a tangent-plane projection with a third order polynomial (TNX projection) was used to model the image distortions present in SAMI. About 150 stars from the 2MASS All-Sky Point Source Catalogue (Cutri et al., 2003) were used as astrometric reference. The typical astrometric accuracy of an individual SAMI science frame is better than 45 mas (or 1 pixel) in both right ascension and declination.
4.2. PSF-Fitting Photometry
Instrumental magnitudes were determined from PSF-fitting photometry on individual frames using daophot II and the task allstars (Stetson, 1987, 1992) under IRAF. We selected 80-100 unsaturated and isolated bright stars as PSF-reference stars and used the Moffat () function to model the PSF. These same stars were then also used to determine an aperture correction for each image. We define an aperture that encompasses the range of FWHMs resulting from the trend in the DIQ mentioned in Section 3, and also allow the PSF parameters to vary quadratically across the field of view. In this way the typical normalized scatter of the PSF fits is less than 2.5% .
4.3. Photometric calibration
| ID | RA (J2000) | DEC (J200) | ||||||||||
|---|---|---|---|---|---|---|---|---|---|---|---|---|
| [h m s] | [] | [mag] | [mag] | [mag] | [mag ] | [mag] | [mag] | [mag] | [mag] | [mag] | [mag] | |
| ⋮ | ⋮ | ⋮ | ⋮ | ⋮ | ⋮ | ⋮ | ⋮ | ⋮ | ⋮ | ⋮ | ⋮ | ⋮ |
| 1201 | 17:58:59.41 | -44:14:51.4 | 17.479 | 0.004 | 16.405 | 0.002 | 0.007 | 15.812 | 0.001 | 15.216 | 0.002 | 0.009 |
| 1202 | 17:59:02.59 | -44:15:40.0 | 17.491 | 0.005 | 16.402 | 0.003 | 0.011 | 15.794 | 0.003 | 15.214 | 0.004 | 0.003 |
| 1203 | 17:59:02.72 | -44:15:09.2 | 17.492 | 0.004 | 16.234 | 0.002 | 0.006 | 15.546 | 0.002 | 14.879 | 0.001 | 0.008 |
| 1204 | 17:59:06.08 | -44:16:46.3 | 17.494 | 0.004 | 16.390 | 0.002 | 0.008 | 15.795 | 0.002 | 15.204 | 0.002 | 0.008 |
| 1205 | 17:59:07.66 | -44:16:57.9 | 17.495 | 0.004 | 16.417 | 0.002 | 0.008 | 15.832 | 0.002 | 15.255 | 0.002 | 0.010 |
| 1206 | 17:59:09.49 | -44:16:40.4 | 17.500 | 0.004 | 16.387 | 0.002 | 0.007 | 15.797 | 0.001 | 15.203 | 0.001 | 0.008 |
| 1207 | 17:59:01.72 | -44:15:14.8 | 17.503 | 0.004 | 16.431 | 0.002 | 0.009 | 15.850 | 0.001 | 15.254 | 0.001 | 0.008 |
| ⋮ | ⋮ | ⋮ | ⋮ | ⋮ | ⋮ | ⋮ | ⋮ | ⋮ | ⋮ | ⋮ |
Note: The full version of this table is available in the electronic edition or from the authors by request.
In order to transform instrumental magnitudes and colors into the standard system, calibration images were obtained with SAMI (in OL) under photometric conditions during the night of 2012 June 6 (see Table 1). The zeropoint, color terms, and extinction were then determined using the IRAF package photcal through a uniformly weighted fit of the following transformation equations:
,
,
,
,
where , , , and are the magnitudes in the standard system, , , , and are the instrumental magnitudes, corrected to the exposure time of 1 s using a zero point of 25.0 mag, and is the air-mass at the time of the observations. The r.m.s. deviations from the fits were 0.013, 0.013, 0.010 and 0.018 mag in , and , respectively.
We used the above photometric calibration to transform the NGC 6496 instrumental magnitudes into the standard system for the passbands. However, given that the standard stars were not observed on the same night as our observations of NGC 6496, the zero points were adjusted from the Stetson (2000) Standard Fields found in the images 333http://www3.cadc-ccda.hia-iha.nrc-cnrc.gc.ca/community/. In the passbands, eight Stetson standards are in common with stars in our field, and seven stars are in common with Stetson standards in the passband. The mean difference, in the sense of this work minus that of Stetson (2000), are as follows: , , ,, , . In this way, the above values were used to adjust the zero points in filters. This accounts for potential small differences in the extinction coefficients between our observations of object and standards. Apart from the zero points differences, no significant color trends was found. Since Stetson (2000) do not include photometry in the field of NGC 6496, our zero point might be off by few per cent.
Our photometry as obtained from SAM and transformed to the standard system described above is presented in Table 2. Our observations include 7416 stars in the passbands. The uncertainties in the passbands are formal errors from the PSF fitting, while the uncertainties in the passbands are the rms frame-to-frame variations. The formal errors from the PSF fitting and the frame-to-frame differ by a factor 2-3, but indicate that for the most part, our photometry is accurate at the 1% level until 19.0 mag. The errors listed do not include those from the standard star transformations.
5. Analysis and Results
5.1. Color-Magnitude Diagram
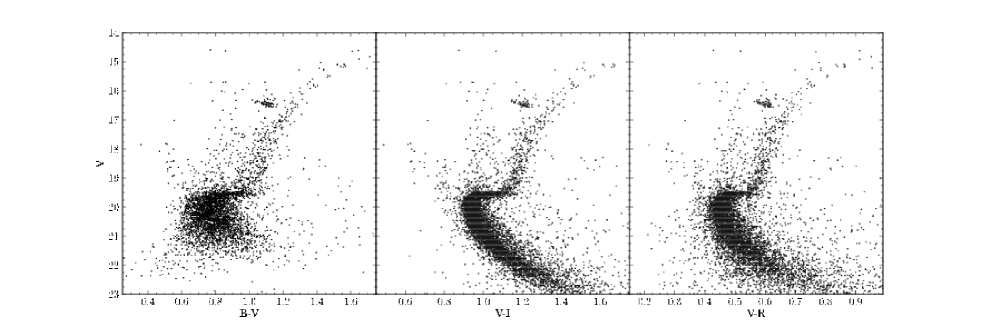
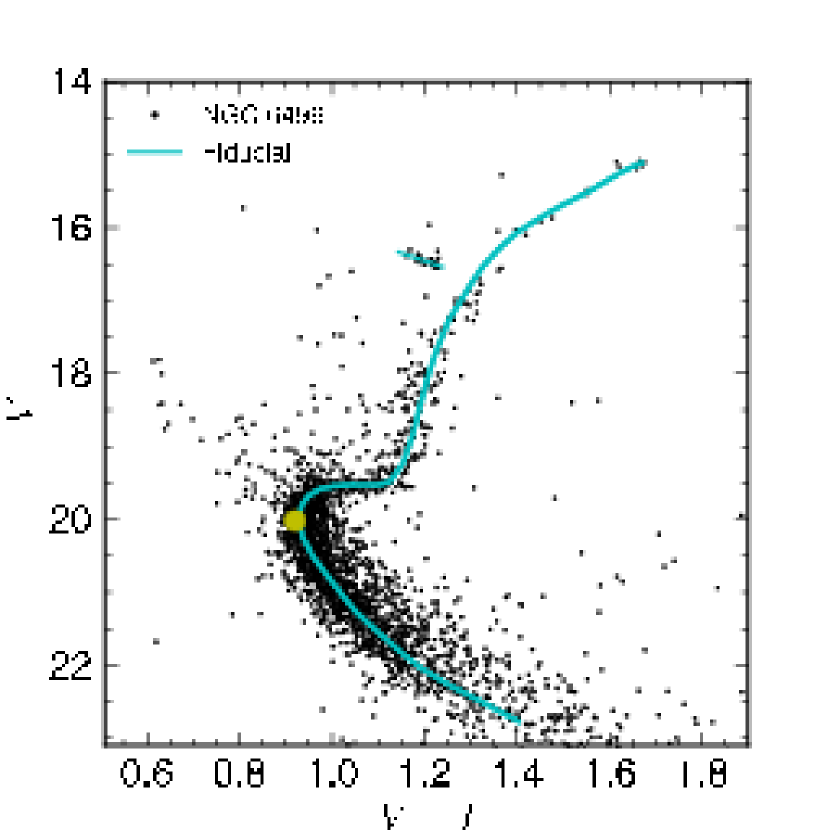
Figure 3 presents the CMDs with three different color baselines in a field approximately centered on NGC 6496. The deepest exposures were obtained in the filters, for that reason, the subsequent analysis will focus on the photometry data from those filters. Figure 4 shows the [] CMD for all stars within a radius of 90 from the center of NGC 6496. The location of the cluster center on the CCD was estimated from the peak position of the distribution of stars in the x- and y-directions. The (x,y)-coordinates were transformed to right ascension and declination and found to be , , in excellent agreement with , published in Goldsbury et al. (2010).
The solid line (cyan) in the Figure 4 represents the adopted mean ridge line tracing the evolutionary features of the cluster. The ridge line has been derived separately for the MS, SGB and RGB. For the MS and the RGB, a set of preliminary fiducial points separated by 0.25 mag in was determined by eye and then refined by averaging the color distribution of all stars with color less than 0.025 mag. Similarly, for the SGB region ( mag) the preliminary points were spaced by 0.025 mag in and then refined by averaging the magnitude distribution of all stars with 0.25 mag from the preliminary points. A linear fit was used to determine the HB fiducial line.
The apparent magnitude of the MSTO, the bluest point along the MS, was estimated by fitting a third order polynomial to the mean ridge line in the range of mag. This magnitude range encompasses a generous area with which to determine the MSTO (see Figure 4). This yielded a turnoff apparent magnitude of and color of , marked with a circle (yellow) in the same figure. This value is slightly brighter than the reported by Richtler et al. (1994) and subsequently supported by Pulone et al. (2003). The large photometric errors in the Richtler et al. (1994) CMD below the turn-off may be one reason for our discrepancy.
The apparent magnitude of the SGB, , is obtained by using the mean magnitude of the stars in a box centered at mag, as discussed by (Chaboyer et al., 1996). Our adopted box size is 0.04 mag in and 0.15 mag in ; these parameters were determined from the above mentioned polynomial fit and encompasses the SGB well. A is obtained, and will be used later (in §5.2) as an age indicator.
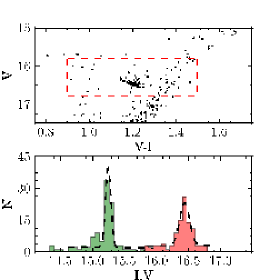
The horizontal branch ”red clump” (RC, Cannon, 1970) is clearly distinguished as a clump of red stars near the RGB. Red clumps are common in CMDs of intermediate-age (1–10 Gyr) or very old (10 Gyr) clusters with metal-rich stellar populations (e.g., Alves & Sarajedini, 1999). The top panel of Figure 5 displays a zoom-in of the RC region of NGC 6496. The dashed (red) rectangle spanning and encloses 103 stars selected to estimate the apparent magnitude of the RC. The histograms in the bottom panel in Figure 5 show the and apparent magnitude distribution of those stars. The dashed lines represent the result of a non-linear least-squares fit of the function
| (1) |
to each distribution, as suggested by Stanek & Garnavich (1998). The apparent magnitude of the RC and its associated standard error in both and photometric bands were determined to be and . The value is identical to that derived by Sarajedini & Norris (1994, ), and it is between the values reported by Richtler et al. (1994, ) and Armandroff (1988, ), respectively.
5.2. Age, distance and reddening from the RC
We estimate here the age of NGC 6496 using the difference in magnitude between and , = (Chaboyer et al., 1996, 2000). This method is also known as the ’vertical method’ and relies on the fact that the absolute brightness of the RC () remains nearly constant for ages older than 9 Gyr (Girardi & Salaris, 2001), while the absolute magnitude of the SGB depends on the age of the cluster. The absolute magnitude of the SGB as a function of age was obtained for two values of metallicity ( and , adopting [) using the Yonsei–Yale (Demarque et al., 2004, Y2) isochrones. The adopted value for the was taken from Alves et al. (2002), who has estimated the absolute magnitude of the red clump stars for the local stellar population with Hipparcos parallaxes. Population corrections from Girardi & Salaris (2001) indicate that would be negligible for an age and metal content representative of NGC 6496 with the being affected by 0.02 mag at the most (e.g. assuming an age of 10.5 Gyr and Z=0.004). Therefore the observed value for , which corresponds to an age of Gyr. This is in excellent agreement with the age reported in Pulone et al. (2003, age = 10 Gyr).
We next obtain the distance and reddening to NGC 6496 following the method described in Salaris (2012). Using an absolute magnitude for the RC of and the intrinsic RC color of , the color excess was estimated to be mag. Adopting , and (Schlegel et al., 1998), the following quantities are derived: , , and . The true distance modulus has been evaluated using the equation , for both and photometric bands. We find mag, which corresponds to a distance of kpc. The reddening and the distance derived above agree, within the errors, with the published values from Sarajedini & Norris (1994, ), Richtler et al. (1994, and ) and Pulone et al. (2003, and ). Table 3 shows a complete list of the parameters determined from our RC analysis.
| Parameter | Value | ||
|---|---|---|---|
| 16.44 | 0.07 | mag | |
| 15.24 | 0.03 | mag | |
| 20.02 | 0.04 | mag | |
| 0.92 | 0.02 | mag | |
| 19.61 | 0.02 | mag | |
| 15.71 | 0.02 | mag | |
| 0.28 | 0.02 | mag | |
| 10.5 | 0.5 | Gyr | |
| 15.0 | 0.03 | mag | |
| 10.0 | 0.1 | kpc |
5.3. Isochrone Fitting
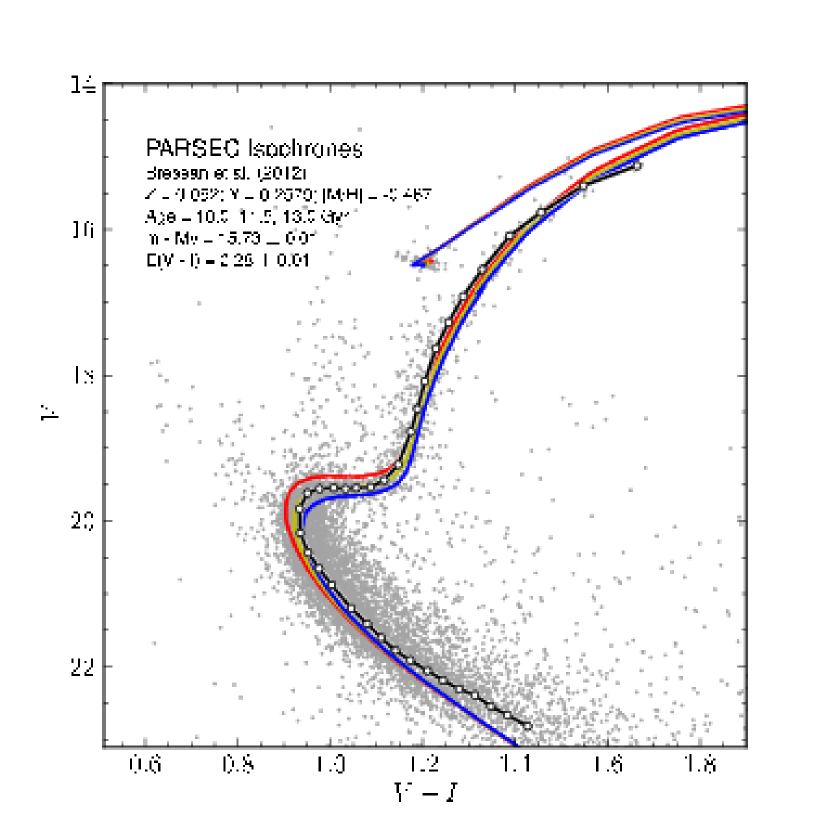
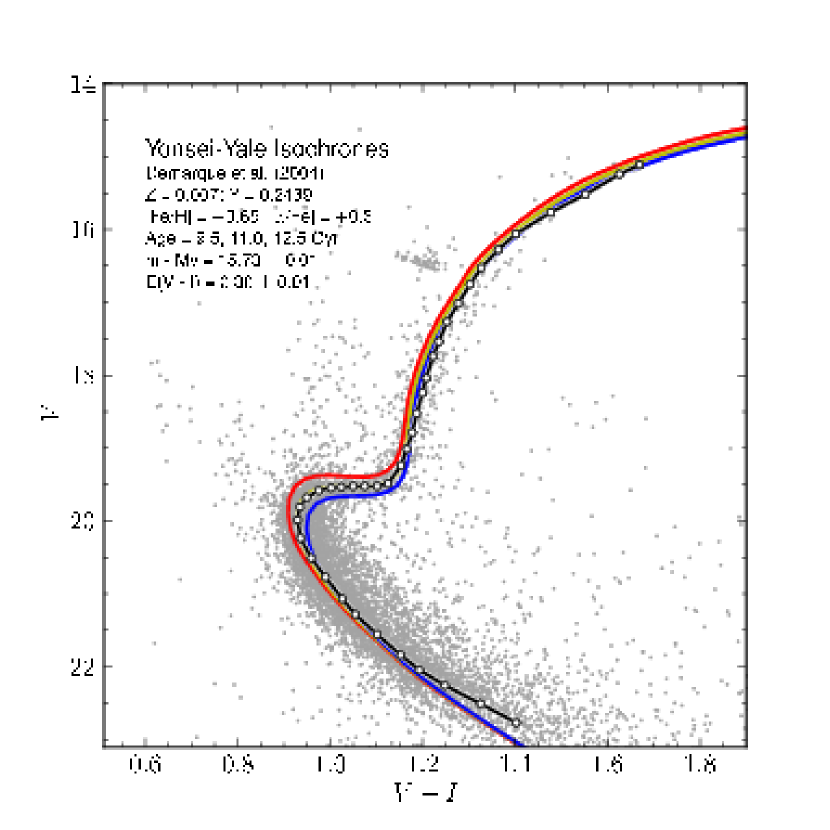
Theoretical isochrones from PARSEC (PAdova and TRieste Stellar Evolution Code, Bressan et al. 2012) and from Y2 (Yonsei–Yale, Demarque et al. 2004) were fitted to the observed [] CMD to further investigate the reddening, distance, metallicity, and the age of NGC 6496. As a preliminary step, we adopt the distance and reddening determined in the previous subsection (see Table 3). Next the best-fit isochrone was found by slightly varying the distance, reddening, metallicity and age. The left panel of Figure 6 shows the best-fit to the PARSEC isochrones obtained with an age of Gyr, an apparent distance modulus of , a color excess of and a metal content of ( assuming , Paust et al. 2010). The right panel in Figure 6 displays the best-fit to the Y2 isochrones using an age of Gyr, an apparent distance modulus of , a color excess of and a metallicity of ().The distance () derived from the PARSEC and Y2 isochrones fitting, adopting and , were determined to be kpc and kpc, respectively. The above values are in general consistent with the values derived from the RC analysis. Table 4 summarizes our results from the isochrone fitting.
Although the best fit to the RGB from the PARSEC isochrones matches the lower RGB and upper RGB well, the middle part of the RGB is not matched as well. We were unable to find a value for Z that better represented the RGB for NGC 6496, however. In contrast, the best fit Y2 isochrones matches the RGB well. The isochrones also do not match the lower MS very well. It has been observed previously that the theoretical isochrones are fainter in the lower MS than observed (e.g., Yi et al., 2001; An et al., 2009). For the Y2 isochrones, for example, Demarque et al. (2004) acknowledge that their isochrones may not be very impressive for fitting the lower MS CMDs. One reason for this may be because in low-mass MS stars, one finds a convective envelope and, thus, uncertainties about superadiabatic convection (see e.g. Castellani et al., 1999).
| Models | ||
|---|---|---|
| Parameter | PARSEC | Yonsei–Yale |
| 15.73 0.02 mag | 15.73 0.02 mag | |
| 0.28 0.01 mag | 0.30 0.01 mag | |
| 11.5 0.5 Gyr | 11.0 0.5 Gyr | |
| 0.67 0.05 dex | 0.65 0.05 dex | |
| 15.02 0.02 mag | 14.97 0.02 mag | |
| 10.1 0.1 kpc | 9.8 0.1 kpc | |
5.4. Comparison with other GCs
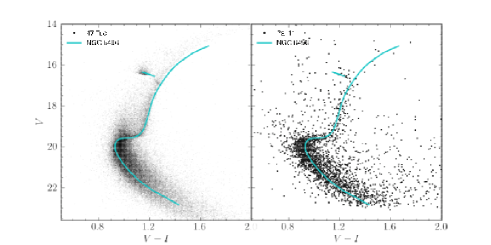
47 Tucanae and Palomar 11 are two metal-rich GCs that can be compared with NGC 6496. The photometric data sets of 47 Tuc and Pal 11 used here are taken from Bergbusch & Stetson (2009) and Lewis et al. (2006), respectively. The fundamental parameters of 47 Tuc listed by Bergbusch & Stetson (2009) are: age = 12 Gyr, , and . While Lewis et al. (2006) reported the following values for Pal 11: age = 10.5 Gyr, , and . Figure 7 shows the [] CMDs of 47 Tuc and Pal 11 along with the fiducial ridge-line of NGC 6496 (solid cyan line) superimposed on both CMDs. For the comparison, the CMD of 47 Tuc is shifted in color by and in magnitude by to match the fiducial lines of NGC 6496. Similarly, the Pal 11 CMD is shifted by and . The applied shifts are in good agreement, within the errors, with the values determined for the apparent distance modulus and color of NGC 6496. For both clusters the SGBs and the RCs overlap remarkably well with the NGC 6496 fiducial lines, suggesting these cluster are similar in age. The Pal 11 RGB overlaps remarkably well with the RGB of NGC 6496, suggesting that both clusters have similar metallicities. On the other hand, 47 Tuc has a RGB that is slightly bluer than that of NGC 6496. This suggests that NGC 6496 is more metal-rich than 47 Tuc, which again is supported by our isochrone fitting.
Lastly, Pal 11 and the thick-disk GC NGC 5927 have similar CMDs (Lewis et al., 2006), and hence NGC 5927 is similar to NGC 6496 as well. Unlike Pal 11, NGC 5927 has a spectroscopic Fe measurement based on Fe II lies of dex (Kraft & Ivans, 2003), and we note that this metallicity is in excellent agreement with the derived for NGC 6496 from theoretical isochrones (see Table 4). Therefore an intermediate metal content for this cluster, as suggested by Richtler et al. (1994), is inconsistent with our observational and theoretical results. We find no need to classify NGC 6496 as a halo object and support its classification as a disk cluster, in agreement with Pulone et al. (2003).
6. Concluding remarks
The SOAR 4.1m Telescope Adaptive Module (SAM) has been used to obtain photometric data in the field of NGC 6496. The main results of this paper can be summarized as follows:
-
1.
The distance modulus of mag and a reddening of mag has been estimated using the apparent magnitude of the RC and following the method described by Salaris (2012). After correcting for extinction, a true distance modulus of mag has been derived, which corresponds to a distance of kpc.
-
2.
The age of NGC 6496 has been estimated to be Gyr, using the magnitude difference between and together with the models of Yonsei–Yale and the absolute magnitude of the red clump stars for the local stellar population taken from Alves et al. (2002).
-
3.
Theoretical isochrones from PARSEC and from Yonsei–Yale were fitted to the observed [] CMD of NGC 6496. The resulting parameters derived from the isochrone fits (see Table 4) are in excellent agreement with our results from the RC analysis. The metallicity estimates from both models are very similar, dex (adopting ).
-
4.
A comparison of the NGC 6496 CMD with 47 Tuc and Pal 11 CMDs suggests the classification of NGC 6496 as a disk cluster, in agreement with Pulone et al. (2003).
References
- Alves et al. (2002) Alves, D. R., Rejkuba, M., Minniti, D., & Cook, K. H. 2002, ApJ, 573, L51
- Alves & Sarajedini (1999) Alves, D. R., & Sarajedini, A. 1999, ApJ, 511, 225
- An et al. (2009) An, D., Pinsonneault, M. H., Masseron, T., et al. 2009, ApJ, 700, 523
- Armandroff (1988) Armandroff, T. E. 1988, AJ, 96, 588
- Bergbusch & Stetson (2009) Bergbusch, P. A., & Stetson, P. B. 2009, AJ, 138, 1455
- Bressan et al. (2012) Bressan, A., Marigo, P., Girardi, L., et al. 2012, MNRAS, 427, 127
- Cannon (1970) Cannon, R. D. 1970, MNRAS, 150, 111
- Castellani et al. (1999) Castellani, V., degl’Innocenti, S., & Marconi, M. 1999, MNRAS, 303, 265
- Chaboyer et al. (1996) Chaboyer, B., Demarque, P., Kernan, P. J., Krauss, L. M., & Sarajedini, A. 1996, MNRAS, 283, 683
- Chaboyer et al. (2000) Chaboyer, B., Sarajedini, A., & Armandroff, T. E. 2000, AJ, 120, 3102
- Cutri et al. (2003) Cutri, R. M., Skrutskie, M. F., van Dyk, S., et al. 2003, ”The IRSA 2MASS All-Sky Point Source Catalog, NASA/IPAC Infrared Science”
- Demarque et al. (2004) Demarque, P., Woo, J.-H., Kim, Y.-C., & Yi, S. K. 2004, ApJS, 155, 667
- Friel & Geisler (1991) Friel, E. D., & Geisler, D. 1991, AJ, 101, 1338
- Girardi & Salaris (2001) Girardi, L., & Salaris, M. 2001, MNRAS, 323, 109
- Goldsbury et al. (2010) Goldsbury, R., Richer, H. B., Anderson, J., et al. 2010, AJ, 140, 1830
- Harris (1996) Harris, W. E. 1996, AJ, 112, 1487
- Kraft & Ivans (2003) Kraft, R. P., & Ivans, I. I. 2003, PASP, 115, 143
- Lewis et al. (2006) Lewis, M. S., Liu, W. M., Paust, N. E. Q., & Chaboyer, B. 2006, AJ, 131, 2538
- Olsen (1999) Olsen, K. A. G. 1999, AJ, 117, 2244
- Paust et al. (2010) Paust, N. E. Q., Reid, I. N., Piotto, G., et al. 2010, AJ, 139, 476
- Pulone et al. (2003) Pulone, L., De Marchi, G., Covino, S., & Paresce, F. 2003, A&A, 399, 121
- Richtler et al. (1994) Richtler, T., Grebel, E. K., & Seggewiss, W. 1994, A&A, 290, 412
- Sarajedini & Norris (1994) Sarajedini, A., & Norris, J. E. 1994, ApJS, 93, 161
- Salaris (2012) Salaris, M. 2012, Ap&SS, 341, 65
- Stanek & Garnavich (1998) Stanek, K. Z., & Garnavich, P. M. 1998, ApJ, 503, L131
- Schlegel et al. (1998) Schlegel, D. J., Finkbeiner, D. P., & Davis, M. 1998, ApJ, 500, 525
- Stetson (1987) Stetson, P. B. 1987, PASP, 99, 191
- Stetson (2000) Stetson, P. B. 2000, PASP, 112, 925
- Tokovinin et al. (2010) Tokovinin, A., Cantarutti, R., Tighe, R., et al. 2010, PASP, 122, 1483
- Tokovinin et al. (2010) Tokovinin, A., Tighe, R., Schurter, P., et al. 2010, Proc. SPIE, 7736,
- Tokovinin et al. (2012) Tokovinin, A., Tighe, R., Schurter, P., et al. 2012, Proc. SPIE, 8447,
- Valdes (1998) Valdes, F. G. 1998, Astronomical Data Analysis Software and Systems VII, 145, 53
- Valdes & Tody (1998) Valdes, F. G., & Tody, D. 1998, Proc. SPIE, 3355, 497
- Stetson (1992) Stetson, P. B. 1992, Astronomical Data Analysis Software and Systems I, 25, 297
- Yi et al. (2001) Yi, S., Demarque, P., Kim, Y.-C., et al. 2001, ApJS, 136, 417
- Zinn & West (1984) Zinn, R., & West, M. J. 1984, ApJS, 55, 45