11email: gianfranco.gentile@ugent.be 22institutetext: Department of Physics and Astrophysics, Vrije Universiteit Brussel, Pleinlaan 2, 1050 Brussels, Belgium 33institutetext: Netherlands Institute for Radio Astronomy (ASTRON), Postbus 2, NL-7990 AA Dwingeloo, The Netherlands 44institutetext: Argelander-Institut für Astronomie, Auf dem Hügel 71, D-53121 Bonn, Germany 55institutetext: Astrophysics, Cosmology and Gravity Centre (ACGC), Astronomy Department, University of Cape Town, Private Bag X3, 7700 Rondebosch, Republic of South Africa 66institutetext: Astronomy Department, University of Bologna, Bologna, Italy 77institutetext: Kapteyn Astronomical Institute, University of Groningen, AD Groningen, the Netherlands 88institutetext: Department of Astronomy, New Mexico State University, PO Box 30001, MSC 4500, Las Cruces, NM 88003, USA
HALOGAS: Extraplanar gas in NGC 3198
We present the analysis of new, deep Hi observations of the spiral galaxy NGC 3198, as part of the HALOGAS (Westerbork Hydrogen Accretion in LOcal GAlaxieS) survey, with the main aim of investigating the presence, amount, morphology and kinematics of extraplanar gas. We present models of the Hi observations of NGC 3198: the model that matches best the observed data cube features a thick disk with a scale height of 3 kpc and an Hi mass of about 15% of the total Hi mass; this thick disk also has a decrease in rotation velocity as a function of height (lag) of 7–15 km s-1 kpc-1 (though with large uncertainties). This extraplanar gas is detected for the first time in NGC 3198. Radially, this gas appears to extend slightly beyond the actively star-forming body of the galaxy (as traced by the H emission), but it is not more radially extended than the outer, fainter parts of the stellar disk. Compared to previous studies, thanks to the improved sensitivity we trace the rotation curve out to larger radii. We model the rotation curve in the framework of MOND (Modified Newtonian Dynamics) and we confirm that, with the allowed distance range we assumed, fit quality is modest in this galaxy, but the new outer parts are explained in a satisfactory way.
Key Words.:
Galaxies: halos - Galaxies: ISM - Galaxies: kinematics and dynamics - Galaxies: individual (NGC 3198) - Galaxies: structure1 Introduction
The last couple of decades have seen a wealth of observational data revealing the presence of material outside the plane of disk galaxies (see Sancisi et al. 2008 and Putman et al. 2012 for a review), e.g. hot X-ray emitting gas (e.g. Tüllmann et al. 2006, Li et al. 2008), ionised gas (Collins & Rand 2001, Rossa & Dettmar 2003), dust (Howk & Savage 1999, Ménard et al. 2010), and neutral hydrogen (Fraternali et al. 2002; Oosterloo et al. 2007; Heald et al. 2011). This material is found to be often (but not always, in the case of the Hi) closely associated to star formation in the galaxy disk.
The galactic fountain is an example of a framework that attempts to explain the presence and properties of extraplanar gas: gas is expelled to large distances from the disk by supernova explosions and adiabatic expansion, and then it falls back onto the galaxy disk due to radiative cooling (Shapiro & Field, 1976; Bregman, 1980). For the conservation of angular momentum, there must be a decrease of the rotation velocity (also known as “lag”) with distance from the plane. However, ballistic models of the interplay between the thin disk and the extraplanar gas (e.g. Fraternali & Binney 2006) show that there must be additional mechanisms governing the kinematics of extraplanar gas, because these simple models obtain lags that are too shallow compared with observations. A possibility is the interaction between the uplifted gas and a corona of slowly-rotating hot gas, which would explain the magnitude of the observed lags (Marinacci et al. 2011). Other explanations for the properties of extraplanar gas involve e.g. thermal instabilities in the corona (Kaufmann et al. 2006, but see Binney et al. 2009), pressure gradients or the effect of the magnetic field (Benjamin 2002).
Observational evidence for extraplanar lagging Hi gas comes from both edge-on and moderately inclined galaxies. Edge-on galaxies allow us to assess the extent of this gas and the magnitude of the lag, whereas in moderately inclined galaxies one can investigate the local connection between star formation and extraplanar gas, and one can study in detail its kinematics. Observationally, in moderately inclined galaxies the very existence of the lag allows the disentangling of extraplanar gas from gas that resides in the plane, e.g. in NGC 2403 (Fraternali et al. 2002), NGC 4559 (Barbieri et al. 2005), and NGC 6946 (Boomsma et al. 2008).
In Heald et al. (2011) we presented the HALOGAS (Westerbork Hydrogen Accretion in LOcal GAlaxieS) survey, a systematic investigation of extraplanar gas in 22 spiral galaxies, using very deep Hi observations. The main goal of HALOGAS is to investigate the amount and properties of extraplanar gas. The target galaxies were selected to be nearby and to fall in one of two categories: edge-on galaxies (inclination ) and moderately-inclined galaxies (50).
NGC 3198 is one of the moderately-inclined galaxies in the HALOGAS sample. It is a late-type spiral that is traditionally considered as one of the benchmark galaxies for rotation curve studies, because its Hi kinematics is regular and symmetric, its Hi disk is very extended and its inclination angle (around 70∘) is ideal for deriving the rotation curve. Many studies have focussed partly or completely on the kinematics of NGC 3198, e.g. van Albada et al. (1985), Begeman (1989), Blais-Ouellette et al. (2001), Bottema et al. (2002), de Blok et al. (2008), Sellwood & Sánchez (2010), Gentile et al. (2011). The distance of NGC 3198 has been determined to be 13.8 Mpc using Cepheids (Kelson et al. 1999, Freedman et al. 2001, see also Macri et al. 2001), usually considered to be one of the most precise distance indicators.
In the present paper we aim to characterise the presence, amount, and kinematics of any extraplanar gas in NGC 3198, using the most sensitive Hi data available and a careful tilted-ring model based analysis. We also look for a link between the presence of this extraplanar gas and star formation in this galaxy. Additionally, we present detailed kinematic modelling of the observations, as well as a mass decomposition of the rotation curve.
2 Data acquisition and reduction
2.1 Hi data
We summarise here how the data were acquired and reduced, and we refer the reader to Heald et al. (2011) for a more thorough description of the observations and data reduction, of which we only describe the main points. Information about NGC 3198 and the observations presented here is given in Table 1.
| Parameter | Value | Reference |
|---|---|---|
| Hubbe type | Sc | 1 |
| Adopted distance | Mpc | 2 |
| B-band magnitude | 1 | |
| Synthesised beam FWHM | 35.2 33.5 arcsec | 3 |
| mJy/beam to Kelvin | 0.51 | 3 |
| On-source time | 132 hr | 3 |
| Velocity resolution | 4.12 km s-1 | 3 |
| RMS noise | 0.21 mJy beam-1 | 3 |
The observations of neutral hydrogen (Hi) were obtained at the WSRT (Westerbork Synthesis Radio Telescope) in the “maxi-short” configuration, for 10 12 hours with a bandwidth of 10 MHz divided into 1024 channels, and two linear polarizations. The data were reduced using the software package Miriad (Sault et al. 1995). After flagging, calibration and continuum subtraction, the data were Fourier inverted to obtain a data cube. When inverting, a Gaussian taper with an image-plane width of 30 arcseconds was applied to the uv-data, which were also Hanning-smoothed to a velocity resolution of 4.12 km s-1. The data cubes obtained in this manner have an rms noise of 0.21 mJy beam-1. Avoiding to apply the taper gives a higher-resolution cube (18.9 13.6 arcsec) but this cube was not used for modelling as one of the main goals of this paper is to investigate the faint diffuse emission, whose signal-to-noise ratio is higher when applying the taper and thus somewhat degrading the resolution.
The CLEAN deconvolution of the dirty cube was done in two steps: first, a CLEAN mask was defined (for every channel map) where presence of real emission can be established with confidence. In these regions the CLEAN deconvolution was performed down to approximately 1. Then, the channel maps were CLEANed on the whole field, down to about 2. Finally, the channel maps were restored using a Gaussian beam with a FHWM size of 35.2 33.5 arcsec.
2.2 Optical photometry
We obtained photometric observations of NGC 3198 within the framework of HALOSTARS, which is a deep optical survey of the HALOGAS targets with the Isaac Newton Telescope (INT). NGC 3198 was observed in the r’-band on February 4, 2010, and the total on-source time amount was 3600 s. A coadded image was obtained using the THELI 111http://www.astro.uni-bonn.de/ theli/ imaging reduction pipeline (Schirmer et al. 2003, Erben et al. 2005). After the overscan- and bias correction, the images were flat-fielded, super-flat-fielded and defringed. We also masked non-Gaussian noise-features such as cosmic rays. Using SCAMP (Bertin 2006), the resulting images were photometrically calibrated, background-subtracted and co-added, taking the sky background variation in the individual chips into account and using the 2MASS catalogue to solve for astrometric distortion and for the relative sensitivity of the chips. Using the SDSS (DR8) catalogue, we determined the zero point to be 24.67 0.02 mag. From an rms noise of 0.023 ADU/s we thus find a 1- level of 26.4 mag over 1 square arcsec. To enhance faint extended features, the image was convolved with a Gaussian with a FWHM 3 arcsec.
2.3 H imaging
The H observations of NGC 3198 were made at the Kitt Peak National Observatory (KPNO) as part of an observing run aimed at obtaining wide-field optical images of the HALOGAS sample, to investigate the relation between extraplanar gas and star formation. We observed over 4 nights in January 2012 using the Mosaic 1.1 instrument on the 4-meter telescope. We used an H filter centered at 6574.74 Å and a FWHM of 80.62 Ångstroms, which includes [NII] lines at 6548 and 6584 Å. We exposed in the 5 dither pattern with six minutes per exposure for a total of 30 minutes. R-band images (10 minutes total) were also acquired for continuum subtraction.
3 Observed Hi data
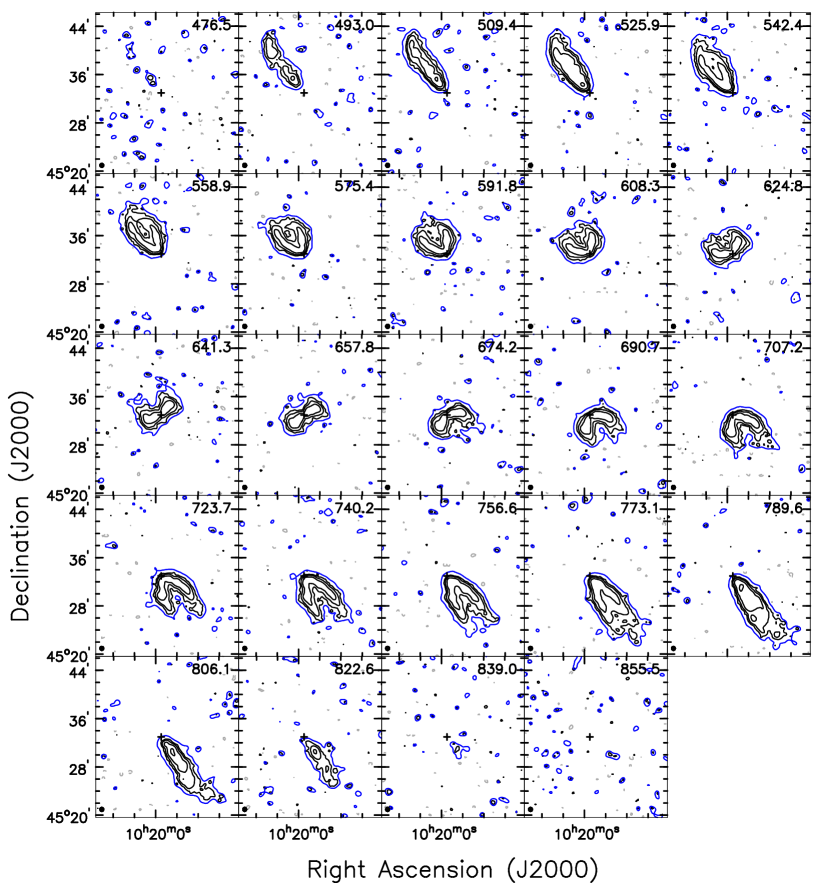
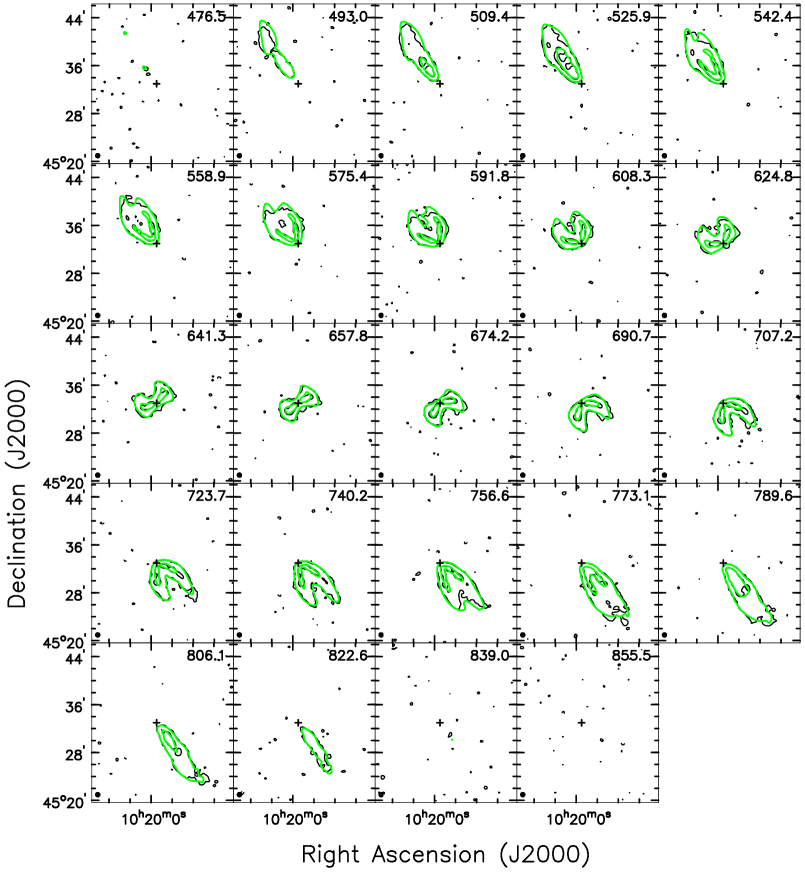
The data cube is shown in Fig. 1, for the lowest contour we also plotted the low-resolution (60 arcsec) cube. The channel maps show a regularly rotating disk and some asymmetries (e.g., the south-west side is slightly more extended).
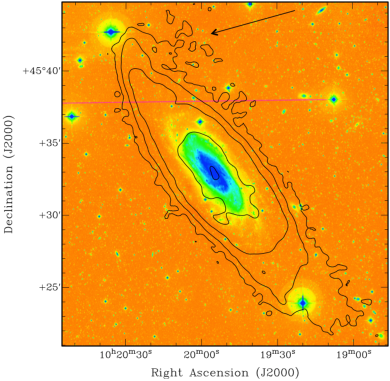
The total Hi map was obtained by computing the 0th moment of a masked version of the data cube, which was determined by masking out spurious emission (i.e., emission that is not above 2 in at least three consecutive channels of the 60 arcsec resolution cube). Fig. 2 shows the total Hi map superimposed with a HALOSTARS image.
From the primary beam corrected data cube we find a total Hi flux of 239.9 Jy km s-1, which translates into a total Hi mass of 1.08 1010 M⊙ assuming a distance of 13.8 Mpc. This Hi mass is slightly (6%) higher than the value given in Walter et al. (2008) from the THINGS (The Hi Nearby Galaxy Survey) survey, which might partly be due to amplitude calibration uncertainties, and partly to the fact that we detect some extraplanar gas.
In Fig. 2 one can see that our data are more sensitive to faint extended emission than previous observations. At a resolution of 30 arcsec, we find meaningful emission down to 1 1019 atoms cm-2. Despite their different angular resolutions, this can be compared with the lowest contour given by Begeman (1989) (0.5 1020 atoms cm-2) and de Blok et al. (2008) (1 1020 atoms cm-2). Note that the latter study focussed more on having a high spatial resolution than on being sensitive to extended emission. Comparing our map with the one in Begeman (1989), we now confirm the existence of the south-west extension hinted at by Begeman’s 0.5 1020 atoms cm-2 contour (see his Fig. 4). However, the total Hi map presented here extends further out, especially in the south-west side of the galaxy, and we tentatively detect some very faint emission to the north of the north-eastern side (visible also in Fig. 1, channels at 493.0 km s-1 to 558.9 km s-1). We estimate the mass of this Hi structure (indicated with a black arrow in Fig. 2) to be about 5 106 M⊙. We note that this is the only feature that clearly does not belong to the thin or thick disk. In many galaxies there is evidence for more of such features, indicating some amount of accreting Hi.
At a projected distance of about 120 kpc from NGC 3198 we also detect in Hi a galaxy pair, identified in NED (NASA/IPAC Extragalactic Database) as VV 834. One of its two components has a radial velocity from the Sloan Digital Sky Survey of 566 256 km s-1. We find an Hi mass of 2.1 107 M⊙ for the galaxy pair. The centres of the two galaxies are only 19 arcsec apart, and the Hi emission is barely resolved, with a total extent of about 1.5–2 arcmin and spreading over 80 km s-1, from km s-1 to km s-1.
4 Models
To investigate in detail the morphology and kinematics of the Hi in this galaxy, we resorted to making models of the whole data cube: it is the most thorough approach that can distentangle subtle differences between various representations of the Hi disk. The uncertainties on the derived parameters are discussed in Section 4.1.
The first model we made was based on the parameters derived by de Blok et al. (2008): as can be seen in Fig. 3, the general features of the data cube are reproduced, but these parameters cannot account for the detailed structure of the emission in each channel map, which is partly expected as in the present paper we detect more diffuse emission which typically has different kinematics.
To improve the model data cube and obtain a better match to the data, we decided to follow the strategy described below, based on successive approximations.
First, we derived a rotation curve based on a tilted-ring modelling on the intensity-weighted velocity field (Begeman 1989), leaving the position angle, the inclination, the systemic velocity and the rotation velocity as free parameters for each ring. Each side (approaching and receding) was treated separately and the best-fit systemic velocity was found to be 657 km s-1. Using the intensity-weighted velocity field can potentially underestimate the inner rotation curve, especially if the velocity gradient is high, as is the case here in the inner regions of NGC 3198. Thus we fixed the position angle and inclination from this fit, and fitted the rotation curve on the velocity field derived using the WAMET method (Gentile et al. 2004), a modified version of the envelope tracing method. For galaxies with a high inclination (such as NGC 3198) or with a poor resolution it is a more reliable choice than the more traditional intensity-weighted mean, which in NGC 3198 might give velocities that are slightly biased towards the systemic velocity. The orientation parameters from the intensity-weighted velocity field were also used to derive the Hi surface density profile by averaging the total Hi map over ellipses. Concerning the gas distribution in the vertical direction, we used a sech2 distribution, initially with a scale height of 0.2 kpc.
Then, these parameters were used as an initial guess to make a fit of the whole data cube using the TiRiFiC (Tilted Ring Fitting Code) software (Józsa et al. 2007), leaving the inclination, the position angle and the rotation velocity free for each ring, separately for each side, and the velocity dispersion (including instrumental effects) free as a global parameter. The best-fit velocity dispersion found by TiRiFiC is 11.7 km s-1.
Because of the very high number of degrees of freedom, the parameters of the best-fit model data cube from TiRiFiC tend to have some strong discontinuities and unphysical “jumps” as a function of radius. Also, by construction TiRiFiC uses a minimisation, which naturally (for a constant noise) gives a higher weight to high signal-to-noise regions. However, these regions are not necessarily the most discriminant between models, that is why the TiRiFiC fitting process has to somehow be manually guided.
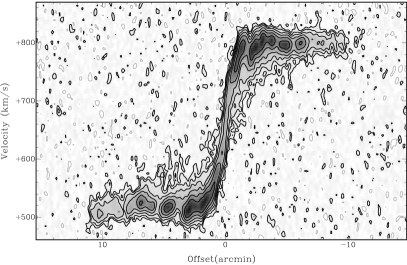
Therefore we used this set of parameters as a basis to adjust the parameters manually when necessary, in order to obtain at the same time a good match of the data cube and a realistic set of parameters. The inclination and the position angle were adjusted based on the total Hi map, and the rotation curve was adjusted based on the position-velocity diagram along the major axis. Changes of at most 5 km s-1 were made to obtain at better match to the observations.
The emission in some channels is skewed (channels 525.9 – 591.8 km s-1 and 707.2 – 740.2 km s-1, see Fig. 1), without an apparent change in the global position angle, and with no sign of position angle change at other azimuths at these radii.
Spekkens & Sellwood (2007) introduced a formalism to fit velocity fields, focussing on bisymmetric distortions, which they deem as being more realistic than the more commonly used radial flows. The reason is that while these two models give similarly good results, they consider radial flows to be less physically plausible as they would have no clear physical origin, and because of the epicyclic approximation they are restricted to small non-circular motions. Therefore, we interpret the skewness of the emission in channels 525.9 – 591.8 km s-1 and 707.2 – 740.2 km s-1 as a bisymmetric distortion of the velocity field, possibly due to an elongation of the potential, ignoring the radial term that is not needed by the present data. In such a model the velocity Vmodel at a given position in the galaxy disk is modelled as:
| (1) |
where is the systemic velocity, is the rotation velocity, is the additional term, is the azimuthal angle relative to the projected major axis, and if is the angle between the bisymmetric distortion and the projected major axis, then . Such a distortion, when included in the model, indeed contributes to improving the match between the model and the observations. It turns out that the amplitude must be 15 km s-1 beyond a radius of approximately 510 arcsec, and must be 45∘ to avoid having skewed emission in the central channels (around the channel at 657.8 km s-1) but to have it at channels 525.9 – 591.8 km s-1 and 707.2 – 740.2 km s-1. A model with radial motions (limited to a wedge around the major axis, to avoid having skewed emission in the central channels) gives almost identical results to this bisymmetric distortion.
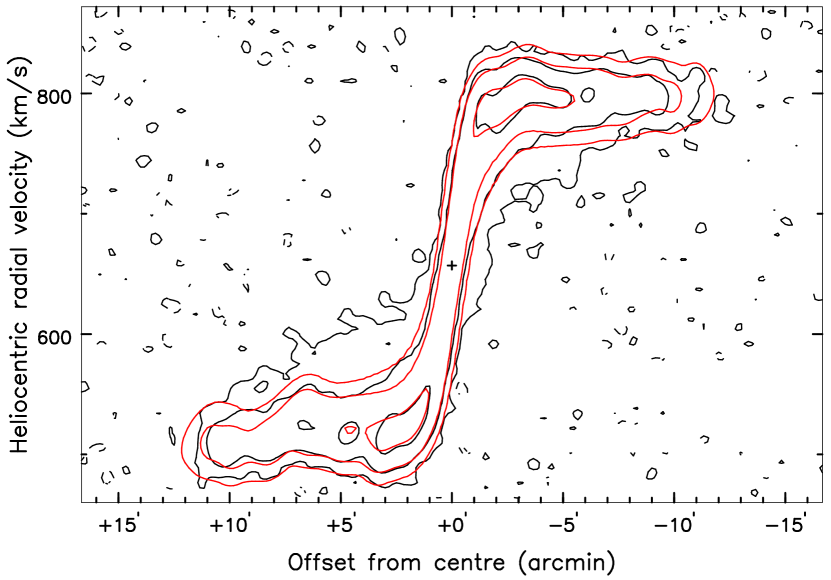
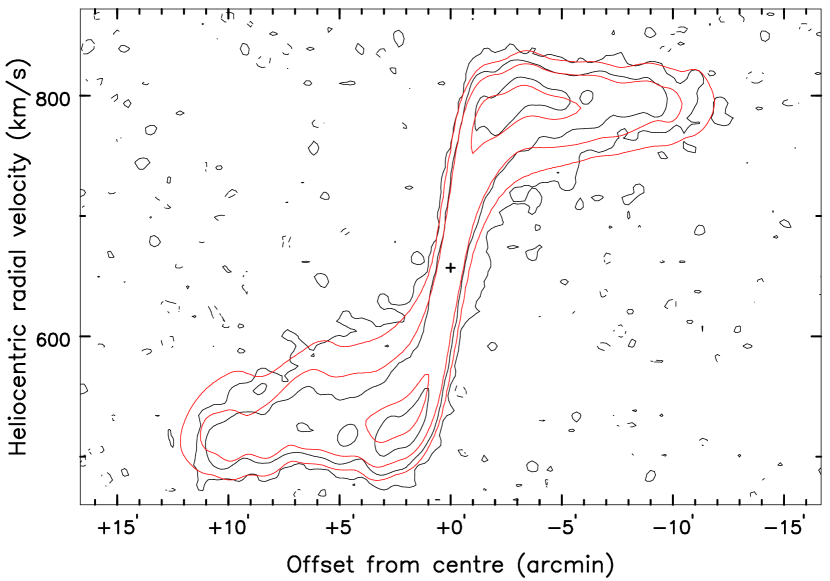
A position-velocity diagram along the major axis with this model is shown in the left panel of Fig. 4. As clearly visible from the position-velocity diagram, to reproduce the observations it is necessary to add some lagging gas. The first attempt was a single thick disk with with a scale-height of 1 kpc and a lag of 18 km s-1 kpc-1 in the approaching side and 8 km s-1 kpc-1 in the receding side (Fig. 4, middle panel). This model reproduces the observations better than the single thin disk, but it is not satisfactory: by increasing the rotation curve in the inner parts (to match the outermost contours), there would be lagging gas missing; by increasing the amplitude of the lag the outer regions would not be reproduced correctly.


Therefore we resorted to a two-disk model, with a a thick disk that rotates more slowly than the main (thin) disk, with the same orientation parameters and run of surface density. This is shown in the right panel Fig. 4, where a model with a lagging thick disk component with a scale-height of 3 kpc is a better representation of the observations. The lag in the model was derived to be 15 km s-1 kpc-1 in the approaching side and 7 km s-1 kpc-1 in the receding side. The thick disk contains about 15% of the total Hi mass and its surface density distribution is a scaled down version of the total Hi density distribution.
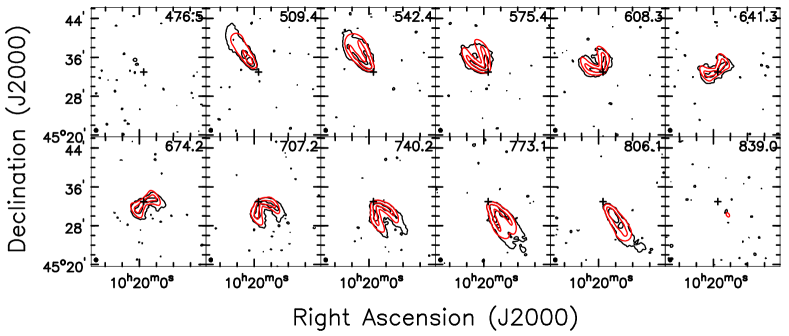
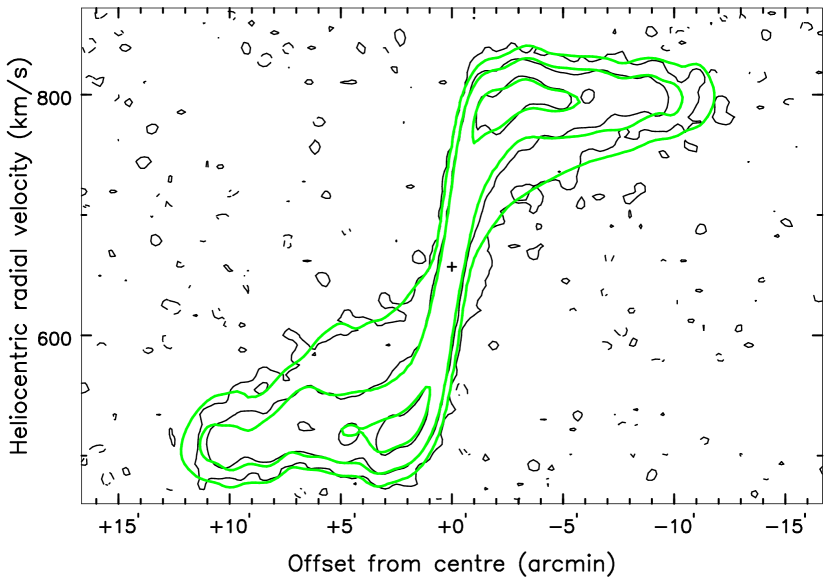
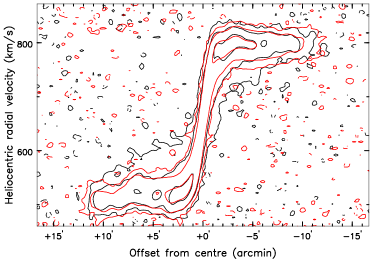
The comparison between the final model data cube and the observed one is shown in Fig. 5. Because the lagging extraplanar gas emission is only 1–2% of the peak in each channel map, we now investigate whether it could be an artifact due to the CLEAN deconvolution and improper modelling of the dirty beam. To this aim, we build a model data cube based on our final model data cube, only without the thick disk. We then convolve it with the dirty beam, we add some Gaussian noise (with an rms chosen in order to obtain the same rms noise as in the observations), and we CLEAN and restore this cube. If the lagging extraplanar gas had been an artifact, in Fig. 6 we would have seen some “pseudo extraplanar gas”. However, we do not, therefore we conclude that the observation of lagging extraplanar gas is genuine and is not an artifact due to the dirty beam. This is also confirmed by the hint of a signal from the extraplanar gas that we see in the high-resolution cube (see Fig. 7).
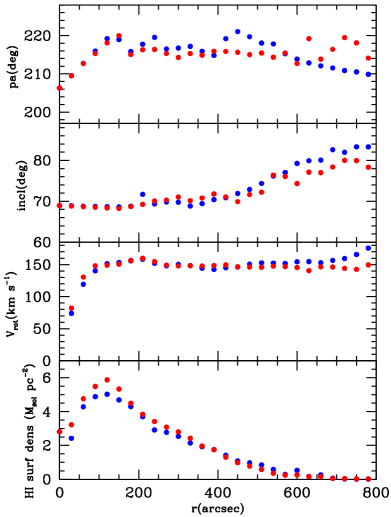
The best-fit parameters are plotted in Fig. 8 (only the parameters with a radial dependence): the two sides are quite symmetric.
4.1 Uncertainties on the derived parameters
Uncertainties on the parameters that describe the model data cubes were estimated by varying the parameter in question un- til the model data cube becomes only marginally consistent with the observed one, focussing on a particular projection of the data cube or a particular region that is particularly sensitive to that parameter.
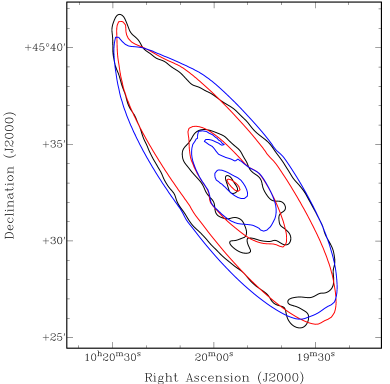
First, the inclination and position angle are better derived by comparing total Hi maps: a variation in inclination or position angle of only 2∘ makes the model total Hi map barely consistent with the observed one (see Fig. 9 for the inclination).
In a similar way, the (global) velocity dispersion is ideally constrained by position-velocity diagrams. It turns out that the high-velocity contours of the position-velocity diagram along the major axis become too spaced out if the velocity dispersion of 11.7 km s-1 changes by more than 2 km s-1.
The uncertainties on the rotation curve were assumed to be half the difference between the two sides. To avoid having unrealistically small errors when the velocities of the two sides are close, we also considered a minimum error of 4.12/sin() km s-1 where is the inclination angle and 4.12 km s-1 is the channel increment of the data cube we used. The amplitude of bisymmetric distortion can be constrained from the channel maps: we find that it is quite uncertain (15 km s-1).
How robust are the figures about extraplanar gas? For the thin disk we assumed a scale-height of 0.2 kpc, and for the thick disk we tried different values. For a given inclination (constrained from the total Hi map, see above), the central channels are particularly sensitive to the scale-height, and we find a value of kpc. The relative mass of the extraplanar gas has to be in the range 10%-20%, and the amplitude of the lag is not strongly constrained (NGC 3198 is not edge-on): we find an uncertainty of approximately 5 km s-1 kpc-1. These uncertainties include the degeneracy between scale-height and lag amplitude: a small scale-height can be partly compensated by a large lag value and viceversa. However a close inspection of the data cube helps resolving this ambiguity and the above uncertainties take it into account.
There are however two additional uncertainties in the computation of the lag value. First, the lag amplitude might vary with radius (e.g. NGC 891, Oosterloo et al. 2007): we cannot exclude a radially varying lag amplitude with values up to 10 km s-1 kpc-1 higher in the inner parts. Second, the value of the lag is also somewhat degenerate with the velocity dispersion of the thick disk: a higher value of the latter can be compensated by a lower value of the lag. However, the velocity dispersion of the thick disk cannot be higher than about 20 km s-1 (and correspondingly a lag about 25% lower than the abovementioned values), in which case the emission in the central channels becomes too extended. Lastly, a thick disk with no vertical gradient in the lag but whose rotation velocity is 20 km s-1 than the thin disk yields a model that is almost as good as the model with a vertical gradient in the lag.
5 Discussion
5.1 Extraplanar gas
We find that the presence of anomalous gas is required to match the observed and model data cubes. The anomalous gas (defined as the modelled thick disk) has a mass of 155% of the total Hi mass, which is comparable to previous studies that use very deep Hi observations to study extraplanar gas, e.g. Zschaechner et al. (2011) and Fraternali et al. (2002). The lag is also a required feature of the model, meaning that the extraplanar gas is progressively rotating more slowly with increasing vertical distance from the mid-plane. The value of the lag is comparable with previous estimates, e.g. Oosterloo et al. (2007) and Zschaechener et al. (2011).

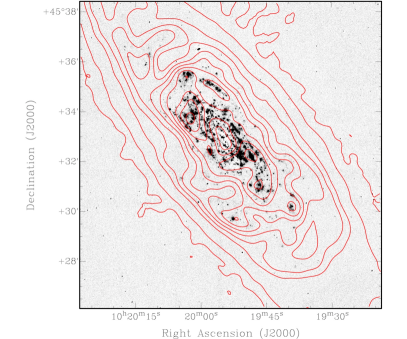
The H image of section 2.3 is shown in Fig. 10. There is a clear correspondence between the brightest Hi peaks and H emitting regions. How does the radial extent of extraplanar gas compare with optical properties? HyperLeda gives an of 194 arcsec, whereas the RC3 gives 255 arcsec. From the position-velocity diagram along the major axis (Fig. 4) there is evidence for extraplanar gas out to 5–6 arcmin (receding side) and at least 6–7 arcmin (approaching side). This can also be compared to the extent of H emission (see Fig. 10 and Fig. 12, left panel), and to our deep r’-band image from the HALOSTARS survey (Fig. 2, Fig. 12, right panel). Since a precise determination of the extent of the extraplanar gas is problematic because it is quite model-dependent, an accurate comparison of the various radial extents (extraplanar gas, stars, H emission) is hardly possible in a quantitative manner. From the surface brightness profiles (Fig. 12) it appears that the H emission extends out to –5 arcmin (note the central negative values due to slightly imperfect continuum subtraction, which is irrelevant for this paper), whereas the r’-band image has some very faint emission out to 6 arcmin, comparable to the extent of the extraplanar gas.
Therefore, we conclude that the extraplanar gas extends slightly beyond the actively star-forming body of NGC 3198 but its extent is comparable to the extent of the stellar disk. This extent is also seen in other galaxies with detected extraplanar gas, e.g. NGC 2403 (Fraternali et al. 2002) and NGC 6946 (Boomsma et al. 2008), and it is expected in galactic fountain-type models such as the dynamical models presented by Fraternali & Binney (2006): regardless of the details of the models, during the initial phases of its motion outside the plane, the gas moves outwards because of the vertical change in the gravitational potential. The origin of extraplanar gas in galaxies is still not unambiguously assessed (as explained more thoroughly in Section 1), but its properties in NGC 3198 are similar to those derived for other galaxies, e.g. the Milky Way (Marasco & Fraternali 2011), which were modelled in the framework of galactic fountain-type models.
5.2 Rotation curve
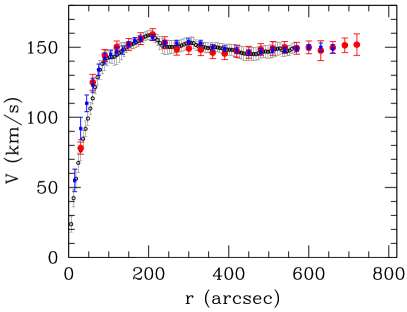
The rotation curve we find (Fig. 11) is roughly consistent with the one derived by de Blok et al. (2008) and Begeman (1989). The former focussed more on the high resolution of their data, whereas in the present paper the data have a lower angular resolution but a higher sensitivity to extended emission. In particular, we confirm the velocity decrease by 10–15 km s-1 between 200 and 250 arcsec, and we find a meaningful rotation curve out to (at least) 720 arcsec. The last useful radius is not an unambiguous quantity to determine. In order to fully exploit the data, but at the same time to avoid overinterpreting them, we defined (rather conservatively) the last reliable radius as the average be- tween the last radius where the average surface density is above atoms cm-2 (650 arcsec) and the last radius where the tilted-ring fit on the velocity field converged. At these large radii (720 arcsec correspond to 48 kpc for a distance of 13.8 Mpc) there is still no sign of decrease of the rotation curve. Note that in Begeman (1989) the last few points of the rotation curve were derived by assuming the same inclination and position angle as those at a radius of 9.5 arcmin. Moreoever, at these radii in the receding side, Begeman’s fit to the velocity field is only based on positions outside the major axis.
5.3 Mass modelling in MOND
The MOND (Modified Newtonian Dynamics) paradigm was introduced by Milgrom (1983) as an explanation (alternative to dark matter) for the absence of Keplerian decline in the observed kinematics of galaxies. MOND has a remarkable predictive power on galactic scales (see e.g. Famaey & McGaugh 2012 and references therein), even though on larger scales also MOND needs some invisible mass. The galaxy studied in the present paper, NGC 3198, was claimed to show tension with MOND (Bottema et al. 2002, Gentile et al. 2011). It is an ideal case study for MOND because of its inclination (perfectly suited for kinematical studies, see Begeman 1989), its relative closeness, the fact that it is a late-type spiral galaxy with regular and symmetric kinematics, and the accurate determination of its distance using Cepheids (Kelson et al. 1999, Freedman et al. 2001). Indeed, the MOND fit is extremely sensitive to the assumed (or fitted) distance. In MOND, the gravitational acceleration produced by the visible matter is linked to the true gravitational acceleration through the interpolating function :
| (2) |
where for and for . Recently preference has been given to the so-called “simple” function: .
The contribution of the stellar disk was taken from de Blok et al. (2008), where is was derived from 3.6 m observations (including a correction for a possible mass-to-light ratio gradient, based on the J-K colour gradient), and the contribution of the gas from the model data cube discussed above: thin disk and the thick disk were treated separately (each with its own mass and scale height), and then their velocities were added quadratically.
We analyse here in some more detail the MOND fit with the distance left free within the uncertainty of the Cepheids determination. In comparison with the fit that used the THINGS data (Gentile et al. 2011, Fig. 5), the present MOND fit is of comparable overall quality: see Fig. 13. However, some differences can be seen: in the innermost parts MOND fits the THINGS rotation curve better than the HALOGAS rotation curve, whereas in the outer parts the situation is reversed. We note that MOND fits each rotation curve best where each rotation curve is expected to be the best choice: THINGS in the inner parts (because of the higher resolution) and HALOGAS in the outer parts (because of the better sensitivity to the outer, fainter emission). The best-fit values of the two fits are the same (best-fit 3.6m mass-to-light ratio of 0.48 and best-fit distance of 12.3 Mpc, at the lower end of the allowed range). The two fits differ in the shape of the contribution of the gas (apart from, obviously, the rotation curve itself): with the more extended data from HALOGAS, we account better for the outer surface density profile of the gas, and therefore we trace better the region where the contribution of the gas start declining. Also, none of the two fits manage to reproduce the decrease in rotation velocity between 200 and 250 arcsec, which corresponds to the end of the brighter part optical disk.
6 Conclusions
We have presented new, very deep (10 12 hours) Hi observations of the spiral galaxy NGC 3198. The observations are part of the HALOGAS (Westerbork Hydrogen Accretion in LOcal GAlaxieS) survey, see Heald et al. (2011). These new observations go significantly deeper than previous Hi observations.
We made careful 3D models of the Hi layer in NGC 3198, including not only traditional features such as a variable inclination, position angle, and the rotation curve, but also newer features such as variable rotation speed as a function of distance from the plane, a thicker disk and a bisymmetric distorsion of the kinematics. In this manner we managed to obtain a model that matched the observed data cube very well.
We revealed for the first time in this galaxy the presence of extraplanar gas over a thickness of a few () kpc. Its amount is approximately 15% of the total mass, and one of its main properties is that it appears to be rotating more slowly than the gas close to midplane, with a (rather uncertain) rotation velocity gradient in the vertical direction (lag) of 7–15 km s-1 kpc-1.
Despite the uncertainty on its actual radial extent, the extraplanar gas seems to be slighly more extended than the star-forming part of the galaxy (as revealed by the H image), but our new deep r’-band image reveals that there is stellar emission out to the end of the detected extraplanar gas. We detect thin disk Hi out to a radial extent that is twice as far as the stellar disk and extraplanar layer. We also detect a faint Hi complex beyond the Hi disk on the northern side of NGC 3198, with an estimated mass of 5 M⊙.
Finally, we make a mass model in the context of MOND (Modified Newtonian Dynamics) of the newly-derived rotation curve, which is more extended than previous determinations. The fit quality is modest, similarly to previous studies, but the outer parts are explained in a satisfactory way.
Acknowledgements
GG is a postdoctoral researcher of the FWO-Vlaanderen (Belgium). PS is a NWO/Veni fellow. RAMW and MP acknowledge support for this project from the National Science Foundation under grant AST-0908126. Based on observations with the Kitt Peak National Observatory, National Optical Astronomy Observatory, which is operated by the Association of Universities for Research in Astronomy (AURA) under co- operative agreement with the National Science Foundation. This publication makes use of data products from the Two Micron All Sky Survey, which is a joint project of the University of Massachusetts and the Infrared Processing and Analysis Center/California Institute of Technology, funded by the National Aeronautics and Space Administration and the National Science Foundation. Funding for the SDSS and SDSS- II has been provided by the Alfred P. Sloan Foundation, the Participating Institutions, the National Science Foundation, the U.S. Department of Energy, the National Aeronautics and Space Administration, the Japanese Monbukagakusho, the Max Planck Society, and the Higher Education Funding Council for England. The SDSS Web Site is http://www.sdss.org/. Finally, we thank Renzo Sancisi for useful comments on an early version of this manuscript.
References
- Barbieri et al. (2005) Barbieri, C. V., Fraternali, F., Oosterloo, T., et al. 2005, A&A, 439, 947
- Begeman (1989) Begeman, K. G. 1989, A&A, 223, 47
- Benjamin (2002) Benjamin, R. A. 2002, Seeing Through the Dust: The Detection of HI and the Exploration of the ISM in Galaxies, 276, 201
- Bertin (2006) Bertin, E. 2006, Astronomical Data Analysis Software and Systems XV, 351, 112
- Binney et al. (2009) Binney, J., Nipoti, C., & Fraternali, F. 2009, MNRAS, 397, 1804
- Blais-Ouellette et al. (2001) Blais-Ouellette, S., Amram, P., & Carignan, C. 2001, AJ, 121, 1952
- Boomsma et al. (2008) Boomsma, R., Oosterloo, T. A., Fraternali, F., van der Hulst, J. M., & Sancisi, R. 2008, A&A, 490, 555
- Bottema et al. (2002) Bottema, R., Pestaña, J. L. G., Rothberg, B., & Sanders, R. H. 2002, A&A, 393, 453
- Bregman (1980) Bregman, J. N. 1980, ApJ, 236, 577
- Collins & Rand (2001) Collins, J. A., & Rand, R. J. 2001, ApJ, 551, 57
- de Blok et al. (2008) de Blok, W. J. G., Walter, F., Brinks, E., et al. 2008, AJ, 136, 2648
- Erben et al. (2005) Erben, T., Schirmer, M., Dietrich, J. P., et al. 2005, Astronomische Nachrichten, 326, 432
- Famaey & McGaugh (2011) Famaey, B., & McGaugh, S. 2012, Living Reviews in Relativity, in press (arXiv:1112.3960)
- Fraternali et al. (2002) Fraternali, F., van Moorsel, G., Sancisi, R., & Oosterloo, T. 2002, AJ, 123, 3124
- Fraternali & Binney (2006) Fraternali, F., & Binney, J. J. 2006, MNRAS, 366, 449
- Freedman et al. (2001) Freedman, W. L., Madore, B. F., Gibson, B. K., et al. 2001, ApJ, 553, 47
- Gentile et al. (2004) Gentile, G., Salucci, P., Klein, U., Vergani, D., & Kalberla, P. 2004, MNRAS, 351, 903
- Gentile et al. (2011) Gentile, G., Famaey, B., & de Blok, W. J. G. 2011, A&A, 527, A76
- Heald et al. (2011) Heald, G., Józsa, G., Serra, P., et al. 2011, A&A, 526, A118
- Howk & Savage (1999) Howk, J. C., & Savage, B. D. 1999, AJ, 117, 2077
- Józsa et al. (2007) Józsa, G. I. G., Kenn, F., Klein, U., & Oosterloo, T. A. 2007, A&A, 468, 731
- Kaufmann et al. (2006) Kaufmann, T., Mayer, L., Wadsley, J., Stadel, J., & Moore, B. 2006, MNRAS, 370, 1612
- Kelson et al. (1999) Kelson, D. D., Illingworth, G. D., Saha, A., et al. 1999, ApJ, 514, 614
- Larson et al. (1980) Larson, R. B., Tinsley, B. M., & Caldwell, C. N. 1980, ApJ, 237, 692
- Li et al. (2008) Li, J.-T., Li, Z., Wang, Q. D., Irwin, J. A., & Rossa, J. 2008, MNRAS, 390, 59
- Macri et al. (2001) Macri, L. M., Calzetti, D., Freedman, W. L., et al. 2001, ApJ, 549, 721
- Marasco & Fraternali (2011) Marasco, A., & Fraternali, F. 2011, A&A, 525, A134
- Marinacci et al. (2011) Marinacci, F., Fraternali, F., Nipoti, C., et al. 2011, MNRAS, 415, 1534
- Ménard et al. (2010) Ménard, B., Scranton, R., Fukugita, M., & Richards, G. 2010, MNRAS, 405, 1025
- Milgrom (1983) Milgrom, M., 1983, ApJ, 270, 365
- Oosterloo et al. (2007) Oosterloo, T., Fraternali, F., & Sancisi, R. 2007, AJ, 134, 1019
- Putman et al. (2012) Putman, M. E., Peek, J. E. G., & Joung, M. R. 2012, ARA&A in press (arXiv:1207.4837)
- Rossa & Dettmar (2003) Rossa, J., & Dettmar, R.-J. 2003, A&A, 406, 505
- Sancisi et al. (2008) Sancisi, R., Fraternali, F., Oosterloo, T., & van der Hulst, T. 2008, A&A Rev., 15, 189
- Sault et al. (1995) Sault, R. J., Teuben, P. J., & Wright, M. C. H. 1995, Astronomical Data Analysis Software and Systems IV, 77, 433
- Schirmer et al. (2003) Schirmer, M., Erben, T., Schneider, P., et al. 2003, A&A, 407, 869
- Sellwood & Sánchez (2010) Sellwood, J. A., & Sánchez, R. Z. 2010, MNRAS, 404, 1733
- Shapiro & Field (1976) Shapiro, P. R., & Field, G. B. 1976, ApJ, 205, 762
- Spekkens & Sellwood (2007) Spekkens, K., & Sellwood, J. A. 2007, ApJ, 664, 204
- Tüllmann et al. (2006) Tüllmann, R., Pietsch, W., Rossa, J., Breitschwerdt, D., & Dettmar, R.-J. 2006, A&A, 448, 43
- van Albada et al. (1985) van Albada, T. S., Bahcall, J. N., Begeman, K., & Sancisi, R. 1985, ApJ, 295, 305
- Walter et al. (2008) Walter, F., Brinks, E., de Blok, W. J. G., et al. 2008, AJ, 136, 2563
- Zschaechner et al. (2011) Zschaechner, L. K., Rand, R. J., Heald, G. H., Gentile, G., & Kamphuis, P. 2011, ApJ, 740, 35