Comprehensive Study of a DLA Galaxy:
Mass, Metallicity, Age, Morphology and SFR from HST and VLT††thanks:
Based on observations collected at the European Organisation
for Astronomical Research in the Southern Hemisphere, Chile, under program
087.A-0085(A). Based on observations made
with the NASA/ESA Hubble Space Telescope, obtained at
the Space Telescope Science Institute, which is operated by the Association of
Universities for Research in Astronomy, Inc., under NASA contract NAS 5-26555.
These observations are associated with program 12553.
Abstract
We present a detailed study of the emission from a galaxy that causes damped Lyman- absorption in the spectrum of the background QSO, SDSS J 22220946. We present the results of extensive analyses of the stellar continuum covering the rest frame optical-UV regime based on broad-band HST imaging, and of spectroscopy from VLT/X-Shooter of the strong emission lines: Ly, [\textO ii], [\textO iii], [\textN ii], H and H. We compare the metallicity from the absorption lines in the QSO spectrum with the oxygen abundance inferred from the strong-line methods (R and N2). The two emission-line methods yield consistent results: [O/H] = . Based on the absorption lines in the QSO spectrum a metallicity of is inferred at an impact parameter of 6.3 kpc from the centre of the galaxy with a column density of hydrogen of . The star formation rates of the galaxy from the UV continuum and H line can be reconciled assuming an amount of reddening of , giving an inferred SFR of yr (Chabrier IMF). From the HST imaging, the galaxy associated with the absorption is found to be a compact (=1.12 kpc) object with a disc-like, elongated (axis ratio 0.17) structure indicating that the galaxy is seen close to edge-on. Moreover, the absorbing gas is located almost perpendicularly above the disc of the galaxy suggesting that the gas causing the absorption is not co-rotating with the disc. We investigate the stellar and dynamical masses from SED-fitting and emission-line widths, respectively, and find consistent results of M. We suggest that the galaxy is a young proto-disc with evidence for a galactic outflow of enriched gas. This galaxy hints at how star-forming galaxies may be linked to the elusive population of damped Ly absorbers.
keywords:
galaxies: formation – galaxies: high-redshift – galaxies: ISM – quasars: absorption lines – quasars: individual: SDSS J 22:22:56.109:46:36.2 – cosmology: observations1 Introduction
Mapping the structure, properties and chemical enrichment of galaxies over cosmic history is a major goal of contemporary astrophysics. In the local Universe, important advances can be made by studying the age-metallicity relation of stars in the Solar neighbourhood (e.g., Holmberg2007; Caffau2011) or in local group dwarf galaxies (Frebel2007; Frebel2010). At redshifts higher than , a powerful method for studying chemical evolution is spectroscopy of Damped Ly Absorbers (DLAs) detected either towards background QSOs (see Wolfe05, and references therein) or against Gamma-ray Burst (GRB) afterglow light (Fynbo06; Savaglio06; Prochaska07). In those studies, abundances are determined from the gas phase as probed by the H i and metal absorption lines detected against the light of the background QSOs and GRB afterglows, respectively.
Mainly at lower redshifts, but recently also at , H ii-region abundances are determined using the relative strengths of strong emission lines (e.g., Kewley08; Shapley11, and references therein). Currently, there have only been very few cases where both methods have been applied to the same object. The first example is the case of the DLA towards SBS 1543+593 (Bowen2005) where the two methods yielded consistent results. Since then a handful of other cases have been studied (see the compilation in Peroux12). As seen in Fig. 8 of Peroux12, the absorption-line measurements generally probe regions at larger galactocentric distances than the emission-line based measurements and on average indicate lower metallicities than the results based on emission-lines, possibly reflecting the early setup of metallicity gradients (oRourke2011). However, it is important to stress that different recipes to derive oxygen abundances using strong emission-line fluxes reveal very inconsistent results (Kewley08). It is therefore of interest to expand the sample of sources where strong-line based abundances can be independently tested using other methods (see also Pettini2006; Kudritzki12). Also, the use of different elements, e.g., Fe, Zn or Si, to infer absorption metallicities may introduce systematic offsets when comparing galaxies within a heterogeneous sample.
Combining the two complementary methods of studying the metal enrichment in galaxies provides important hints to understanding how galaxies turn their gas into stars, as the absorption lines directly probe the cold gas, and the properties of the star forming region can be probed directly from the emission lines, and sometimes also from the continuum. However, linking the absorption characteristics of DLAs to the emission characteristics of the galaxies causing the absorption has been a great challenge at high redshift, due to the faint nature of DLA galaxies and due to their proximity to a very bright QSO. So far, only a few DLA systems with confirmed emission counterparts have been established at redshifts around and higher than two (Krogager2012).
Here we present an analysis of the DLA at with seen in the spectrum of the QSO 22220946. The galaxy counterpart of the absorber was detected by Fynbo10 and here we present new, deeper spectroscopic data allowing us to measure the metallicity directly from nebular O ii, O iii, and Balmer emission lines. Furthermore, we combine the spectroscopic data with imaging from Wide Field Camera 3 (WFC3) onboard the Hubble Space Telescope (HST). The high resolution images from HST makes it possible to detect the continuum emission from the galaxy directly, allowing us to characterize the properties and structure of the absorbing galaxy. This enables us to start bridging the gap between the population of DLA galaxies and star-forming galaxies.
The paper is organized as follows. In Sect. 2, we present the spectroscopic data from X-Shooter and the imaging data from HST/WFC3. In Sect. 3, we derive the oxygen abundance from nebular emission lines, derive the gas phase metal abundances, characterize the morphology from the imaging data, and finally we obtain fluxes of the galaxy used for spectral energy distribution (SED) fitting. In Sect. 4, we compare the absorption and emission properties, and discuss and outline the implications of our work. Throughout this paper, we assume a standard CDM cosmology with , and .
2 Observations and Data Reduction
2.1 X-Shooter spectroscopy
QSO 22220946 was observed with the X-Shooter spectrograph (Vernet2011) mounted on ESO’s Very Large Telescope, Unit Telescope 2, for a total of 10 hours and 47 minutes during the nights of 2011 May 14, 2011 August 4, 29, and 30. The integrations were split into ten different exposures each made up of four sub-exposures dithered along the slit. The instrument is composed of three separate spectrographs (so-called arms): UVB covering 330 nm to 560 nm, VIS covering 550 nm to 1020 nm, and NIR covering 1020 nm to 2480 nm. For all observations slit-widths of 0.8, 0.7 and 0.9 arcsec for were used for UVB, VIS and NIR, respectively, and we used the slow readout with 12 binning, i.e., 2 times binning in the spatial direction. The individual spectra have been processed using the official ESO pipeline (Modigliani10) for nodded exposures version (2.0.0). The spectra were individually flux-calibrated using the standard star observed at the beginning of the night for each integration. All spectra were taken during very good conditions with clear sky and good seeing. The error on the flux calibration is on the order of 5%, as determined from the robustness of the calibration when using different standard stars. We note that Fynbo10 scale their spectrum of this target to the one available from the Sloan Digital Sky Survey. Given our very robust flux calibration we have chosen to trust the pipeline product. Also, comparison of spectra observed in very different epochs, as is the case here, is not straightforward given the random variability of QSOs. We encountered issues with a too low flux-level of the VIS spectra for unknown reasons. For this reason we scaled the VIS spectra to the overlapping regions of the well-determined UVB and NIR spectra. With a simple multiplicative factor we were able to match both UVB and NIR at the same time. The scaling does not affect any of the extracted emission lines as they are all in the NIR spectra, except for Ly in the UVB.
The final 2D-spectra were then spatially aligned and added by error-weighting, and we correct for slit-loss by calculating how much light gets dispersed outside the slit at the given seeing in each exposure before co-adding all the observations. We have not corrected for telluric absorption, since those regions are not crucial for our analysis. The effective seeing in the final flux and wavelength calibrated 2D-spectrum is 0 7 (inferred from the width of the trace at 715 nm) and we measure the resolving power in the spectrum from telluric lines to be 11,000 and 7,000 for the VIS and NIR arms, respectively. As there are no direct features in the UVB arm to indicate the resolving power we assume the resolving power in the UVB arm to be the expected 6,200 from the specifications of the X-Shooter manual given a slit width of 0 8, as the average seeing in UVB was 0 77 (measured at 480 nm).
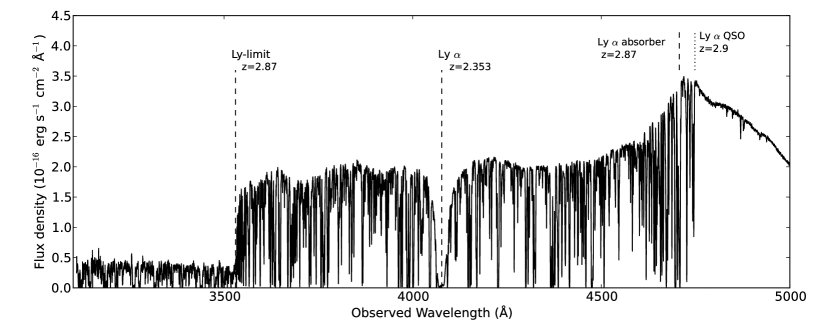
In Figure 1 the spectrum blue-ward of the QSO Ly emission line is shown, demonstrating the quality of the combined spectrum; note the significant flux below the Lyman limit at .
2.2 / WFC3 imaging
The field was observed with the Wide Field Camera 3 on 2011 Nov 10 (with the UVIS detector in the F606W filter) and on 2012 Sep 14 and 15 (with the IR detector in the F105W and F160W filters). The roll-angle of the telescope was set such that the galaxy counterpart of the DLA fell between the diffraction spikes of the Point Spread Function (PSF). The two observations with the IR detector were taken using the WFC3-IR-DITHER-BOX-MIN pattern providing an optimal 4-point sampling of the PSF. The UVIS observation was taken using the WFC3-UVIS-DITHER-BOX pattern.
The field was observed using a 4-point sub-pixel dither pattern, which allowed us to regain more spatial information. We have used the software package multidrizzle 111multidrizzle is a product of the Space Telescope Science Institute, which is operated by AURA for NASA. to align and combine the images. By shifting and combining the images taken with sub-pixel offsets one achieves a better sampling of the PSF, which in the case of the NIR observations is quite crucial as the PSF is poorly sampled in the native 0 13 px images. Furthermore, the drizzle-algorithm allows us to reduce the pixel size when combining the images providing sharper and better sampled images. For the combination in this work we have set the parameter pixfrac to and used a final pixel scale of 0 06 px for NIR and 0 024 px for UVIS. For a detailed description of the parameters in the software we refer the user to the multidrizzle user manual.
3 Results
3.1 Spectral PSF subtraction
In order to detect the faint emission lines from the foreground Damped Lyman- Absorbing galaxy we needed to subtract the QSO continuum. We did this by modelling the spectral trace and the spectral point spread function (SPSF) as a function of wavelength. The trace position and amplitude were fitted as a function of wavelength in a small (84Å) region around each emission line from the galaxy, e.g., O ii, O iii, and N ii. In the same region around the line we estimated the SPSF by averaging the observed spatial profile along the spectral direction. The modelled 2D-spectrum of the QSO was then subtracted from the observed spectrum, and a 1D-spectrum for each line was extracted with the optimal extraction algorithm of Horne86. All extracted emission lines are shown in Figure LABEL:fig:lines.
3.2 Extracting the Emission Lines
We were able to detect emission from Ly, H, H, the O ii doublet, the two O iii lines at Å and Å, and N ii. The line profiles for all the extracted lines were fitted with Gaussian profiles to measure the flux in the line. The parameters of the Gaussian were allowed to vary in all fits except for O ii and N ii. The line-width and redshift of the two O ii components were tied in the fit, because of a sky line that falls right between the two components. For the very faint N ii-line, we re-binned the spectrum by a factor of two and fixed the redshift and line-width to the values of the nearby H line. The errors on the fluxes were estimated by varying the line profile within the error of each fit parameter 1,000 times. The uncertainty was then determined from the 1 width of the resulting distribution of fluxes. The fluxes and errors are listed in Table 1.
All the extracted lines with Gaussian line fits are shown in Fig. LABEL:fig:lines along with the best fitting Gaussian profile. The grey shaded areas indicate telluric emission or absorption features. These regions were included in the fits to give the optimal estimate of uncertainties on the fit parameters. The Ly line is shown in Fig. LABEL:fig:lyalpha. Due to the asymmetric shape and the complex nature of the resonant line, we determine the line flux simply by integrating the observed line profile as opposed to fitting the line.
| Transition | Wavelength | Flux | FWHM | |
|---|---|---|---|---|
| Ly | 1215.67 | 14.30.3 | – | – |
| O ii | 3726.03, 3728.82 | 2.90.3 | 2.3536 | |
| H | 4861.33 | 1.90.2 | 2.3537 | |
| O iii | 4958.92 | 4.10.3 | 2.3537 | |
| O iii | 5006.84 | 11.60.6 | 2.3537 | |
| H | 6562.80 | 5.70.3 | 2.3537 | |
| N ii | 6583.41 | 0.60.2 | – | – |
Transition rest frame wavelength in .
Flux in units of erg s cm, before reddening correction.
Line width at FWHM in units of km s corrected for the instrumental resolution of 45 km s.