Drag force scaling for penetration into granular media
Abstract
Impact dynamics is measured for spherical and cylindrical projectiles of many different densities dropped onto a variety non-cohesive granular media. The results are analyzed in terms of the material-dependent scaling of the inertial and frictional drag contributions to the total stopping force. The inertial drag force scales similar to that in fluids, except that it depends on the internal friction coefficient. The frictional drag force scales as the square-root of the density of granular medium and projectile, and hence cannot be explained by the combination of granular hydrostatic pressure and Coulomb friction law. The combined results provide an explanation for the previously-observed penetration depth scaling.
pacs:
45.70.Ht, 45.70.Cc, 83.80.Fg, 89.75.DaCollision is one of the most fundamental processes in nature, and can be exploited to uncover the basic physics of systems ranging from planets to elementary particles. Impact of projectiles into a pack of grains has been of increasing interest for highlighting and elucidating the unusual mechanical properties of granular materials. This includes studies of crater morphology Amato and Williams (1998); Walsh et al. (2003); Zheng et al. (2004), penetration depth Uehara et al. (2003); Ambroso et al. (2005a); de Rruyn and Walsh (2004), dynamics Daniels et al. (2004); Ciamarra et al. (2004); Lohse et al. (2004); Ambroso et al. (2005b); Hou et al. (2005); Tsimring and Volfson (2005); Katsuragi and Durian (2007); Goldman and Umbanhowar (2008); Umbanhowar and Goldman (2010); Pacheco-Vázquez et al. (2011); Clark et al. (2012); Clark and Behringer (2013), boundary effects Boudet et al. (2006); Nelson et al. (2008); Seguin et al. (2008); von Kann et al. (2010); Pacheco-Vázquez et al. (2011); Torres et al. (2012) and packing-fraction effects Umbanhowar and Goldman (2010); Royer et al. (2011); Torres et al. (2012). One finding is that the penetration depth scales as where is projectile diameter and is the total drop distance Uehara et al. (2003); Ambroso et al. (2005a). Granular impact is also important for military and industrial applications Roddy et al. (1978); Zukas (1990), and cone penetration tests are used for in-situ soil characterization Yu and Mitchell (1998); Toiya et al. (2007).
In a previous study Katsuragi and Durian (2007) we measured the impact dynamics of a 2.54 cm steel ball onto a packing of glass beads. The stopping force was found to be the sum of an inertial drag, proportional to the square of the speed , and a frictional drag, proportional to depth . This has since been supported by several other experiments Seguin et al. (2008); Goldman and Umbanhowar (2008); Brzinski and Durian (2010); von Kann et al. (2010); Pacheco-Vázquez et al. (2011); Torres et al. (2012); Clark et al. (2012); Clark and Behringer (2013). The equation of motion during impact is thus
| (1) |
where is projectile mass, cm/s2, and and are materials parameters expressed with units of a length and a spring constant, respectively. By using and an integrating factor, as in Ref. Ambroso et al. (2005b), this can be solved for speed versus depth:
| (2) |
where is the impact speed at . The final penetration depth is then given by the limit of as
| (3) |
where is the Lambert -function. An additional constant stopping force de Rruyn and Walsh (2004); Clark and Behringer (2013) can be included in these expressions by replacing with .
Some open questions are how and scale with the materials properties of the projectile and the granular packing, and how this conspires to give . For inertial drag, exactly as for hydrodynamic drag at high Reynolds number Re, momentum transfer gives the expectation where is the projected projectile area and is the mass density of the granular medium. For frictional drag, the combination of hydrostatic pressure and Coulomb friction gives where the internal frictional coefficient is and is the angle of repose. The scaling of and would thus be
| (4) | |||||
| (5) |
where and correspond to diameter and density of projectile, respectively. Here, we test the speed versus depth prediction of Eq. (2), and we compare fitted values of and with the above expectations. While neither turns out to be quite correct, we connect the results to the observed penetration depth scaling.
Our basic experimental setup is identical with previous work Katsuragi and Durian (2007). The velocity of the projectile at time is computed by particle-image velocimetry applied to fine stripes on a vertical rod glued to the top of the projectile. The system has 20 s temporal resolution and 100 nm spatial resolution, which is fine enough to compute position and acceleration from . The primary difference from Ref. Katsuragi and Durian (2007) is that now we vary both the projectiles and the granular medium. We begin with 0.35 mm diameter glass beads, prepared to a reproducible random packing state by slowly turning off a fluidizing up-flow of air. Into this we drop a wide variety of projectiles, listed in Table 1, from free-fall heights between 0 to 85 cm. The first type is spheres. The second type is aluminum cylinders, which are dropped lengthwise with the axis horizontal and parallel to the surface of the granular medium. In both cases the effective density is given by projectile plus rod mass divided by projectile volume. The length of the cylinders is varied, but we find that it does not affect the dynamics or final penetration depths.
| Projectile | (g/cm3) | (cm) | (cm) |
|---|---|---|---|
| Hollow PP ball | 0.51 | 2.54 | - |
| Wood ball | 0.95 | 2.54 | - |
| Delrin ball | 1.65 | 2.54 | - |
| PTFE ball | 2.46 | 2.54 | - |
| Steel ball | 7.96 - 159 | 0.3175 - 5.08 | - |
| Tungsten carbide ball | 15.3 | 2.54 | - |
| Aluminum cylinder | 2.89 - 4.26 | 0.635 -1.27 | 5.08 - 15.24 |
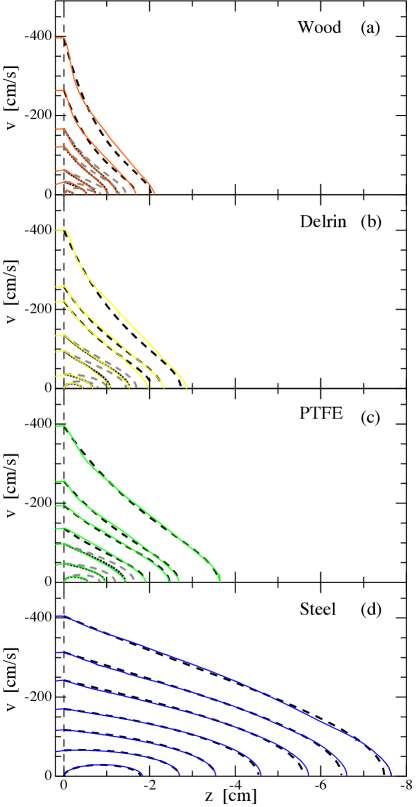
Example speed versus position data are plotted in Fig. 1 for cm diameter projectiles of four different densities, dropped onto the glass bead packing, with initial impact speeds ranging from zero to 400 cm/s. For slow impacts, the speed first increases and then decreases with depth. For faster impacts, the speed versus depth curves gradually change from concave down to concave up. Generally, there is a rapid decrease of speed to zero at the final penetration depth. We obtain good fits to these complex trajectories by adjusting and , as shown in Fig. 1. The displayed level of agreement is typical for all projectiles, including the cylinders.
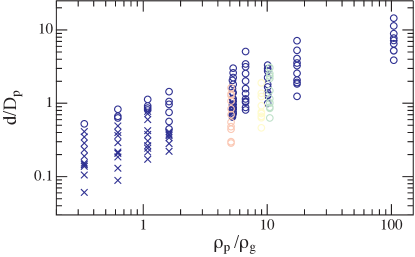
Unfortunately a good simultaneous fit for a given projectile to a single pair of and values at all impact speeds can be obtained only for denser projectiles. For the less dense projectiles, the fitting parameters become constant only at high impact speeds. Then the same values for and are obtained as from the analysis method of Ref. Katsuragi and Durian (2007). This holds roughly for and as shown in Fig. 2. We speculate that for low density projectiles and small impact speeds, the penetration can be shallow enough that the detailed shape of projectile must be taken into account Newhall and Durian (2003). In this regime surface flows and surface roughness could plays a role, though identical penetration behavior was found earlier for slick and tacky projectiles of the same size and density Uehara et al. (2003). We note that including a constant force as a third free parameter does not noticeably change the fits; the largest fit value is cm/s2, which is small compared to . We note, too, that cannot be chosen such that and become constant. For the rest of the paper, we restrict attention to conditions where the deduced and values do not depend on impact speed and hence can be considered as materials parameters.
We now compare the fitting parameters with Eqs (4-5). The expectation for is based on momentum transfer, so that the inertial drag force is just like an object moving in a fluid at high Reynolds number. For spheres and cylinders, the characteristic length is thus and can be written as if we take to be 1 times diameter for spheres and times diameter for cylinders (the cylinder length drops out of the ratio ). For a unified analysis, we therefore divide the fitted value of by and plot versus in Fig. 3a. We find that all data, including the cylinder data, collapse nicely onto a power-law with the expected slope of one; i.e. holds as per expectation.
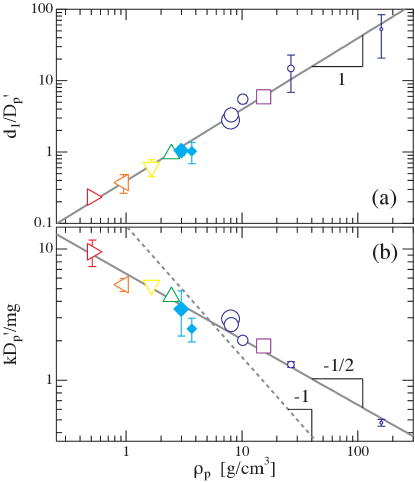
For the fitting parameter that sets the quasi-static friction force, , we now make a similar comparison with expectation by plotting versus in Fig. 3b. All the data, including the cylinder, again collapse nicely to a power law in projectile density. However, the expected power-law is clearly wrong. The data are instead consistent with . Therefore, the nature of the quasistatic frictional drag is different from the simple combination of Coulomb friction and hydrostatic pressure.
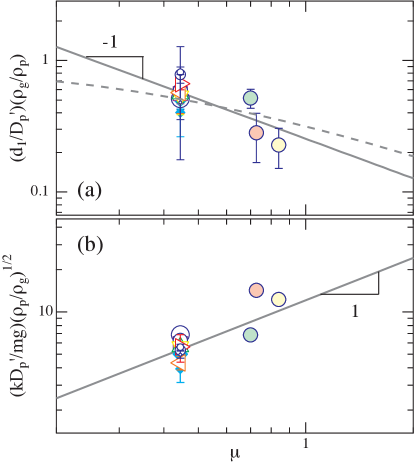
To investigate this further, we perform a second series of experiments where =2.54 cm diameter steel spheres are dropped into rice, beach sand, and sugar (with materials properties listed in Table 2). As in Fig. 1, speed vs position data for a range of impact speeds are fit to Eq. (2) to obtain values of and . Based on Fig. 3, and assuming that the x-axis of this figure is correctly made dimensionless by dividing out the bulk density of the granular medium, the observed scalings so far are and . Therefore, we divide out this density dependence and plot it in Fig. 4 versus the only remaining material property of the grains: the internal friction coefficient where is the draining angle of repose. In this figure the data for glass beads, from Fig. 3, all lie at . The range of values is less than a factor of two, but to within uncertainty the scaled and parameters collapse to power-laws in . For the quasistatic frictional drag coefficient we find , which is expected for Coulomb friction. For the speed-squared inertial drag coefficient, we find . Therefore the inertial drag force is proportional to , which could correspond to an added-mass effect whereby the volume of grains boosted to the projectile speed grows in proportion to . This is unlike the case of simple fluids, where the fluid flow and the inertial drag force at high Re depend only on the density of the fluid.
As an alternative analysis for the dependence of , one could imagine that an inertial drag force loads the contacts and gives an additional friction force of times this loading. Then the total velocity-squared force is , which gives . This reasonably fits the data, as shown in Fig. 4a with . The residuals are smaller for the power-law form.
| Granular Material | (g/cm3) | Grain size (mm) | |
|---|---|---|---|
| Glass beads | 1.45 | 0.25 - 0.35 | |
| Rice | 0.77 | 28 | |
| Beach sand | 1.51 | 0.2 - 0.8 | |
| Sugar | 0.89 | 0.4 - 0.7 |
Combining the power-laws in Figs. 3-4, and the actual numerical prefactors, the inertial and frictional drag coefficients are altogether found by measurements for a range of projectiles and grains to be consistent with
| (6) | |||||
| (7) |
The two main differences from the simple expectation of Eqs. (4-5), are the factor of in and the density ratio exponent of 1/2 rather than 1 in . These results may be inspected differently by re-writing the equation of motion as
| (8) |
Note that the numerical prefactor for the depth-dependent frictional drag is significantly larger than unity, and that is larger than for dense projectiles. For both reasons, frictional drag exceeds the value expected from hydrostatic pressure and Coulomb friction. One might have expected the opposite effect, either by a decrease in contact area between projectile and grains due to ejection of grains or by fluidization of the grains from the motion of the projectile. Our results instead appear to indicate that frictional contacts are loaded by the motion of the projectile, so that the medium is stronger than set by gravity alone. Such behavior is not seen for the fast horizontal rotation of bars Brzinski and Durian (2010), where the depth- and speed-dependent forces are easily disentangled, and warrants further attention.
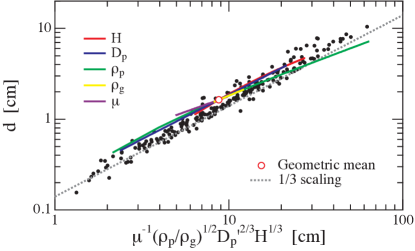
As a final test we now compare data for the final penetration depth with Eq. (8). Prior observations Uehara et al. (2003); Ambroso et al. (2005a) are consistent with the empirical form
| (9) |
Thus in Fig. 5 we plot penetration depth data for all trials versus the quantity from the right-hand side of this expression. This collapses our new data to within the experimental uncertainty, including that for the cylinder, to the line and hence shows agreement with prior work. However Eqs. (3,8) do not predict perfect power-law behavior. To compare with data, we first calculate the geometric mean of each of the five variables , , , , and over the range of experimental conditions employed here. The predicted penetration depth for these mean values is shown by a single red open circle in Fig. 5. Then we vary each of variables, one at a time, keeping all others fixed at their mean value. The resulting five predicted penetration depth curves are included in Fig. 5. They are not identical, or even perfect power laws, but are all close together and in fair agreement with the data. Thus the empirical penetration depth data scaling is satisfactorily understood in terms of the nature of the stopping force exerted by the medium onto the projectile.
In conclusion, we developed an exact solution of Eq. (1) for the dynamics of penetration, and we conducted a wide range of granular impact experiments to elucidate the materials dependence of the inertial and frictional contributions to the stopping force. The final equation of motion, Eq. (8), is roughly consistent with the empirical scaling of penetration depth versus drop height and materials parameters. However it is not consistent with the apparently simplistic expectation of Eqs. (4-5). So there is unanticipated physics, yet to be understood, which could possibly arise from motion-loading of frictional contacts or from granular flow fields that depend on the internal friction coefficient.
This work was supported by the JSPS Postdoctoral Fellowships for Research Abroad (HK) and the National Science Foundation through Grant Nos. DMR-0704147 and DMR-1305199.
References
- Amato and Williams (1998) J. C. Amato and R. E. Williams, Am. J. Phys. 66, 141 (1998).
- Walsh et al. (2003) A. M. Walsh, K. E. Holloway, P. Habdas, and J. R. de Bruyn, Phys. Rev. Lett. 91, 104301 (2003).
- Zheng et al. (2004) X. J. Zheng, Z. T. Wang, and Z. G. Qiu, Eur. Phys. J. E 13, 321 (2004).
- Uehara et al. (2003) J. S. Uehara, M. A. Ambroso, R. P. Ojha, and D. J. Durian, Phys. Rev. Lett. 90, 194301 (2003).
- Ambroso et al. (2005a) M. A. Ambroso, C. R. Santore, A. R. Abate, and D. J. Durian, Phys. Rev. E 71, 051305 (2005a).
- de Rruyn and Walsh (2004) J. R. de Rruyn and A. M. Walsh, Can. J. Phys. 82, 439 (2004).
- Daniels et al. (2004) K. E. Daniels, J. E. Coppock, and R. P. Behringer, Chaos 14, S4 (2004).
- Ciamarra et al. (2004) M. P. Ciamarra, A. H. Lara, A. T. Lee, D. I. Goldman, I. Vishik, and H. L. Swinney, Phys. Rev. Lett. 92, 194301 (2004).
- Lohse et al. (2004) D. Lohse, R. Rauhé, R. Bergmann, and D. van der Meer, Nature 432, 689 (2004).
- Ambroso et al. (2005b) M. A. Ambroso, R. D. Kamien, and D. J. Durian, Phys. Rev. E 72, 041305 (2005b).
- Hou et al. (2005) M. Hou, Z. Peng, R. Liu, K. Lu, and C. K. Chan, Phys. Rev. E 72, 062301 (2005).
- Tsimring and Volfson (2005) L. S. Tsimring and D. Volfson, in Powders and Grains 2005, edited by R. Garcia-Rojo, H. Herrmann, and S. McNamara (Balkema, Rotterdam, 2005), p. 1215.
- Katsuragi and Durian (2007) H. Katsuragi and D. J. Durian, Nature Phys. 3, 420 (2007).
- Goldman and Umbanhowar (2008) D. I. Goldman and P. B. Umbanhowar, Phys. Rev. E 77, 021308 (2008).
- Umbanhowar and Goldman (2010) P. B. Umbanhowar and D. I. Goldman, Phys. Rev. E 82, 010301 (2010).
- Pacheco-Vázquez et al. (2011) F. Pacheco-Vázquez, G. A. Caballero-Robledo, J. M. Solano-Altamirano, E. Altshuler, A. J. Batista-Leyva, and J. C. Ruiz-Suárez, Phys. Rev. Lett. 106, 218001 (2011).
- Clark et al. (2012) A. H. Clark, L. Kondic, and R. P. Behringer, Phys. Rev. Lett. 109, 238302 (2012).
- Clark and Behringer (2013) A. H. Clark and R. P. Behringer, Europhys. Lett. 101, 64001 (2013).
- Boudet et al. (2006) J. F. Boudet, Y. Amarouchene, and H. Kellay, Phys. Rev. Lett. 96, 158001 (2006).
- Nelson et al. (2008) E. L. Nelson, H. Katsuragi, P. Mayor, and D. J. Durian, Phys. Rev. Lett. 101, 068001 (2008).
- Seguin et al. (2008) A. Seguin, Y. Bertho, and P. Gondret, Phys. Rev. E 78, 010301 (2008).
- von Kann et al. (2010) S. von Kann, S. Joubaud, G. A. Caballero-Robledo, D. Lohse, and D. van der Meer, Phys. Rev. E 81, 041306 (2010).
- Torres et al. (2012) H. Torres, A. Gonzalez, G. Sanchez-Colina, J. C. Drake, and E. Altshuler, Rev. Cub. Fis. 29, 1E45 (2012).
- Royer et al. (2011) J. R. Royer, B. Conyers, E. I. Corwin, P. J. Eng, and H. M. Jaeger, Europhys. Lett. 93, 28008 (2011).
- Roddy et al. (1978) D. J. Roddy, R. O. Pepin, and R. B. Merril, eds., Impact and explosion cratering (Pergamon Press, NY, 1978).
- Zukas (1990) J. A. Zukas, ed., High velocity impact dynamics (Wiley, NY, 1990).
- Yu and Mitchell (1998) H. S. Yu and J. K. Mitchell, J. Geotech. Eng. 124, 140 (1998).
- Toiya et al. (2007) M. Toiya, J. Hettinga, and W. Losert, Granular Matter 9, 323 (2007).
- Brzinski and Durian (2010) T. A. Brzinski and D. J. Durian, Soft Matter 6, 3038 (2010).
- Newhall and Durian (2003) K. A. Newhall and D. J. Durian, Phys. Rev. E 68, 060301(R) (2003).