Direct Ultraviolet Imaging
and Spectroscopy of Betelgeuse
Abstract
Direct images of Betelgeuse were obtained over a span of 4 years with the Faint Object Camera on the Hubble Space Telescope. These images reveal the extended ultraviolet continuum emission (2 times the optical diameter), the varying overall ultraviolet flux levels and a pattern of bright surface continuum features that change in position and appearance over several months or less. Concurrent photometry and radial velocity measures support the model of a pulsating star, first discovered in the ultraviolet from IUE. Spatially resolved HST spectroscopy reveals a larger extention in chromospheric emissions of Mg II as well as the rotation of the supergiant. Changing localized subsonic flows occur in the low chromosphere that can cover a substantial fraction of the stellar disk and may initiate the mass outflow.
Eds. P. Kervella, Th. Le Bertre & G. Perrin, in press
1 Introduction
Alpha Orionis (Betelgeuse) has been long and well-studied with a variety of ground and space-based techniques as a prototypical supergiant. Ultraviolet observations have been particularly useful because they probe the very outer layers of this star and can pinpoint the onset of outflowing material and indicate the driving mechanisms behind the mass loss from the star (Dupree 2010). In fact the monitoring of the flux from Betelgeuse shows that its photometric behavior and its ’spottedness’ differ from the signals of magnetic activity found in the Sun and active cool stars. The long-lived IUE satellite clearly demonstrated the presence of periodic fluctuations and a traveling disturbance in the outer atmosphere (Dupree et al. 1987). And the Hubble Space Telescope with its Faint Object Camera acquired the first direct image of a star other than the Sun (Gilliland & Dupree 1996) which in concert with ground-based photometry and spectroscopy and further ultraviolet imaging reveals the extent and characteristics of the supergiant’s variability.

2 Spatially Unresolved Photometry and Spectroscopy
Over a time span of 16 years, photometry in the V-band and the ultraviolet continuum ( 2950–3050Å), the Mg II k-line emission flux, and the radial velocity are shown in Fig. 1. For 3 years (JD 6000-7400, mod JD2440000), the chromosphere displayed a brightness fluctuation with a period of 420 days (Dupree et al. 1987) which later became substantially weaker, and then disappeared entirely. The appearance of a period suggests that the global brightness variations do not arise from the appearance of convection cells on the surface which would not be expected to be periodic. A period of 400 d is consistent with models of fundamental pulsation modes of the star (Lovy et al. 1984, Stothers 2010). From Fig. 1, it is apparent that the continuum brightenings are correlated with the high chromospheric (Mg II) brightenings. This is also a clue that Betelgeuse’s behavior is not the result of magnetically active ’star spots’. Cool stars with magnetic activity are well-known to show an anti-correlation between photometric brightenings and chromospheric activity. When classical star spots are present, they are cooler and photometrically ’dark’, the continuum flux decreases, and chromospheric emission lines become stronger as a result of magnetically-associated chromospheric heating. The V-magnitude decreases during three instances (JD7600, JD9100, JD9800, mod JD2440000) where the UV continuum measures, observed simultaneously with V-band photometry exhibits a decreased flux. Additionally, the flux modulation in Betelgeuse is substantial … about a factor of 2 in the lines and continuum … and such an excursion surpasses that found in low gravity magnetically active stars such as RS Cvn binaries.
An indication of the presence of a travelling wave in the atmosphere comes from measures of the B-magnitude variations and the flux in the chromospheric lines reported in Dupree et al. (1987). On several occasions during the time when the 420-day period was evident, the B magnitude became faint and then recovered while, after a delay of 55 days, the Mg II h-line flux became faint and subsequently recovered. If a propagating wave caused the decrease in emission measure, followed by an increase, and this wave travelled at 2 km s-1, it would cover a reasonable distance of 0.1 R⋆ in 55 days, using the larger distance of Betelgeuse (191 pc) suggested by Harper et al. (2008). Observation of the variation of the Mg II h and k lines suggests a lag of 70 days beween the h and k line variations. Because the opacity in the k-line is larger than the h-line, the k-line is formed further out in the atmosphere and the lag in flux variation between this two lines again is consistent with a propagating disturbance.
The radial velocity measures might offer additional information. The values displayed in Fig. 1 (lower panel) suggest a long-term variability (13 yr) on which shorter variations (400 d) are superposed. In a Cepheid star, the light maximum is close to but does not always coincide with the maximum velocity of approach (cf. Robinson & Hoffleit 1932; Bersier 2002). One CS Mira star, R CMi, has shown light maximum after maximum velocity infall (Jorissen 2004, and Lion et al. 2013). Detailed study shows the velocity pattern in Miras is complex and varies with the line diagnostic (Hinkle et al. 1982). Inspection of Fig. 1 shows an inconsistent pattern at many light maxima in Betelgeuse. For instance, the V-magnitude displays brightenings at JD8600, JD 10800, JD 11200 (mod JD2440000) coincident with the radial velocity corresponding to a local infall maximum - not subsequent to the infall maximum as seen in a Mira variable. However, the data at JD9800 exhibit a minimum V-magnitude brightness, yet the radial velocity measures signal maximum inflow. Gaps in the observational measures obviously can compromise conclusions here. The spatially resolved observations discussed later in this paper appear to offer an explanation of the radial velocity behavior, suggesting that a clean interpretation and seeking similarity with other pulsating stars remains challenging.
In sum, the spatially unresolved measures suggest that pulsation phenomena could dominate the photometric variability of Betelgeuse, but the details do not consistently replicate in detail what is found in globally pulsating Cepheid stars or in Mira giants.
3 Direct UV Imaging of Betelgeuse
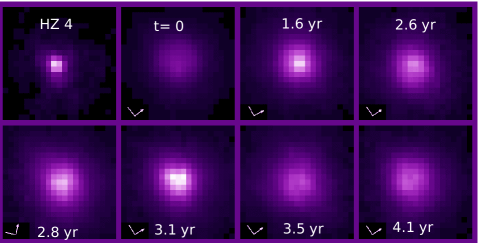
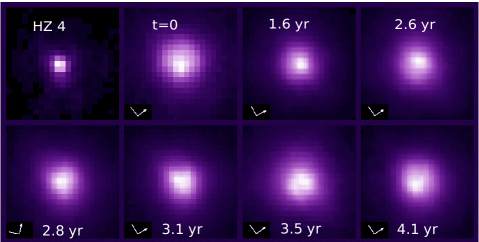
The Faint Object Camera on HST was used (Gilliland & Dupree 1996) to image Betelgeuse directly in the ultraviolet continuum (2550Å). This first direct image of the surface of a star other than the Sun provided about 10 resolution elements on the ultraviolet disk (38 mas point spread function) which has a diameter about 2.2 times larger than the optical diameter. This image revealed a bright spot in the SW quadrant of the star which comprised 10% of the area and 20% of the flux from Betelgeuse at that time. Subsequently, we followed up with similar ultraviolet images spanning 4.1 years. All of the images were obtained with a combination of filters: a medium-band filter (F253M) was crossed with a second UV filter, F220W, and 4 magnitudes of neutral-density filter inserted also. These images are shown in Fig. 2 where different scalings are used in the upper and lower panel set. Each of these images contains the comparison star, HZ 4, taken during the first visit of HST () demonstrating the extended nature of Betelgeuse in the ultraviolet.
When the images are scaled to the same exposure time (Fig. 2, top panels), it is obvious that the total ultraviolet flux not surprisingly varies on a time scale of months. The lower panels in Fig. 2 show the same images scaled to the brightest pixel. This figure reveals the changing brightness pattern across the stellar chromosphere. The single bright area found at becomes smaller and fainter over the next 2.6 yr, then appears to move to the north, and becomes greatly extended in the 3.5 yr observation, approximately ’circling’ the spot in the original () image, before fading in the final image at 4.1 yr. The bright spots seem to stay in approximately the same position on the star. We find no large excursion to the stellar limb in the position of the bright spot.
Characteristics of the UV images are shown in Fig. 3 with respect to the V magnitude and the radial velocity. The mean UV flux from the HST images (third panel) generally tracks the V magnitude. In fact, the faintest excursion in magnitude is in harmony with the lowest value of the UV flux, and the times of brightest optical magnitude generally agree with the brightest UV flux. The relation beween UV flux and radial velocity is not so clear. The highest infall velocity occurs twice during the HST observations, and at these times the
mean UV flux is first at a minimum and then at a maximum value.
A Voigt profile was fit to the UV continuum images and the full width at half maximum (FWHM) is also shown in Fig. 3 (bottom panel). There does not appear to be a relationship between the diameter of the UV image and the photospheric radial velocity. During the time span of the HST images, the V magnitude displays a period of 366 days whereas the period found for the radial velocity variation is 440 days. These periods were derived using the Lomb-Scargle technique for irregularly-spaced data after removing a linear trend (Horne & Baliunas 1986). The absence of correlations may be understood from the results of the spatially resolved spectra discussed below.

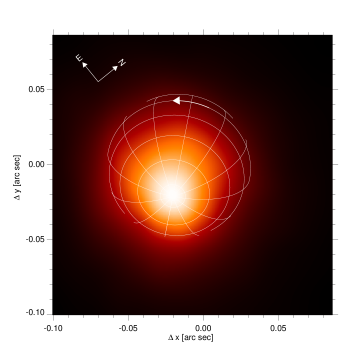
At the same time of the first UV image, spatially resolved UV spectra were obtained (Uitenbroek et al. 1998) in the near ultraviolet region that included both the resonance Mg II emission lines and several photospheric absorption lines. The absorption lines from the spatial scan NW to SE across the stellar disk displayed a systematic shift from negative to positive velocities with a total amplitude 10 km s-1. This behavior is interpreted as due to the rotation of the star. Uitenbroek et al. proposed that the bright spot coincided with the pole of rotation (which is also consistent with the measures of the angle of highest polarization), making the inclination of the rotation axis of the star 20∘ from the line of sight (see Fig. 4). This inclination, coupled with the measured 5 km s-1 rotation velocity suggests that the deprojected radial velocity is 14.6 km s-1, and the rotational period is 25.5 yr at a distance of 191 pc. Thus it appears plausible that the bright spots shown in Fig. 2 emerge preferentially around the pole of the star.
4 Spatially Resolved Spectroscopy
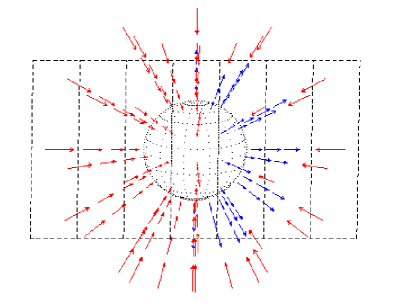
STIS, the Space Telescope Imaging Spectrograph on HST possesses a narrow aperture (25 100 mas) which offers true spatial resolution for the ultraviolet emission lines of Betelgeuse since they have a diameter of 270 mas or larger. In addition, line profiles of several neutral and singly ionized species that occur in the near-ultraviolet exhibit centrally-reversed emission which serves as a diagnostic of mass motions in the atmosphere. Lobel & Dupree (2001) detected changes in many profiles with spatial position on the disk that indicated both outflowing and inflowing chromospheric material with velocities 2 km s-1. These velocities change with position on the disk and also with time. Detailed non-LTE models in spherical geometry were constructed to match the profiles of many lines including Fe I, Fe II, Si I, and Al II. The 4 spectroscopic observations spanned 1.3 yr with sampling of about 0.3 yr. These began at yr corresponding to the times in Fig. 2. Beginning at yr, the flow pattern in the low chromosphere changed from a global decelerating inflow to outflow in one quadrant and subsequently the outflow extended to almost the whole stellar hemisphere (Fig. 5). The spatially resolved spectroscopy reveals that the outer atmosphere of Betelgeuse does not behave in a global fashion but that asymmetric time dependent dynamics are present.
5 Conclusions
When observed as a star, the photosphere and chromosphere of Betelgeuse are subject to a semi-periodic travelling oscillation with a period of 400 days. This period can be coherent for 4 years.
Spatially resolved imaging shows that the image size in the near ultraviolet continuum ( 2550Å) exceeds the optical diameter (taken as 55 mas) by about a factor of 2.2, and the chromospheric Mg II lines extend even further … to a diameter 4 times that of the optical. Bright regions occur on the ultraviolet disk that change in position and strength over a period of months. They appear to be localized around the rotational pole of the star. Spatially resolved spectroscopy demonstrates that the low chromosphere does not behave uniformly, but that the dynamics are complex. We have discovered gradually changing inflow and outflow patterns suggesting asymmetric mass motions. Such behavior obviously complicates the interpretation of the spatially unresolved radial velocity measures.
We acknowledge with thanks the variable star observations from the AAVSO International Database contributed by observers worldwide and used in this research.
References
- (1)
- (2) Bersier, D. 2002, ApJS, 140, 265
- (3)
- (4) Dupree, A. K. 2010, in Physics of Sun and Star Spots, ed. D. P. Choudhary & K. G. Strassmeier, Proc IAU Symp. 273, 188
- (5)
- (6) Dupree, A. K., Baliunas, S. L., Guinan, E. F., Hartmann, L., Nassiopoulos, G. E., & Sonneborn, G. 1987, ApJ, 317, L85
- (7) Gilliland, R. L., & Dupree, A. K. 1996, ApJ, 463, L29
- (8) Harper, G. M., Brown, A., & Guinan, E. F. 2008, AJ, 135, 1430
- (9)
- (10) Henden, A. A., 2012, Observations from the AAVSO International Database, private communication
- (11)
- (12) Hinkle, K. H., Hall, D. N. B., & Ridgway, S. T. 1982, ApJ, 252, 697
- (13)
- (14) Horne, J. H., & Baliunas, S. L. 1986, ApJ., 302, 757
- (15)
- (16) Jorissen, A. 2004, in Asymptotic Giant Branch Stars, ed. H. Habing & H. Olofsson, (Berlin: Springer), p. 461
- (17)
- (18) Lion, S., Van Eck, S., Chiavassa, A., Plez, B., & Jorissen, A. 2013, this volume
- (19)
- (20) Lobel, A., & Dupree, A. K. 2001, ApJ, 558, 815
- (21)
- (22) Lovy, D., Maeder, A., Noels, A. & Gabriel, M. 1984, A&A, 133, 307
- (23)
- (24) Robinson, L. V., & Hoffleit, D. 1932, Harvard College Observatory Bulletin No. 888, 12.
- (25)
- (26) Smith, M. A., Patten, B. M., & Goldberg, L. 1989, AJ, 98, 2233
- (27) Stothers, R. B. 2010, ApJ, 725, 1170
- (28)
- (29) Uitenbroek, H., Dupree, A. K., & Gilliland, R. L. 1998, AJ, 116, 2501