Upper critical field of high quality single crystals of KFe2As2
Abstract
Measurements of temperature-dependent in-plane resistivity , , were used to determine the upper critical field and its anisotropy in high quality single crystals of stoichiometric iron arsenide superconductor KFe2As2. The crystals were characterized by residual resistivity ratio, up to 3000 and resistive transition midpoint temperature, =3.8 K, significantly higher than in previous studies on the same material. We find increased for both directions of the magnetic field, which scale with the increased . This unusual linear scaling is not expected for orbital limiting mechanism of the upper critical field in clean materials.
pacs:
74.70.Dd,72.15.-v,74.25.JbI Introduction
Among several families of iron arsenides showing superconductivity at temperatures up to 56 K Paglione ; CanfieldBudko ; Johnston ; Stewart , very few compounds are stoichiometric. Due to the lack of substitution disorder, these compounds reveal the properties of true clean materials and are characterized by significantly enhanced residual resistivity ratios, up to 80 in LiFeAs (18 K) LiFeAs , 10 in environmentally-doped NaFeAs () TanatarNaFeAs and up to 1500 in KFe2As2 (K122 in the following) ReidK . The superconducting and of the latter material strongly varyFukazawaNMRHC ; Dong ; HashimotoK depending upon sample quality and preparation technique, and are very sensitive to doping with Co ChenCodoping and Na ChenglinNa , suggestive of unconventional superconductivity. Indeed, all studies of the superconducting gap structure in K122 agree on the existence of line nodes FukazawaNMRHC ; Dong ; ChenCodoping ; ChenglinNa ; HashimotoK ; ReidK ; Kawano ; ARPES , however, their location on the multi-band Fermi surface, symmetry-imposed vs. accidental character and relation to or wave symmetry Thomale ; Korshunov are highly debated.
In this study we use high sensitivity of the superconducting transition temperature of KFe2As2 to residual impurities to obtain an insight into another unique feature of iron arsenide superconductors,- unusual temperature dependence of the upper critical field. Terashima et al. TerashimaHc2 reported anisotropic of the K122 crystals with =2.8 K, which revealed very different temperature dependence for magnetic fields parallel and perpendicular to the -axis of the tetragonal crystal, with virtually -linear dependence for . This dependence is different from the expectations of theories for orbital Werthamer, Helfand and Hohenberg (WHH) WHH and paramagnetic CC mechanisms of , both predicting saturation of on . It is also strongly different from saturating found in LiFeAs KyuilHc2LiFeAs ; LiFeAsTerashima ; Balakirev . Recently we found similar -linear dependence in the optimally-doped SrFe2(As1-xPx)2, =0.35 SteveHc2 . Because of the nodal superconducting gap of this compound SrPTDR , we speculated possible link of nodal superconducting gap and the -linear dependence of . On the other hand, -linear dependence of observed in dirty iron-pnictides Gurevich and doped MgB2 GurevichMgB2 was explained in the orbital-limiting model for two-band superconductivity in the dirty limit, as a cross-over regime between usual WHH saturating and upward curving dependences.
In this article, we report synthesis of single crystals of KFe2As2 with up to about 3000 and study their anisotropic upper critical field. We find higher for both directions of magnetic field than found by Terashima et al. TerashimaHc2 . Interestingly, the two data sets for this material, which in both high and low quality samples is in the clean limit, can be matched by a factor corresponding to ratio. As we show, this unusual linear dependence between and is not expected in any theory for clean superconductors for orbital limiting mechanism. We discuss possible important parameters for its explanation.
II Experimental
Single crystals of KFe2As2 were grown using the KAs flux method crystals . It is difficult to grow KFe2As2 by sealing the chemicals in a quartz ampoule because of the strong reaction between the potassium vapor and the silica tube, leading to a serious corrosion. As a way to avoid this problem, Kihou et al. crystals suggested use of stainless steel containers. Alternatively, we developed a sealing technique with liquid tin melt to suppress the evaporation of potassium and arsenic chemicals YLiu . K ingot, As lump, and Fe powder were mixed in atomic ratio of K:Fe:As=5:2:6, and loaded into an alumina crucible. This crucible was covered by a bigger crucible and then mounted in a third alumina crucible with the Sn chunk spread on the bottom, as shown in Fig. 1(a). The effectiveness of Sn-melt sealing technique is guaranteed by the fact that Sn melts at low temperature 232∘C, but boils at high temperature 2602∘C. On the other hand, Sn melt acts as a buffer, which can also dissolve part of potassium and arsenic vapors. By sealing the apparatus shown in Fig. 1(a) in a bigger quartz tube, we could grow large crystals, as shown in Figs.1 (b) and (c), using cooling at a rate of 4∘C/h from 920∘C to 820∘C and at 1 ∘C /h from 820∘C to 620 ∘C.
Crystals with size up to mm3 were extracted from the melt and frequently had leftover KAs flux on the surface. Its presence causes rapid sample degradation in air. The crystals were characterized by MPMS DC SQUID magnetization measurements, as shown in Figs. 2 and 3.
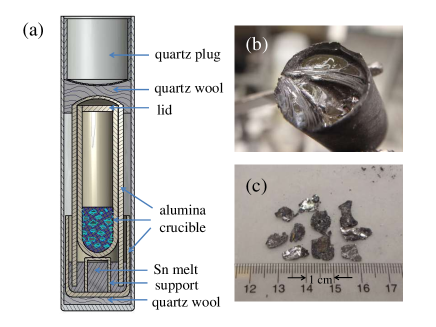
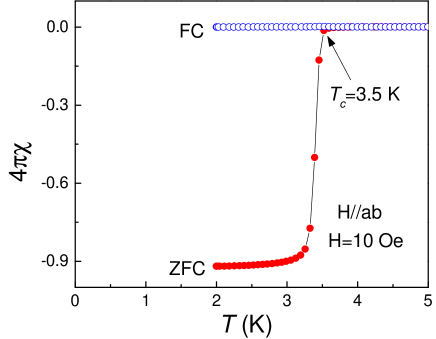
Figure 2 shows temperature-dependent magnetization measured after cooling in zero field, applying a 10 Oe field at base temperature and making measurements on warming above the superconducting transition (zero - field cooling, ZFC) and after cooling in the same magnetic field and measurements on warming (field cooling, FC). Sharp superconducting transition with the width of about 0.3 K in zero-field cooling measurements shows high quality of the single crystals. The field cooling results are similar to other iron-based superconductors showing the absence of the Meissner expulsion in FC measurements, implying an anomalous Meissner effect Prozorov2010b .
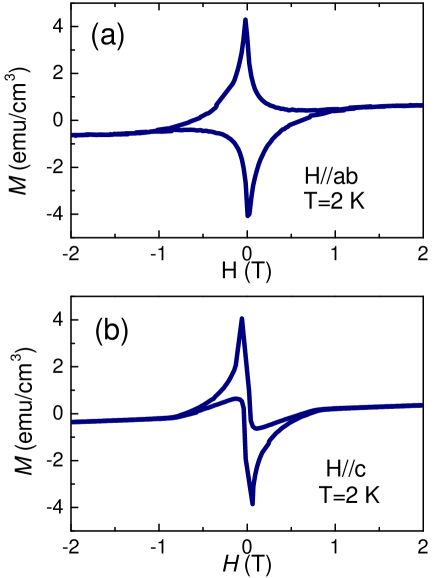
Figure 3 shows magnetization loops measured at 2 K along the plane (panel a) and along the axis (panel b). A clear contribution of asymmetric reversible magnetization and a sharp break at the in the latter measurements indicate low pinning; hence high sample quality consistent with a large = 2500-3000. The pinning is notably larger along the conducting planes, probably indicating the intrinsic pinning contribution on the layered structure, also consistent with a much lower .
During sample preparation for resistivity measurements, we first cleaved slabs from the inner parts of single crystals. These crystal slabs with two cleaved mirror-like surfaces turned out relatively stable. The slabs were further cleaved into bars with typical dimensions of (1- 2)0.5(0.02-0.1) mm3 and long axes parallel to crystallographic direction. All sample dimensions were measured with an accuracy of about 10%. Contacts for four-probe resistivity measurements were made by soldering 50 m silver wires with ultrapure Sn solder, as described in Ref. SUST, . This technique produced contact resistance typically in the 10 range. Resistivity measurements were made in the Quantum Design PPMS system.
The resistivity value at room temperature for our samples was about 300 cm, similar to the values found in previous studies for KFe2As2 crystals ; ReidK , and the value in slightly doped BaK122 Wenrhoa . This slight variation of in the (Ba,K)Fe2As2 system with doping is distinctly different from a rapid decrease of with in Ba(Fe1-xCox)2As2 pseudogap . After removing parts of the crystal exposed to the KAs flux, the samples became relatively stable and their resistivity did not change for a period of a week or so. We selectively measured inter-plane resistivity of some samples using the two-probe technique. The details of the measurement procedure for in-plane and inter-plane, , resistivity measurements can be found in Refs. anisotropy, ; anisotropypure, ; pseudogap, .
Measurements of the upper critical field were made by gluing the sample for measurements with Apiezon N grease to a top or side surfaces of a G10 plastic cube, enabling precise orientation of the sample plane parallel and perpendicular to the magnetic field with an accuracy of about 1∘. Considering relatively flat dependence of on the field inclination angle in this small angular range TerashimaHc2 , this alignment procedure is sufficiently precise. Measurements were completed in two transverse field vs. current configurations , , and , .
III Results
III.1 Residual resistivity ratio
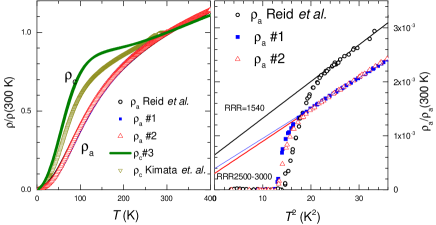
The left panel of Fig. 4 shows temperature-dependent resistivity over a broad temperature range. The right panel shows a zoom of the low-temperature portion, with the data plotted vs. , in the vicinity of the superconducting transition. For reference we show the data for the samples with the highest among previously published data,ReidK and inter-plane resistivity measured in the sample 3 of our batch in comparison with measurements by Kimata et al. Kimata First we notice that the samples grown in different labs show identical , except for the variation of residual resistivity . This fact clearly shows that the difference is caused by very low density of residual impurities/defects, determined by the growth technique, but not variation of sample composition/stochiometry. The defects determining residual resistivity reflect uncontrolled sample chemical contamination during growth and density of non-equilibrium vacancy-interstitial defects at the growth temperature. The density of these defects can be estimated from comparison of the mean free path in our samples (1000 nm), see below, and lattice constants (1 nm), as cm-3. This is negligible to produce any doping in a good metals like KFe2As2 with carrier density higher than 1021cm-3.
While showing complicated temperature dependence over a broad temperature range, with notable crossover at around 200 K, the resistivity at the lowest temperatures follows simple close to dependence, ReidK as expected in Landau Fermi liquid theory. This temperature dependence is most easily seen when plotting vs as shown in the right panel, providing a linear plot. In Fermi liquid theory, the slope of the curves, , is proportional to the square of effective mass, . As can be seen from Fig. 4, this slope remains the same, within error bars, for both high and low quality samples, showing directly that the difference in sample quality is not related to variation of effective mass and hence band structure. This simple linear dependence of vs enables easy extrapolation of the from to . As can be seen from the right panel in Fig. 4, samples 1 and 2 show nearly indistinguishable temperature-dependent resistivity with both and extrapolated significantly lower than in samples by Reid et al., leading to a residual resistivity ratio in the 2500 to 3000 range.
III.2 Upper critical field
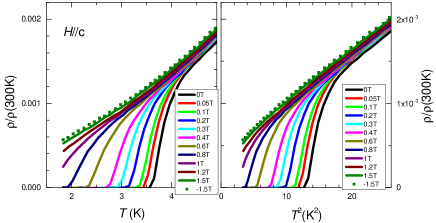
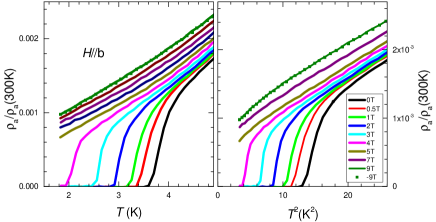
Figure 5 shows temperature-dependent in-plane electrical resistivity of KFe2As2 sample 1 in magnetic fields aligned parallel to tetragonal -axis. Left panel shows plotted vs. , right panel shows the same data plotted vs . Magnetic field values increase from 0 to 1.5 T, sufficient to completely suppress superconductivity at 1.8 K, the base temperature of our apparatus. To check if resistivity measurements in these very low resistivity samples with in 100 to 200 cm range contain contributions from Hall voltage, we reversed the direction of the magnetic field at the highest field of 1.5 T, with the data shown with line and symbols. It is clear the Hall contribution is insignificant in our measurements.
The high purity of our samples can be directly seen from the fact that even at 1.8 K, does not show any sign of saturation, and actually measured resistivity gives 2000. A deviation of the plot from linear can be noticed in the right panel of Fig. 5 for non-zero magnetic fields. While zero-field data follow temperature-dependence above , a crossover with downward curvature at around 2.5 K is seen in at 1.5 T. This crossover is more evident in measurements in around 3 K, see Fig. 6. This crossover feature was reported as an indication of non-Fermi-liquid dependence in initial measurements by Dong et al., Dong however, it was suggested to be superconducting in origin by later experiments Terashimacomment .
IV Discussion
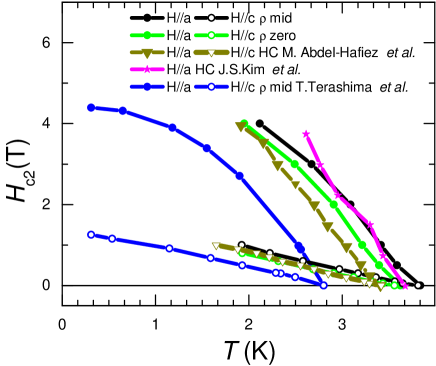
In Fig. 7, we show the magnetic field-temperature phase diagram as determined in our measurements on high quality single crystals, in comparison with measurements on low quality samples in Ref. [TerashimaHc2, ]. The data were determined using a commonly accepted resistive transition midpoint and offset criteria. The former is identical to the criteria used by Terashima et al. TerashimaHc2
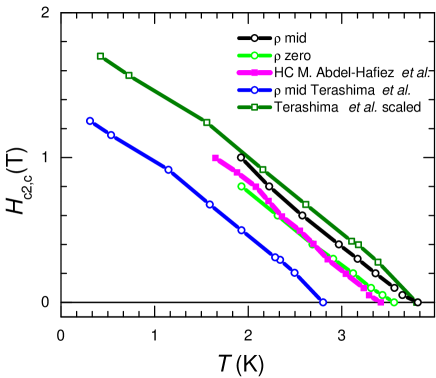
Using midpoint criterion, we obtain the superconducting =3.8 K in zero field, as compared to 2.8 K for samples in Terashima et al. study. TerashimaHc2 This leads to notably higher for both principal directions of the magnetic field. To obtain further insight into the behavior of of KFe2As2, we compare our measurements on highest quality samples with two recent heat capacity studies undertaken on high quality samples (600) Hc2Buechner ; StewartHc2K . These measurements show agreement of two measurement types, despite very different criteria. In view of possible misalignment of the field parallel to the plane, we will focus below on , shown in Fig. 8.
Interestingly, the slope of the curve at turns out to be the same in all measurements. Moreover, by multiplying both and obtained in Terashima et al. TerashimaHc2 study by a factor of ratio, 1.36, we obtain a good match of the data for and reasonable matching for .
For our understanding, it is important that both low quality samples with 80 and extreme quality samples, 2000-3000, are in the clean limit. Indeed, the mean free path of the dirty samples can be estimated as 100 nm, assuming m/s, it is significantly higher in high quality samples. Simultaneously, the coherence length can be estimated from zero-temperature value of using the relation , where G cm2 is magnetic flux quantum, is the coherence length at . For 1.5 T, this gives 20 nm, significantly smaller than the mean free path, so all samples are in the clean regime.
In clean isotropic superconductors, the zero- upper critical field and its slope at scale as WHH
| (1) |
These scalings hold – in clean case – also for anisotropic order parameters on anisotropic Fermi surfaces.KoganProzorov One can write Eq. (2) as
| (2) |
Our results, and const, suggest a curious possibility that in our set of clean samples of KFe2As2 is proportional to the Fermi energy . We are not aware of a theoretical argument in favor of this possibility.
V Conclusions
Measurements of the in-plane electrical resistivity as a function of the magnetic field applied parallel and perpendicular to the tetragonal -axis of the crystal allow us to extrapolate residual resistivity of the samples in the zero field in 100 to 200 cm range and residual resistivity ratio in the 2500 to 3000 range. These high values are in reasonable agreement with resistivity measurements in the normal state achieved by application of the magnetic field 1.5 T at base temperature of 1.8 K, 2000.
The upper critical fields in our samples with =3.8 K significantly increased, compared to those for samples with =2.8 K, but for two sets of samples can be matched well by a simple scaling of . This unusual linear relation is not expected for the orbital limiting mechanism of the upper critical field.
VI Acknowledgments
The work at Ames was supported by the U.S. Department of Energy, Office of Basic Energy Sciences, Division of Materials Sciences and Engineering under contract No. DE-AC02-07CH11358.
References
- (1) J. Paglione and R. L. Greene, Nature Phys. 6, 645 (2010).
- (2) P. C. Canfield and S. L. Bud’ko, Ann. Rev. Cond. Mat. Phys. 1, 27 (2010).
- (3) D. C. Johnston, Adv. Physics. 59 803 (2010).
- (4) G. R. Stewart, Rev. Mod. Phys. 83, 1589 (2011).
- (5) M. A. Tanatar, J.-Ph. Reid, S. Ren de Cotret, N. Doiron-Leyraud, F. Lalibert , E. Hassinger, J. Chang, H. Kim, K. Cho, Yoo Jang Song, Yong Seung Kwon, R. Prozorov, and Louis Taillefer, Phys. Rev. B 84, 054507 (2011).
- (6) M. A. Tanatar, N. Spyrison, Kyuil Cho, E. C. Blomberg, Guotai Tan, Pengcheng Dai, Chenglin Zhang, and R. Prozorov, Phys. Rev. B 85, 014510 (2012).
- (7) J.-Ph. Reid, M. A. Tanatar, A. Juneau-Fecteau, R. T. Gordon, S. Ren de Cotret, N. Doiron-Leyraud, T. Saito, H. Fukazawa, Y. Kohori, K. Kihou, C. H. Lee, A. Iyo, H. Eisaki, R. Prozorov, and Louis Taillefer, Phys. Rev. Lett. 109, 087001 (2012).
- (8) H. Fukazawa, Y. Yamada, K. Kondo, T. Saito, Y. Kohori, K. Kuga, Y. Matsumoto, S. Nakatsuji, H.Kito, P.M. Shirage, K. Kihou, N. Takeshita, C.-H. Lee, A. Iyo, and H. Eisaki, J. Phys. Soc. Jpn. 78 083712 (2009).
- (9) J. K. Dong, S. Y. Zhou, T. Y. Guan, H. Zhang, Y. F. Dai, X. Qiu, X. F. Wang, Y. He, X. H. Chen, and S. Y. Li, Phys. Rev. Lett. 104, 087005 (2010).
- (10) K. Hashimoto, A. Serafin, S. Tonegawa, R. Katsumata, R. Okazaki, T. Saito, H. Fukazawa, Y. Kohori, K. Kihou, Phys. Rev. B 82, 014526 (2010).
- (11) A. F. Wang, S. Y. Zhou, X. G. Luo, X. C. Hong, Y. J. Yan, J. J. Ying, P. Cheng, G. J. Ye, Z. J. Xiang, S. Y. Li, and X. H. Chen , arXiv:1206.2030
- (12) M. Abdel-Hafiez, V. Grinenko, S. Aswartham, I. Morozov, M. Roslova, O. Vakaliuk, S.-L. Drechsler, S. Johnston, D. V. Efremov, J. van den Brink, H. Rosner, M. Kumar, C. Hess, S. Wurmehl, A. U. B. Wolter, B. Buechner, E. L. Green, J. Wosnitza, P. Vogt, A. Reifenberger, C. Enss, and R. Klingeler, arxiv. 1301.5257
- (13) H. Kawano-Furukawa, C. J. Bowell, J. S. White, R. W. Heslop, A. S. Cameron, E. M. Forgan, K. Kihou, C. H. Lee, A. Iyo, H. Eisaki, T. Saito, H. Fukazawa, Y. Kohori, R. Cubitt, C. D. Dewhurst, J. L. Gavilano, and M. Zolliker, Phys. Rev. B 84, 024507(2011).
- (14) K. Okazaki,Y. Ota, Y. Kotani, W. Malaeb, Y. Ishida, T. Shimojima, T. Kiss, S. Watanabe, C.-T. Chen, K. Kihou, C. H. Lee, A. Iyo, H. Eisaki, T. Saito, H. Fukazawa, Y. Kohori, K. Hashimoto, T. Shibauchi, Y. Matsuda, H. Ikeda, H. Miyahara, R. Arita, A. Chainani, and S. Shin, Science 337, 1314 (2012).
- (15) Ronny Thomale, Christian Platt, Werner Hanke, Jiangping Hu, and B. Andrei Bernevig, Phys. Rev. Lett. 107, 117001 (2011).
- (16) S. Maiti, M. M. Korshunov, and A. V. Chubukov, Phys. Rev. B 85, 014511 (2012).
- (17) Taichi Terashima, Motoi Kimata, Hidetaka Satsukawa, Atsushi Harada, Kaori Hazama, Shinya Uji, Hisatomo Harima, Gen-Fu Chen, Jian Lin Luo, and Nan-Ling Wang, J. Phys. Soc. Jpn. 78, 063702 (2010).
- (18) N.R. Werthamer, E. Helfand, and P.C. Hohenberg, Phys. Rev. 147, 295 (1966).
- (19) A.M. Clogston, Phys. Rev. Lett. 9, 266 (1962); B.S. Chandrasekhar, Appl. Phys. Lett. 1, 7 (1962).
- (20) K. Cho, H. Kim, M. A. Tanatar, Y. J. Song, Y. S. Kwon, W. A. Coniglio, C. C. Agosta, A. Gurevich, and R. Prozorov, Phys. Rev. B 83, 060502 (2011).
- (21) Nobuyuki Kurita, Kentaro Kitagawa, Kazuyuki Matsubayashi, Ade Kismarahardja, Eun-Sang Choi, James S. Brooks, Yoshiya Uwatoko, Shinya Uji, and Taichi Terashima, J. Phys. Soc. Jpn. 80, 013706 (2011).
- (22) J. L. Zhang, L. Jiao, F. F. Balakirev, X. C. Wang, C. Q. Jin, and H. Q. Yuan, Phys. Rev. B 83, 174506 (2011).
- (23) S. Yeninas, M. A. Tanatar, J. Murphy, C. P. Strehlow, O. E. Ayala-Valenzuela, R. D. McDonald,U. Welp, W. K. Kwok, T. Kobayashi,S. Miyasaka, S. Tajima, and R. Prozorov, Phys. Rev. B 87, 094503 (2013).
- (24) J. Murphy, C. P. Strehlow, K. Cho, M. A. Tanatar, N. Salovich, R. W. Giannetta, T. Kobayashi, S. Miyasaka, S. Tajima, and R. Prozorov, arXiv:1301.6396.
- (25) A. Gurevich, Rep. Progr. Phys. 74, 124501 (2011).
- (26) W. Dai, V. Ferrando, A. V. Pogrebnyakov, R. H. T. Wilke, Ke Chen, Xiaojun Weng, J. Redwing, Chung Wung Bark, Chang-Beom Eom, Y. Zhu, P. M. Voyles, D. Rickel, J. B. Betts, C. H. Mielke, A. Gurevich, D. C. Larbalestier, Q. Li, and X. X. Xi, Supercond. Sci. Technol.24, 125014 (2011).
- (27) Kunihiro Kihou, Taku Saito, Shigeyuki Ishida, Masamichi Nakajima, Yasuhide Tomioka, Hideto Fukazawa, Yoh Kohori, Toshimitsu Ito, Shin-ichi Uchida, Akira Iyo, Chul-Ho Lee, and Hiroshi Eisaki, J. Phys. Soc. Jpn. 79, 124713 (2010).
- (28) Yong Liu and C. T. Lin, 5th International Workshop on Crystal Growth Technology (Berlin, 2011).
- (29) R. Prozorov, M. A. Tanatar, B. Shen, P. Cheng, H. H. Wen, S. L. Bud’ko and P. C. Canfield, Phys. Rev. B 82, 180513 (2010).
- (30) M. A. Tanatar, N. Ni, S. L. Bud’ko, P. C. Canfield, and R. Prozorov, Supercond. Sci. Technol. 23, 054002 (2010).
- (31) Bing Shen, Huan Yang, Zhao-Sheng Wang, Fei Han, Bin Zeng, Lei Shan, Cong Ren, and Hai-Hu Wen, Phys. Rev. B 84, 184512 (2011).
- (32) M. A. Tanatar, N. Ni, A. Thaler, S. L. Bud’ko, P. C. Canfield, and R. Prozorov, Phys. Rev. B 82, 134528 (2010).
- (33) M. A. Tanatar, N. Ni, C. Martin, R. T. Gordon, H. Kim, V. G. Kogan, G. D. Samolyuk, S. L. Bud’ko, P. C. Canfield, and R. Prozorov, Phys. Rev. B 79, 094507 (2009).
- (34) M. A. Tanatar, N. Ni, G. D. Samolyuk, S. L. Bud’ko, P. C. Canfield, and R. Prozorov, Phys. Rev. B 79, 134528 (2009)
- (35) M. Kimata, T. Terashima, N. Kurita, H. Satsukawa, A. Harada, K. Kodama, A. Sato, M. Imai, K. Kihou, C. H. Lee, H. Kito, H. Eisaki, A. Iyo, T. Saito, H. Fukazawa, Y. Kohori, H. Harima, S. Uji , Phys. Rev. Lett. 105, 246403 (2010).
- (36) Taichi Terashima, Motoi Kimata, Nobuyuki Kurita, Hidetaka Satsukawa, Atsushi Harada, Kaori Hazama, Motoharu Imai, Akira Sato, Kunihiro Kihou, Chul-Ho Lee, Hijiri Kito, Hiroshi Eisaki, Akira Iyo, Taku Saito, Hideto Fukazawa, Yoh Kohori, Hisatomo Harima, and Shinya Uji, Phys. Rev. Lett. 104, 259701 (2010).
- (37) M. Abdel-Hafiez, S. Aswartham, S. Wurmehl, V. Grinenko, S.-L. Drechsler, S. Johnston, A.U.B. Wolter, B. Buechner, and H. Rosner, Phys. Rev. B 85, 134533 (2012).
- (38) J. S. Kim, E. G. Kim, G. R. Stewart, X. H. Chen, and X. F. Wang, Phys. Rev. B 83, 172502 (2011).
- (39) V. G. Kogan and R. Prozorov, Rep. Prog. Phys. 75, 114502 (2012).