Radiation pressure excitation of test mass ultrasonic modes via three mode opto-acoustic interactions in a suspended Fabry- cavity
Abstract
Three-mode parametric-instabilities risk stable operation of gravitational-wave detectors. Instabilities occur through time varying radiation-pressure distributions, derived from beating between two optical modes, exciting mirror acoustic modes in Fabry- cavities. Here we report the first demonstration of radiation-pressure driving of ultrasonic-acoustic modes via pairs of optical modes in gravitational-wave type optical cavities. In this experiment of TEM01 mode and of TEM00 mode circulated inside the cavity, an excitation was observed with amplitude . The results verify the driving force term in the parametric instability feedback model[1]. The interaction parametric gain was and mass-ratio scaled opto-acoustic overlap .
keywords:
Parametric Instability , Three mode interaction , Gravitational waves1 Introduction
Advanced laser interferometer gravitational wave detectors now under construction [2] [3] aim to achieve a strain sensitivity at . To achieve this sensitivity without recourse to quantum squeezing, it is necessary to balance the shot noise and the radiation pressure noise. To achieve this balance at requires the optical power in the arm cavities to approach . These conditions are also such that three mode parametric interactions can become strong, giving rise to parametric instability [4]. Such instability arises when the thermal noise fluctuations in the surface profile of a cavity mirror (for a particular high quality factor mirror acoustic mode), scatters carrier light into a transverse optical mode. The scattered mode in turn beats with the fundamental cavity mode. The beating creates a time varying radiation pressure force distribution on the mirror. If the force distribution overlaps the acoustic mode shape, and if the transverse mode is resonant in the cavity and has the appropriate phase, the radiation pressure force acts in phase with the thermal fluctuations, thereby providing a positive feedback. If this feedback force is large enough, it can overcome the acoustic losses of the mode, leading to exponential growth of the acoustic mode. The Stokes interaction, for which the cavity transverse mode is lower than the carrier frequency, satisfies the phase requirement.
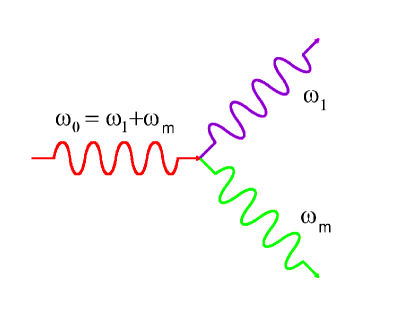
It is instructive to consider the interaction in the quantum picture as illustrated by the Feynman diagram in figure 1. The high occupation number of the carrier ensures that the 3-mode interaction (represented by a 3-quanta vertex) is dominated by photon-phonon pair creation. A carrier photon decays coherently into a transverse mode photon and a phonon. The phonons contribute to the occupation number of the acoustic mode, and if the rate of this process exceeds the thermal relaxation rate of the mode, the acoustic mode occupation number will increase with time. The process is only efficient for opto-acoustic systems that satisfy a triple resonance condition, and even when resonant, high optical power is required to achieve instability in gravitational wave detectors. Triple resonance means that the carrier, the transverse mode and the acoustic mode must satisfy where is the carrier frequency, is the transverse mode frequency and is the acoustic mode frequency.
Braginsky et al. [4] derived the parametric gain (see equation 1) of the parametric instability process from a classical viewpoint. If the parametric gain exceeds unity for a particular acoustic mode, the mode will grow exponentially. The experiment described here is part of a research program aiming to determine the best way of controlling instability.
| (1) |
Here is the stored power in the cavity, represents the mechanical oscillator, subscripts and denote the Stokes and anti-Stokes modes, represents the quality factors of the mechanical and optical modes, is the mass of the test mass, is the length of the cavity, represent the optical mode relaxation rates and the overlap factors (which include the mass ratio between the test mass total mass and the mechanical oscillator effective mass).
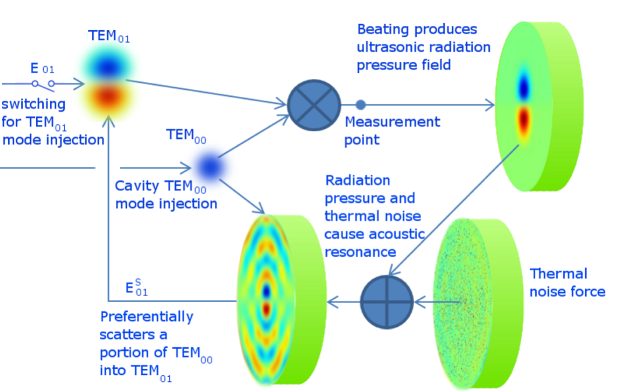
In the configuration of current experiment (near flat-flat cavity), only the anti-Stokes process satisfies the resonance condition. A miniature system with the same configuration might find application in macroscopic quantum experiments [5], in which the triple resonance reduces the power requirement significantly for reaching the quantum noise limit [6]. Three-mode parametric instability can be broken down into components in the feedback loop model [7]. Two of these have been verified: a) Thermal tuning: It was predicted in 2005 that PI can be tuned through thermally induced radius of curvature variations in the cavity mirrors [8]. This tuning of the resonant interaction was demonstrated in 2008 [9]. b) Acoustic generation of transverse optical modes: The acoustic generation of a specific resonant transverse mode has amplitude determined by the overlap parameter – a number that determines the overlap between the acoustic and optical modes. This was reported by Zhao et al [10]. In 2011 thermally excited transverse modes were detected, and three mode interactions were shown to enable high sensitivity spectroscopy of thermally excited acoustic modes [11]. The third component of three mode interactions is the one that closes the feedback loop: radiation pressure excitation via the beating of the carrier with a low amplitude transverse mode. Here we report the first observation of such radiation pressure excitation in a long optical cavity designed as a sub-scale version of a gravitational wave detector cavity. The specific interaction being studied is the three mode interaction between a TEM00 mode, a TEM01 mode tuned about above the TEM00 and a mirror acoustic mode at . The system is shown schematically in figure 2. The cavity power is only about , and spontaneous parametric instability cannot be achieved. However by artificially increasing the transverse mode power we can mimic the conditions of instability, and measure the excitation of the acoustic mode by observing its free ring down. This mechanism would result in instability if the parametric gain was greater than unity [1]. In the experiment described here we used the anti-Stokes process which normally induces cooling rather than instability. The first term inside the bracket of equation 1 is negligible because of is very large. However, in our experiment the parametric gain . To mimic the high gain regime we artificially generate TEM01 power. Our results are dominated by the inserted TEM01 power. In this situation the parametric gain has little effect on the results, although in a higher power experiment the negative parametric gain would lead to suppression of the driving term. In this experiment the use of the anti-Stokes process to demonstrate the radiation pressure excitation does not lead to loss of generality.
2 Experimental Setup
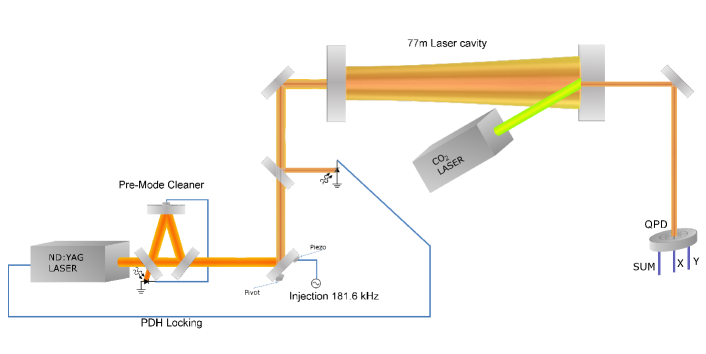
The experimental layout is shown in Figure 2. The Nd:YAG laser (1064) is frequency locked to the 80 suspended cavity. The laser beam first passes through a pre-mode cleaner (PMC) to create a pure TEM00 mode. The beam from the PMC is reflected by a piezo actuated mirror. The actuator is driven at a frequency matched to the mechanical resonant mode of the end test mass (ETM) mirror to generate TEM01 mode modulation sidebands. The TEM00 mode carrier with TEM01 mode sidebands are injected into the 80 suspended cavity. The CO2 laser power is adjusted to tune the radius of curvature of the ETM until the cavity mode frequency gap between TEM01 mode and TEM00 mode matches the ETM acoustic mode frequency. This causes the TEM00 carrier and a single TEM01 sideband to resonate simultaneously inside the cavity. The beat frequency between the TEM00 and TEM01 is precisely tuned to the resonant frequency of the acoustic mode of interest of the ETM, at . The transmitted beam is monitored using the quadrant photo-detector (QPD). When the TEM01 is being injected, the QPD mainly measures the amplitude of the transmitted TEM01 mode. After the driving is stopped, the QPD measures the TEM01 mode amplitude generated by acoustic mode scattering, and therefore the amplitude of the acoustic mode. The measured ring-down curve of the signal after the excitation is switched off proves the radiation pressure excitation of the acoustic mode.
3 Experimental Results
Assuming that the injected TEM00 mode and TEM01 mode amplitude inside the cavity are and , the excitation drives the acoustic mode amplitude to that scatters a part of the TEM00 mode into TEM01 mode with amplitude of . If the power transmission of the ETM is , the QPD detection efficiency is , then the output of the QPD at the acoustic mode frequency and the DC component are;
| (2) |
| (3) |
Immediately after turning off the driving , the output of the QPD at the acoustic mode frequency is:
| (4) |
Here is proportional to the acoustic mode amplitude and should ring down as the acoustic mode rings down. In the case of current experiment, the parametric gain is much smaller than unity. Hence the TEM01 created by scattering should be much smaller than the driving field, i.e: . The parametric gain in the feedback loop model is the open loop gain. If we break the loop at the TEM01 injection point and measure relative to , then the parametric gain is given by:
| (5) |
Here we define time zero as the time that the driving signal is stopped. By measuring the ring down time we obtain the Q-factor of the acoustic mode. Note that when there is no injection of the driving field, the thermal excitation is the dominate source of the acoustic mode vibration. If the parametric gain was large, it would act to damp the ring-down signal. However for this experiment the low value of means that this effect is very small.
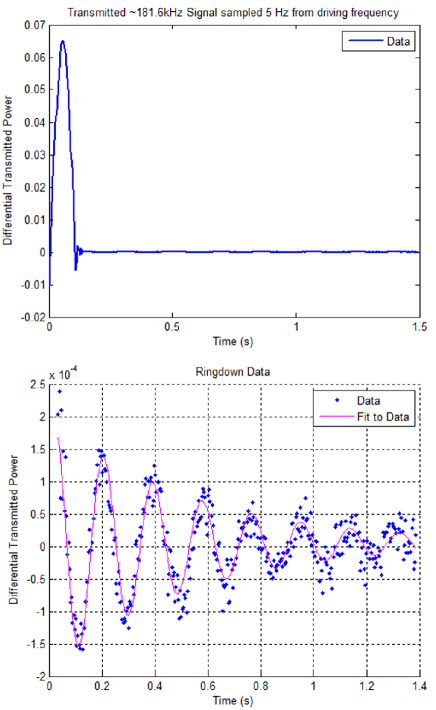
Figure 4 shows the output of the QPD y axis. Initially, the injection of the driving TEM01 mode field transmitted through the cavity, beats with the TEM00 mode field and creates a high amplitude output at . The spectrum analyzer is used to down-convert the signal frequency to for easy detection, with amplitude of . In the top curve of figure 4, the driving applied to the PZT was turned off at (top). The QPD output then can only be seen in the zoomed in graph (bottom curve figure 4) because of the small amplitude. In this figure the reference time (the moment the driving was turned off) has been set to zero. The measurement presented here could be affected by the cavity ring down time and by electromagnetic transients. For this reason the first 0.035 seconds are not used in the analysis. We can clearly see the ring-down curve after turning off the driving. The curve fitting of the ring-down curve shows the ring-down time of , corresponding to a mechanical Q-factor of . The ring-down amplitude at the time the driving was turned off was . Using equation 5 we use this result to determine the parametric gain . Using equation 1 we can now determine the mass scaled overlap factor to be , , using the effective mass ratio of from the ANSYS simulations, this can be translated to a naught to unity bounded overlap factor of approximately 0.21. The following parameters were used in the experiment:
| (6) |
The overlap parameter derived experimentally is about 51% of the expected value for perfect alignment of the optical and acoustic modes used in this experiment. In multiple experiments we observed high sensitivity to alignment. This was expected because the overlap parameter is strongly modulated by lateral displacement of the optical modes relative to the test mass acoustic modes as investigated by Heinert et al [12]. This also points to a simple method of reducing the parametric gain of a single mode near the threshold of instability, by finely adjusting the spot positions on the mirror test masses.
4 Conclusion
By injecting a high order mode simultaneously with the fundamental mode into an optical cavity we have demonstrated the radiation pressure driving term in the theory of three mode parametric instability. We have demonstrated a simple method for measuring the parametric gain and the overlap factor of three mode interactions at relatively low optical power. The technique can be used in long baseline interferometer gravitational wave detectors to identify and characterize potentially unstable acoustic modes in situ when the detector is operating at low optical power. This can allow the design of appropriate control schemes that will mitigate instabilities that will occur when sensitivity demands require operation at high optical power. We have also shown that parametric gain can be tuned by adjusting the laser beam spot positions so as to change the opto-acoustic overlap parameter.
5 Acknowledgements
The authors gratefully acknowledge the support of the LIGO Scientific Collaboration, and especially the optics working group and the LSC Gingin Advisory Committee. The authors also gratefully acknowledge the Australian Consortium for Gravitational Astronomy, the Australian Research Council, and the Western Australian Centre of Excellence in Science and Innovation program.
References
- [1] V.B. Braginsky et al,Phys Lett. A 287 (2001) 311.
- [2] G.M. Harry,Classical and Quantum Gravity, 27-8 (2012) 084006.
- [3] The VIRGO project Web site, http://www.virgo.infn.it/ Nov 2012.
- [4] V.B. Braginsky, S. Strigin, S. Vyatchanin, Phys. Lett. A293 (2002) 228.
- [5] C. Zhao, at al. Phys. Rev. Lett. 102 (2009) 243902
- [6] J. M. Dobrindt and T. J. Kippenberg, Phys. Rev. Lett. 104, (2010) 033901
- [7] M. Evans, et al., Phys. Lett. A 344 (2010) 4-665
- [8] C. Zhao, L. Ju, J. Degallaix, et al., Phys. Rev. Lett. 94 (2005) 12110
- [9] H. Miao, C. Zhao, L. Ju, et al., Phys. Rev. A 78 (2008) 063809.
- [10] C. Zhao, et al., Phys. Rev. A 78-2 (2008) 023807.
- [11] C. Zhao, Q. Fang, S. Susmithan, et al., Phys. Rev. A, 84 (2011) 06
- [12] D. Heinert,S.E. Strigin, Phys. Lett. A, 375-43 (2011) 3804-3810