Istituto Nazionale di Ricerca Metrologica (INRIM), Strada delle Cacce 91, 10135 Torino, Italy
Istituto dei Sistemi Complessi, ISC-CNR Roma, Italy
ETH Zurich, Switzerland
Superconducting-Insulator Transition in Disordered Josephson Junctions Networks
Abstract
The superconducting-insulator transition is simulated in disordered networks of Josephson junctions with thermally activated Arrhenius-like resistive shunt. By solving the conductance matrix of the network, the transition is reproduced in different experimental conditions by tuning thickness, charge density and disorder degree. In particular, on increasing fluctuations of the parameters entering the Josephson coupling and the Coulomb energy of the junctions, the transition occurs for decreasing values of the critical temperature and increasing values of the activation temperature . The results of the simulation compare well with recent experiments where the mesoscopic fluctuations of the phase have been suggested as the mechanism underlying the phenomenon of emergent granularity in otherwise homogeneous films. The proposed approach is compared with the results obtained on TiN films and nanopatterned arrays of weak-links, where the superconductor-insulator transition is directly stimulated.
Although superconductivity has been predicted to persist even in the presence of impurities Anderson , a superconducting insulating transition (SIT) has been observed in strongly disordered metals Finkelstein ; Jaeger ; Fisher ; Trivedi ; Wallin ; Yazdani ; Hsu . A ‘fermionic’ phenomenon explaining the superconducting-insulating transition is related to the suppression of the Cooper pairing by the enhancement of the Coulomb repulsion between electrons with increasing disorder. An alternative ‘bosonic’ phenomenon driving the transition is related to the phase fluctuations that could cause pair breaking and destroy the superconducting energy gap. Spatial inhomogeneities of the order parameter might lead to complex effects due to the formation of islands with nonnegligible superconducting order parameter embedded in an insulating matrix Ghosal ; Galitski ; Skvortsov ; Sacepe ; Dubi ; Bouadim .
Recent investigations carried out in homogeneous thin films by tuning disorder, electric or magnetic field pointed to a mechanism of self-induced granularity Shahar ; Sambandamurthy ; Baturina ; Baturina2 ; Sarwa . The emergent collective insulating state exhibits threshold voltage depinning behavior and thermally activated resistance described by an Arrhenius-like exponential law. In spite of the homogeneity, such systems have been thus envisioned to behave as networks of Josephson junctions, where the onset of the insulating phase requires the Coulomb energy :
| (1) |
be larger than the coupling energy of the Josephson junction:
| (2) |
Different mechanisms leading to the superconducting-insulating transition very likely coexist in such complex electronic systems with collective insulating states emerging within the homogeneous structure.
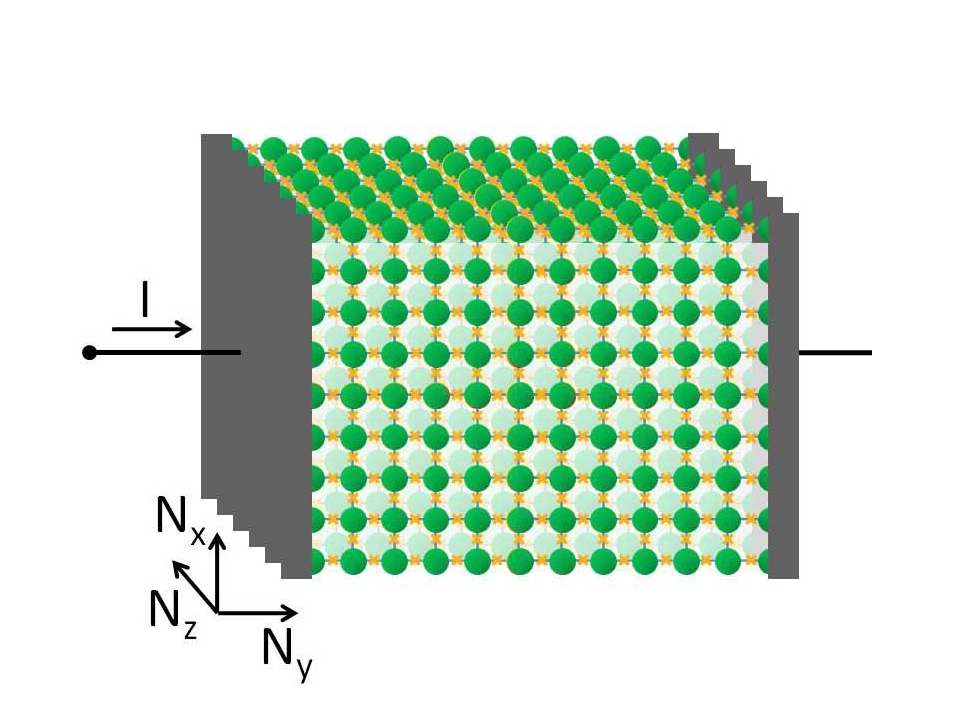
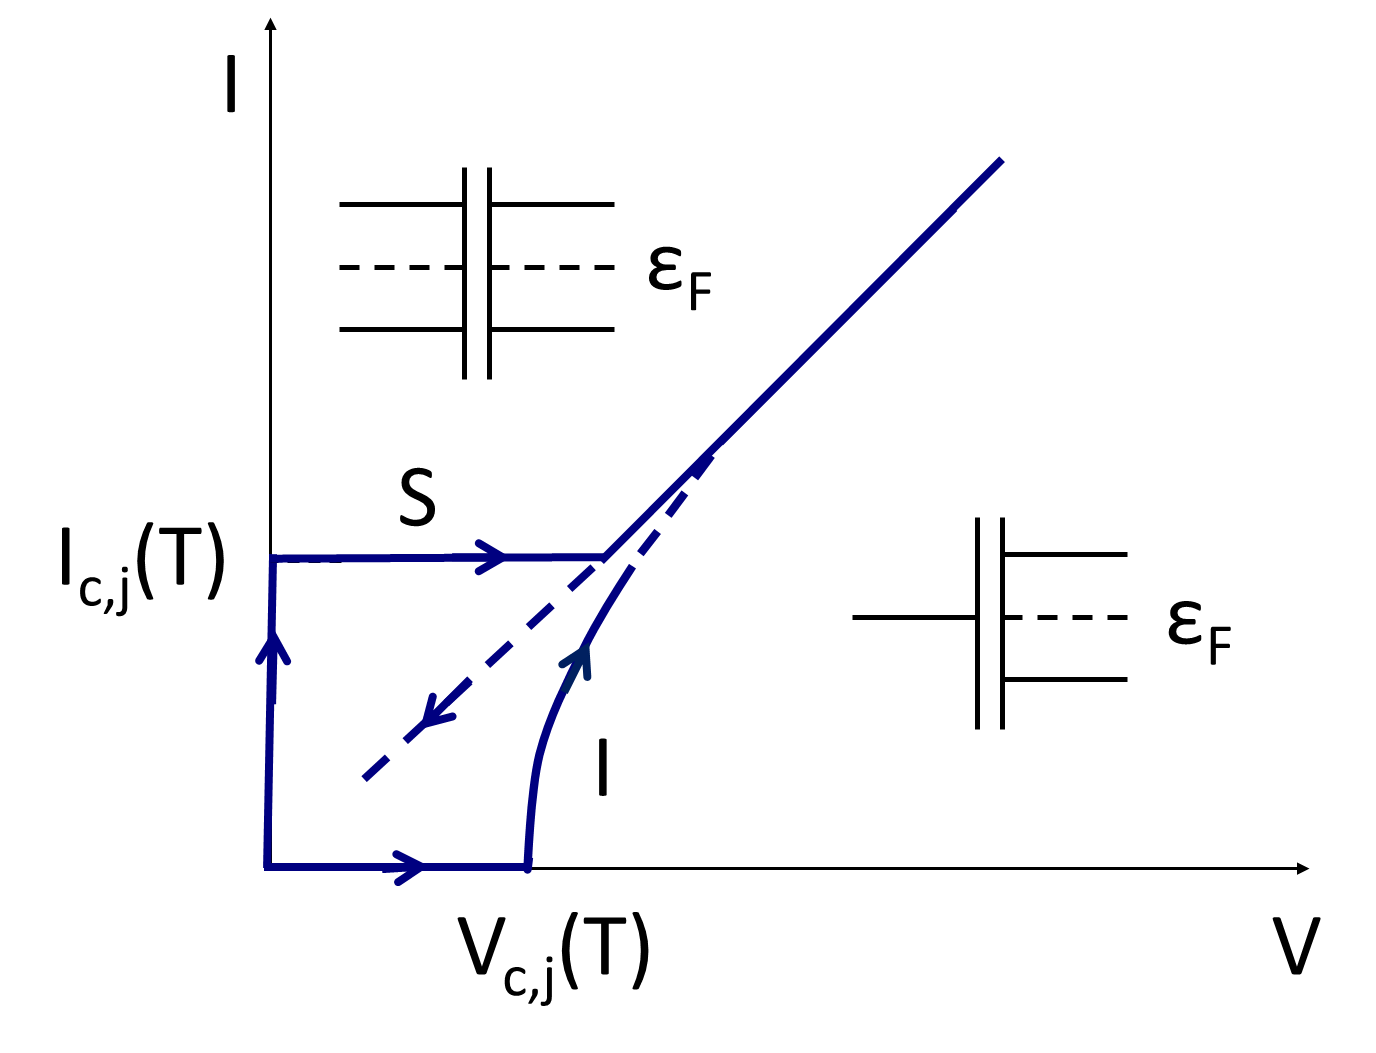
In this work, the “self-induced granularity” is modelled by disordered networks of Josephson junctions Efetov ; Bradley ; Granato ; Yu ; Otterlo ; vanDerZant ; Beloborodov ; Syzranov . The superconductor-insulator transition is simulated by solving the conductance matrix of Josephson junctions. The networks are biased by a constant current generator , as sketched in Fig. 1. The superconductive, intermediate and resistive state of each Josephson junction is set according to each single current-voltage characteristic which is shown in Fig. 2. The approach was previously used to investigate the normal-superconductive transition and the current fluctuation power spectra in Ponta .
It is shown that an Arrhenius-like dissipation mechanism in the shunted Josephson junction induces the insulating phase. Furthermore, the resistance variation observed in the array well compares with the experimental results of the superconducting-insulator transition in homogeneous and nanopatterned TiN films Baturina ; Baturina2 .
As already mentioned, the resistance in the insulating state depends on temperature according to an Arrhenius-like exponential as found in many experiments Shahar ; Sambandamurthy ; Baturina ; Baturina2 ; Sarwa . The resistance of the Josephson junction array is proportional to the resistance of each weakly linked Josephson junction according to the relationship:
| (3) |
where the subscript identifies a single junction, while , and indicate the total number of Josephson junctions respectively in the , and directions as shown in Fig. 1. The resistance of each Josephson junction is taken of the form:
| (4) |
with the activation temperature and the normal state resistance of each junction. The exponent takes values in the range to . Specifically, corresponds to the Arrhenius law, while fractional values of feature variable range hopping transport. Experiments have shown that holds on the insulating side of the transition at low temperatures, while variable range hopping transport with exponent or are likely to occur over the normal side of the transition at higher temperatures. The activation temperature is related to the parameters of the junction through:
| (5) |
This relationship means that a Cooper pair, in the superconducting islands separated by insulating barrier of each junction , is firstly broken by supplying an energy . Then the charge is redistributed in each tunnel capacitance by supplying an additional amount of energy . When the Coulomb energy is larger than the Josephson coupling, the value of the activation temperature is thus mostly determined by the value of the junction capacitance.
It is worth noting that the dimensionless tunneling conductance of the Josephson junction is defined as:
| (6) |
where is the average conductance between adjacent grains and is the quantum conductance. The average conductance of the array can be obtained as the reciprocal of average resistance defined by Eq. (4).
It has been observed both theoretically and experimentally that when the average tunneling conductance is greater than the quantum conductance, i.e. when , which corresponds to strong coupling between grains, a superconducting state is achieved at low temperature. Conversely, when , which corresponds to weak coupling between grains, an insulating state emerges at low temperature Beloborodov . This phenomenon can be explained by the existence of an additional dissipative channel due to single electrons tunneling between grains, resulting in an effective Coulomb energy:
| (7) |
By comparing Eqs. (2) and (7), one can note that is always larger than for , implying a superconducting ground state. Conversely, for , is smaller than , allowing the onset of an insulating state. Both the numerical and qualitative description clearly show, that a superconducting insulator transition occurs as compares with (disorder and temperature induced superconducting insulator transition) which ultimately corresponds to compare Josephson and Coulomb coupling through the average tunneling conductance of the array and the consequent coexistence of the fundamental mechanisms underlying the superconducting insulator transition described above.
The state (superconductive, normal, insulating) of each Josephson junction in the array is set according to each current voltage (I-V) characteristics. In the I-V curve represented in Fig. 2, and represent the critical current and the critical voltage of a single Josephson junction . For the superconductive branch (upper branch) of the I-V characteristics, the normal resistive state is achieved when the bias current flowing through the junction exceeds the critical current . For the insulating branch (lower branch) of the I-V characteristics, the normal resistive state is achieved when the bias voltage across each junction exceeds the critical voltage .
The critical current is a function of temperature according to the following linearized equation:
| (8) |
where is the lowest temperature critical current. An analogous relationship holds for the critical field . To simulate the network disorder, the critical current , the critical field and the activation temperature are taken as random variables, which fluctuate around their average value according to a Gaussian distribution with standard deviation Ponta .
The average resistance of the network depends on elementary shunt resistance through the linear relationship Eq. (3). Therefore, the variation , which is a measure of the slope of the transition, depends on bias current , on temperature and magnetic field , through the variation of the elementary shunt resistance of each weak-link:
| (9) |
The terms on the right hand side of Eq. (9) will be now related to the relevant parameters of the junctions and used in the simulation. The first and second terms on the right hand side of Eq. (9) can be written as and . The term can be written as derivative of a compound function:
| (10) |
Moreover, from Eq. (8), . A similar relation holds for the derivative of the critical field with respect to . On account of the relation and , one obtains that the slope of the resistive transition is related to the disorder degree . Since it is and , Eq. (9) shows that if either or increases, decreases.
The quantity turns out to be proportional to the slope of the resistive transition curve, which is smoother when either or increases, i.e. when the disorder increases. Therefore, the disorder enters the simulation directly by varying the parameter . The disorder degree is strongly dependent upon the temperature along the transition as the Josephson phase fluctuations depend on . For the sake of simplicity and because the work is mostly aimed at reproducing the transition from the superconducting to the insulating phase at a given low temperature, the simulations have been performed at constant value of along the superconducting normal transition curve.
Additionally, the SIT transition is shown to occur either when thickness decreases or when current increases, while the parameter is kept constant. The aim of these simulations is to show that external drives, such as bias current or thickness variation, directly act on the network as “disorder enhancer” and trigger the onset of the insulating phase. The temperature dependence of the disorder () would further accelerate the occurrence of the insulating phase in such cases as well.
The simulations of the superconductor-insulator transition in the Josephson junction arrays are performed as a function of the temperature in the range to by using different tuning parameters, as electric field, thickness and disorder degree. The resistive shunt is taken of the standard Arrhenius law form with .
Figure 3 shows the superconductor-insulator transition when the temperature increases and the bias current is kept constant in two-dimensional disordered networks. Different curves correspond to different disorder, i.e. to different values of . By increasing temperature, the current of each junction decreases according to Eq. (8). As becomes smaller than the bias current flowing through each junction, the junction becomes resistive. In the ideal case of a network with no disorder, it is and the transition curve is vertical. All the Josephson junctions have the same critical current, become resistive at the same temperature and the transition occurs simultaneously all through the network. For the curves shown in Fig. 3, the average value of the normal resistance is taken equal to and the average value of the critical temperature for . Moreover, when the activated conduction processes are negligible, so that the average value of the activation temperature can be taken equal to zero, . The average value of the critical current is .
As disorder increases ( increases accordingly), the resistance changes more smoothly due to the wider spread of the values. Upon further disorder increase, the transition becomes smoother and smoother and for even larger disorder the network becomes an insulator. As observed in many experiments, in the case of the standard Arrhenius law, the average value of the activation temperature is of the same order of magnitude of . Both and are related to the disorder in the film, however decreases while the average value of increases as disorder increases. One can assume implying that increases when disorder increases. By increasing the value of the critical temperature decreases accordingly. The average values of the activation temperature corresponding to each curve range from , for , to , for , with step 1. The values of the parameters used in these simulations are in the range of experimental values reported in Baturina ; Baturina2 .
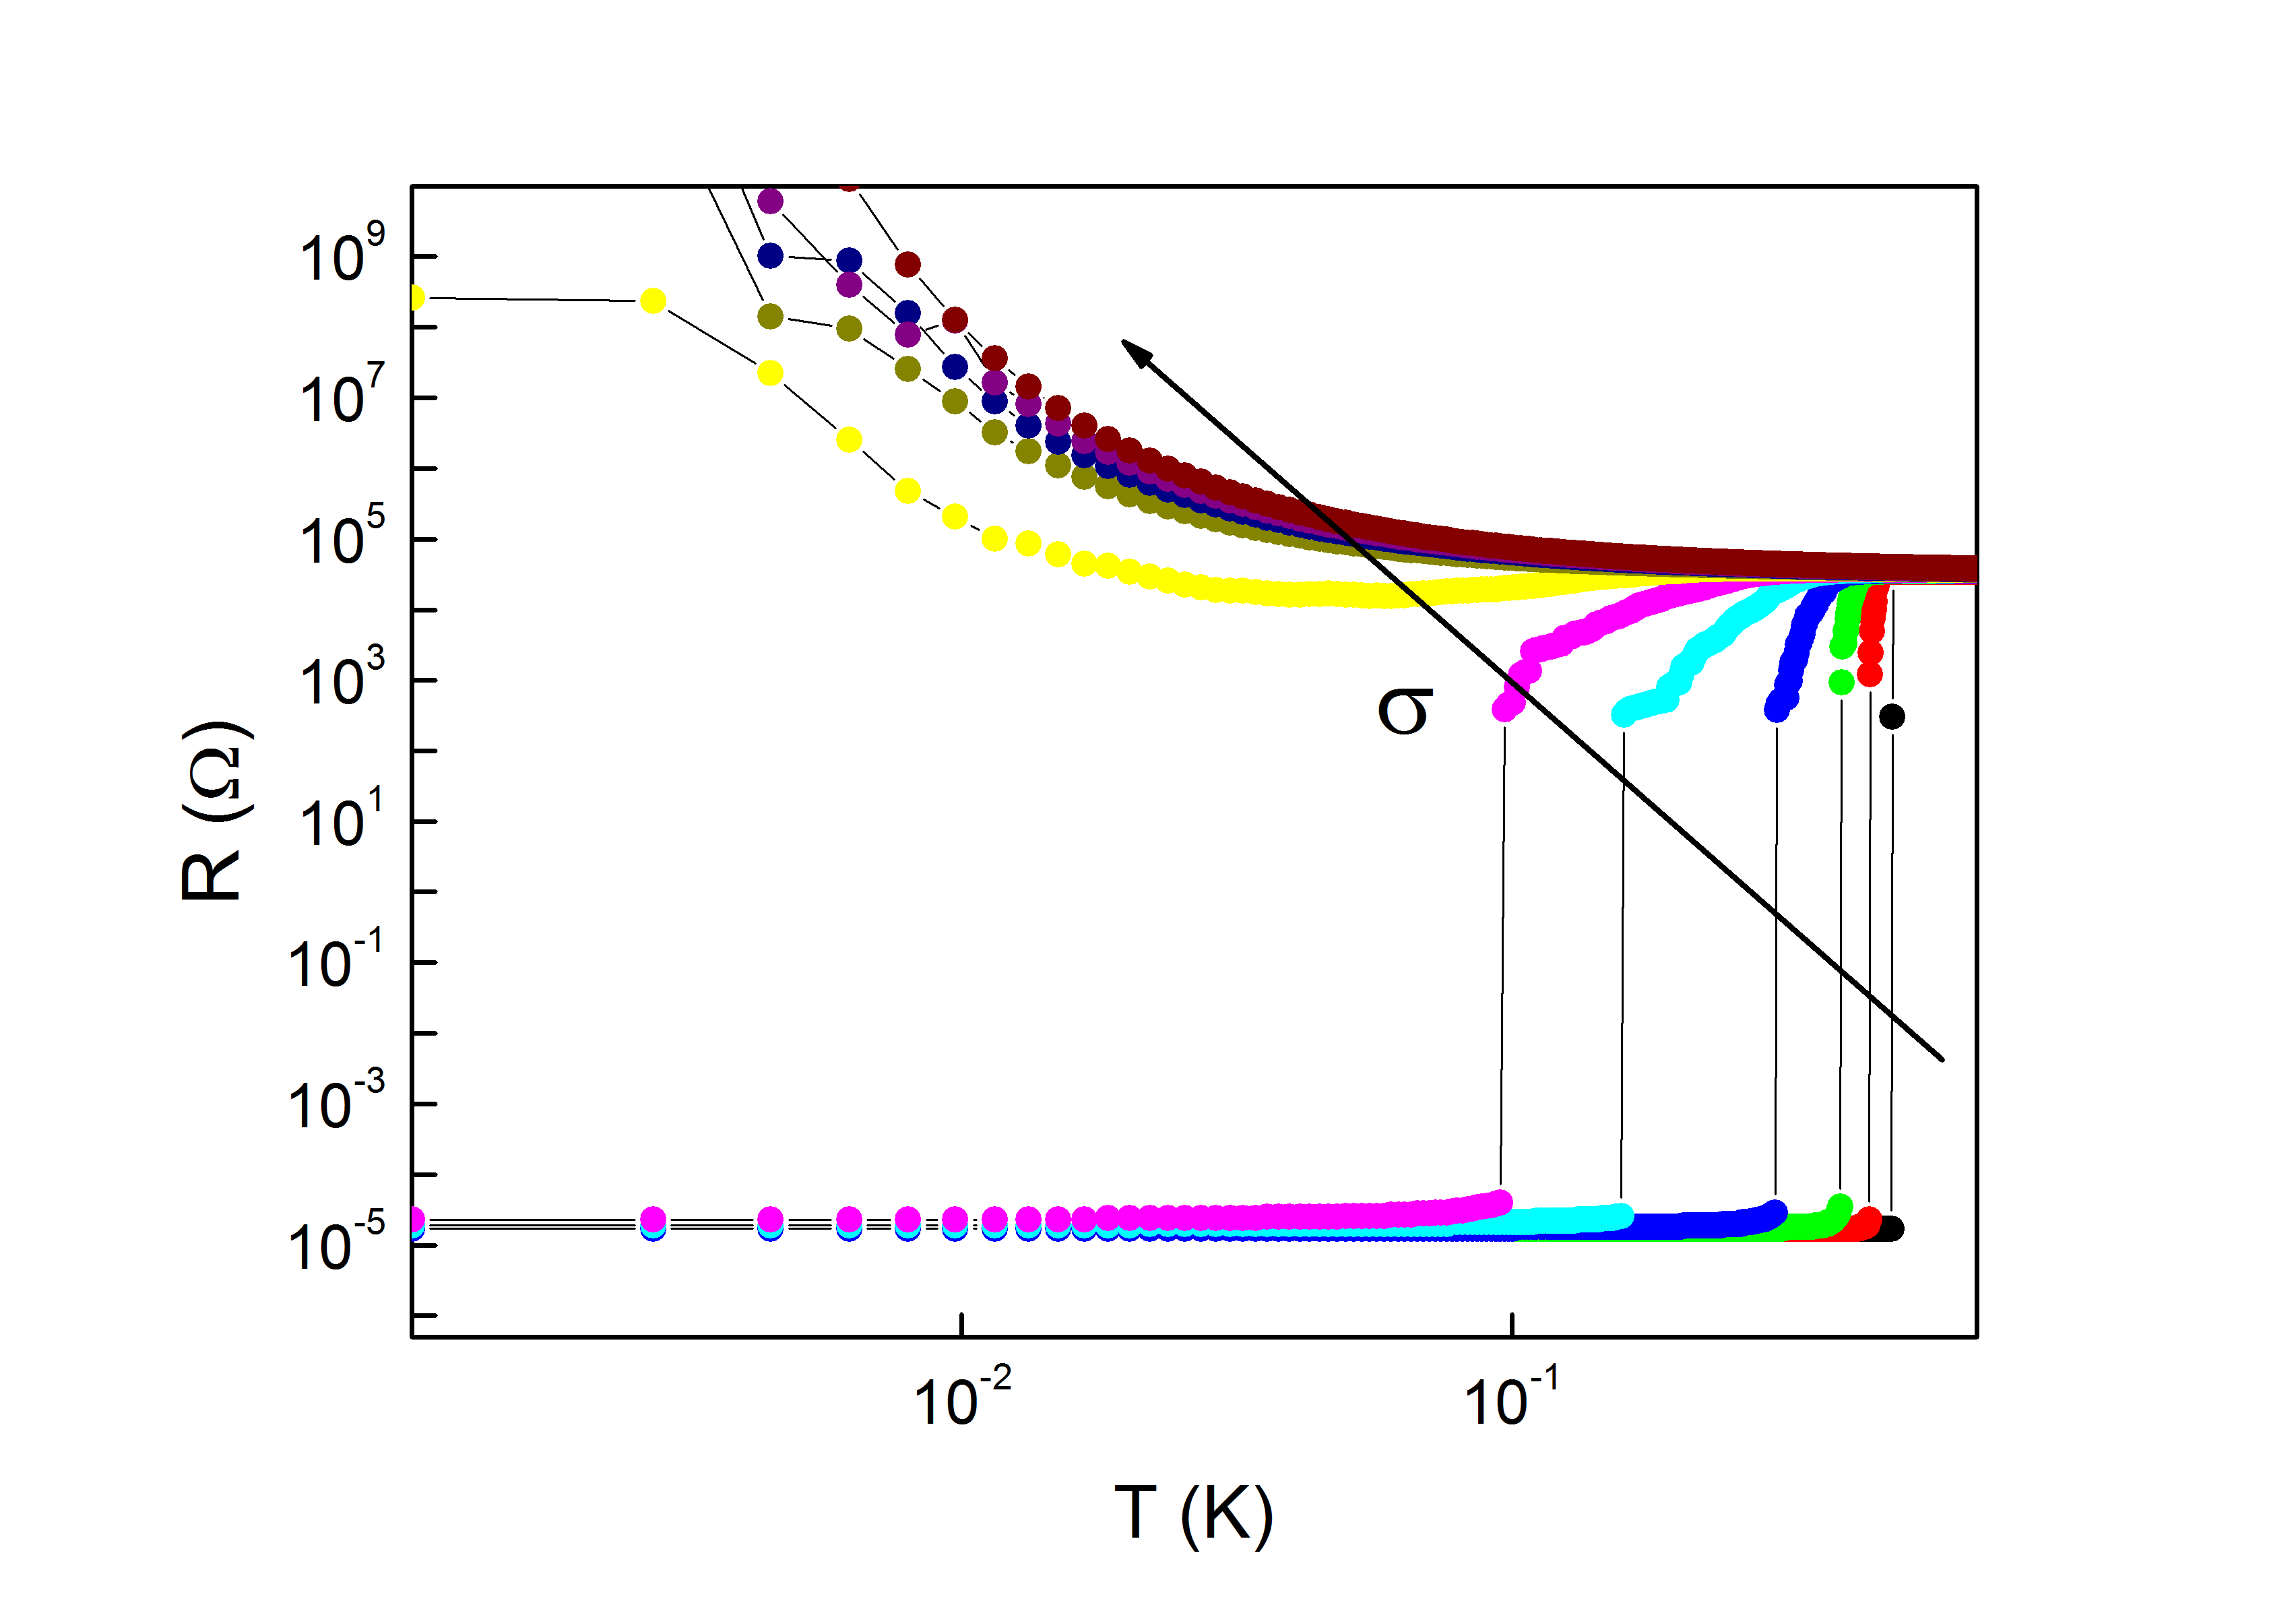
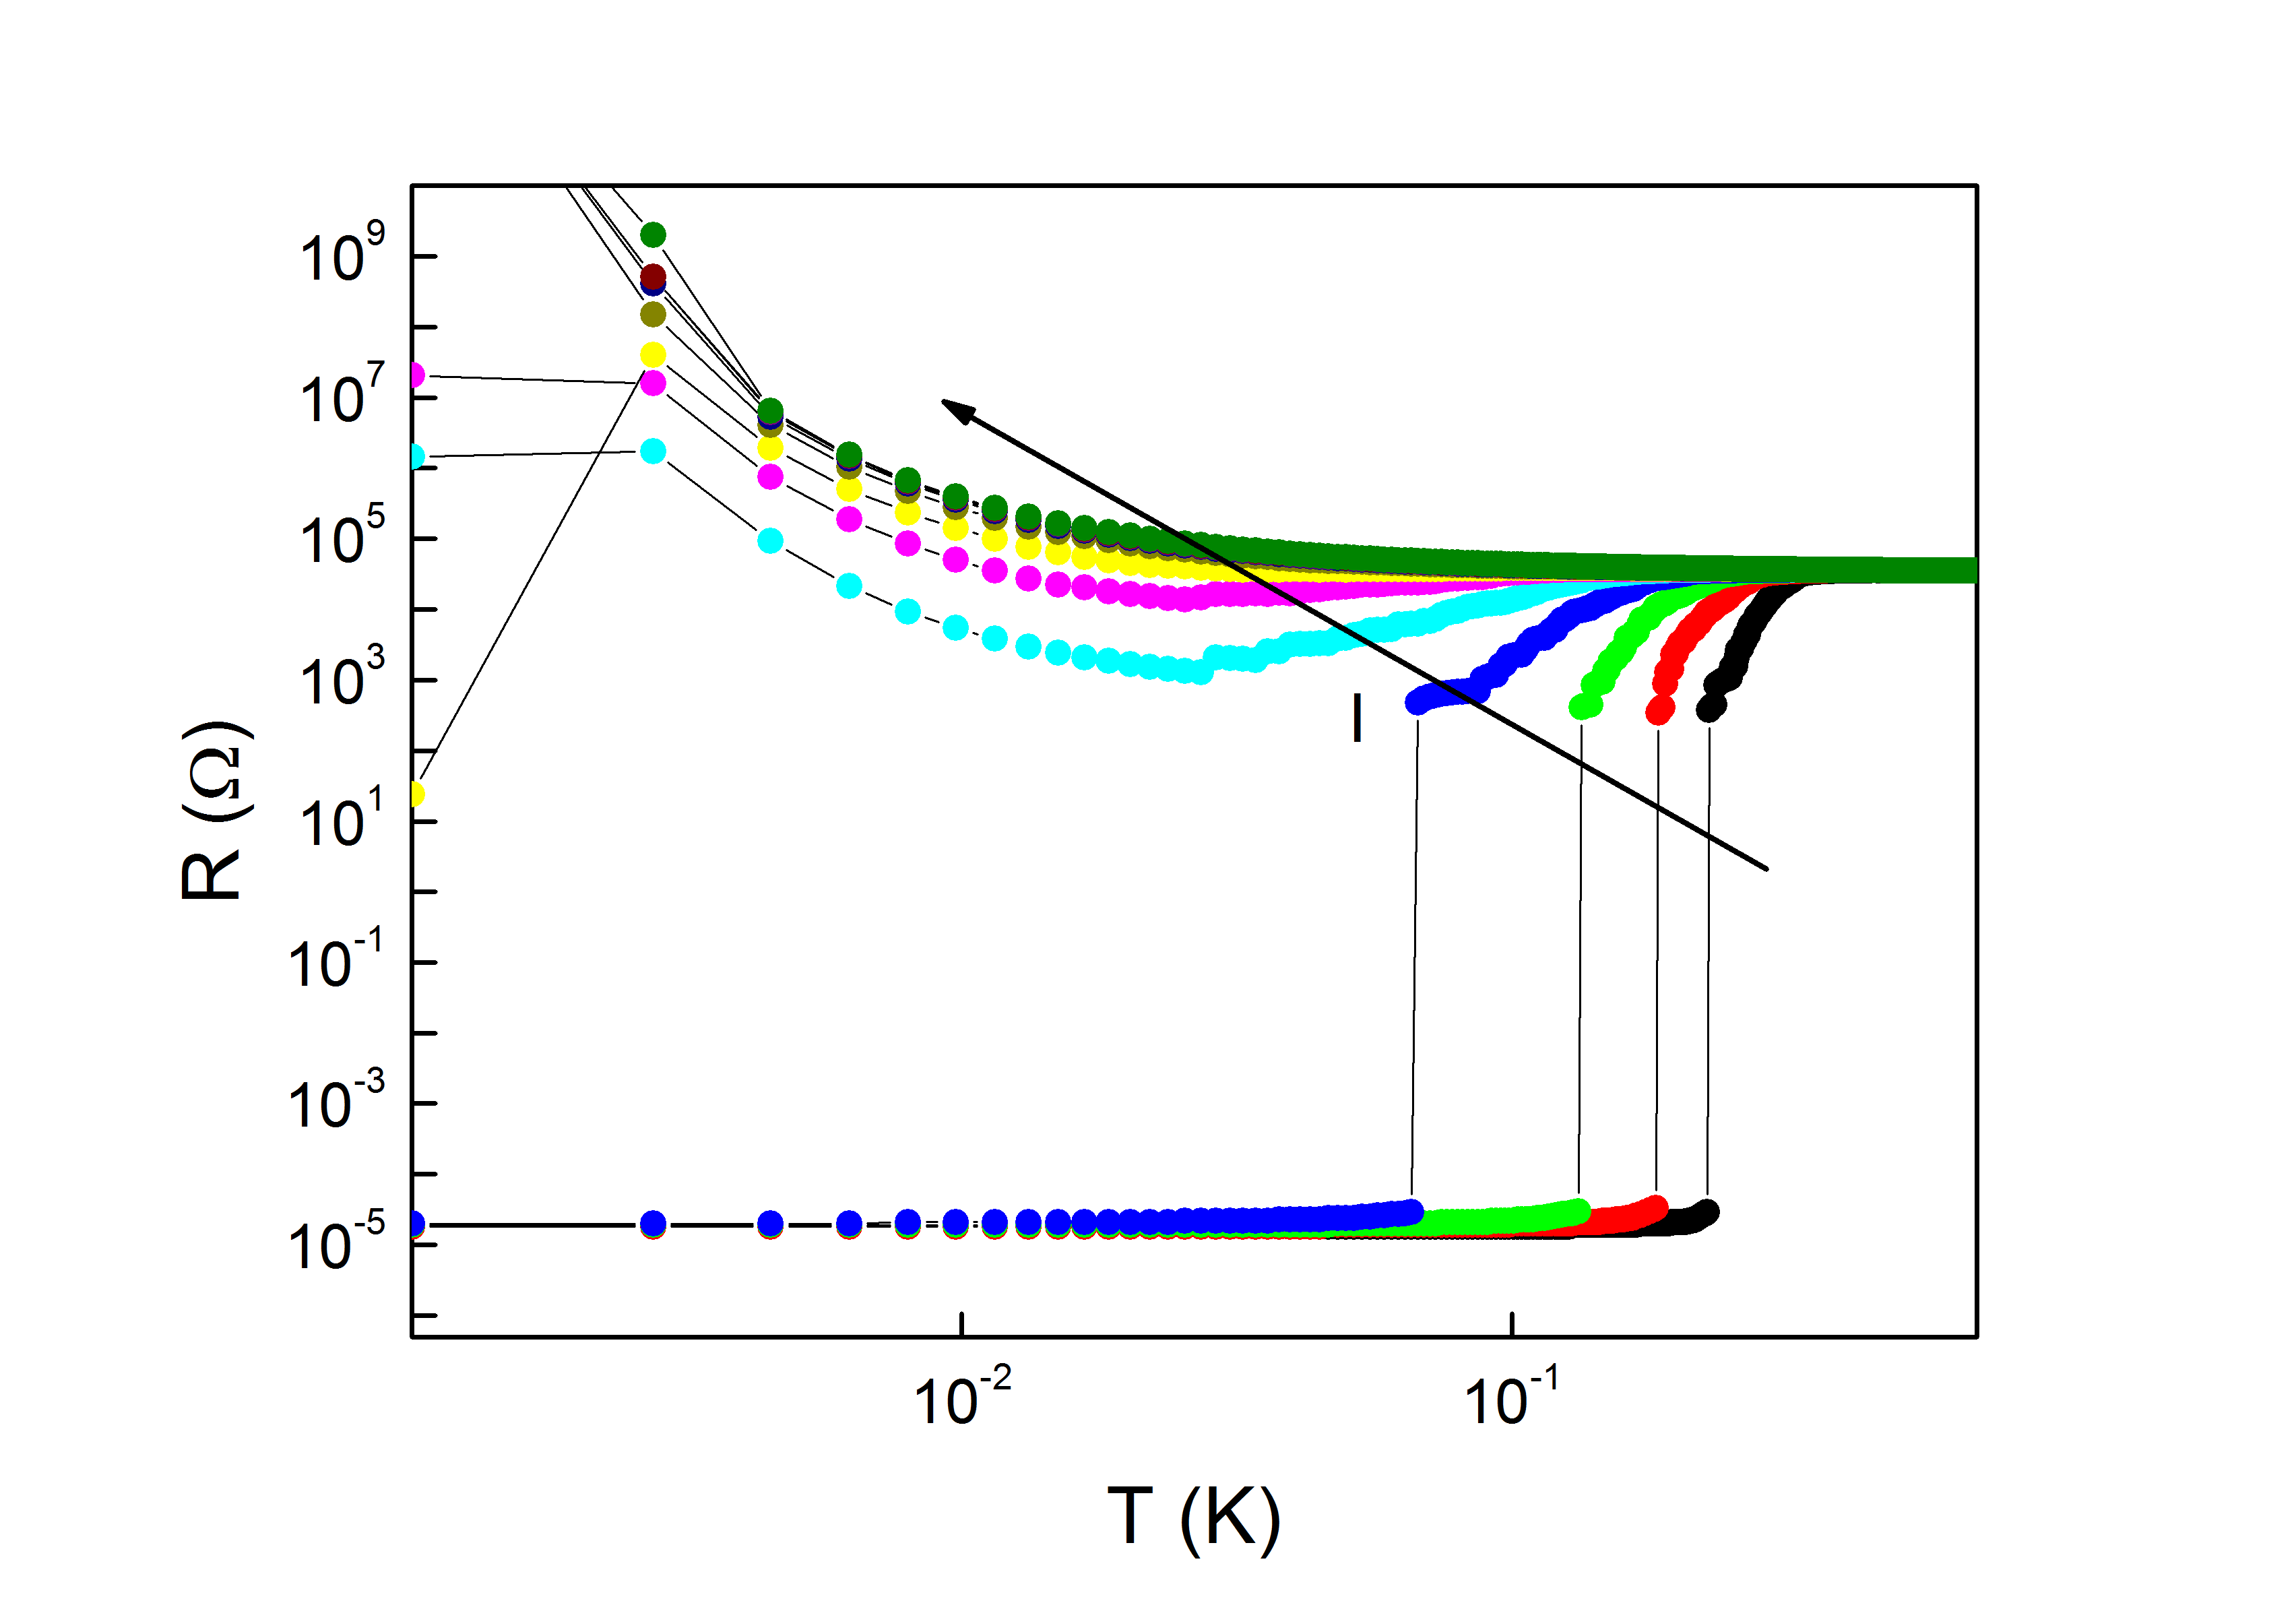
Figure 4 shows the superconducting insulator transition as a function of the temperature, for different values of the bias current . The degree of disorder is kept constant by taking constant the value of (in particular ). By increasing the bias current, the resistive transition becomes smoother and the superconductor insulator transition occurs at larger values of the bias current.
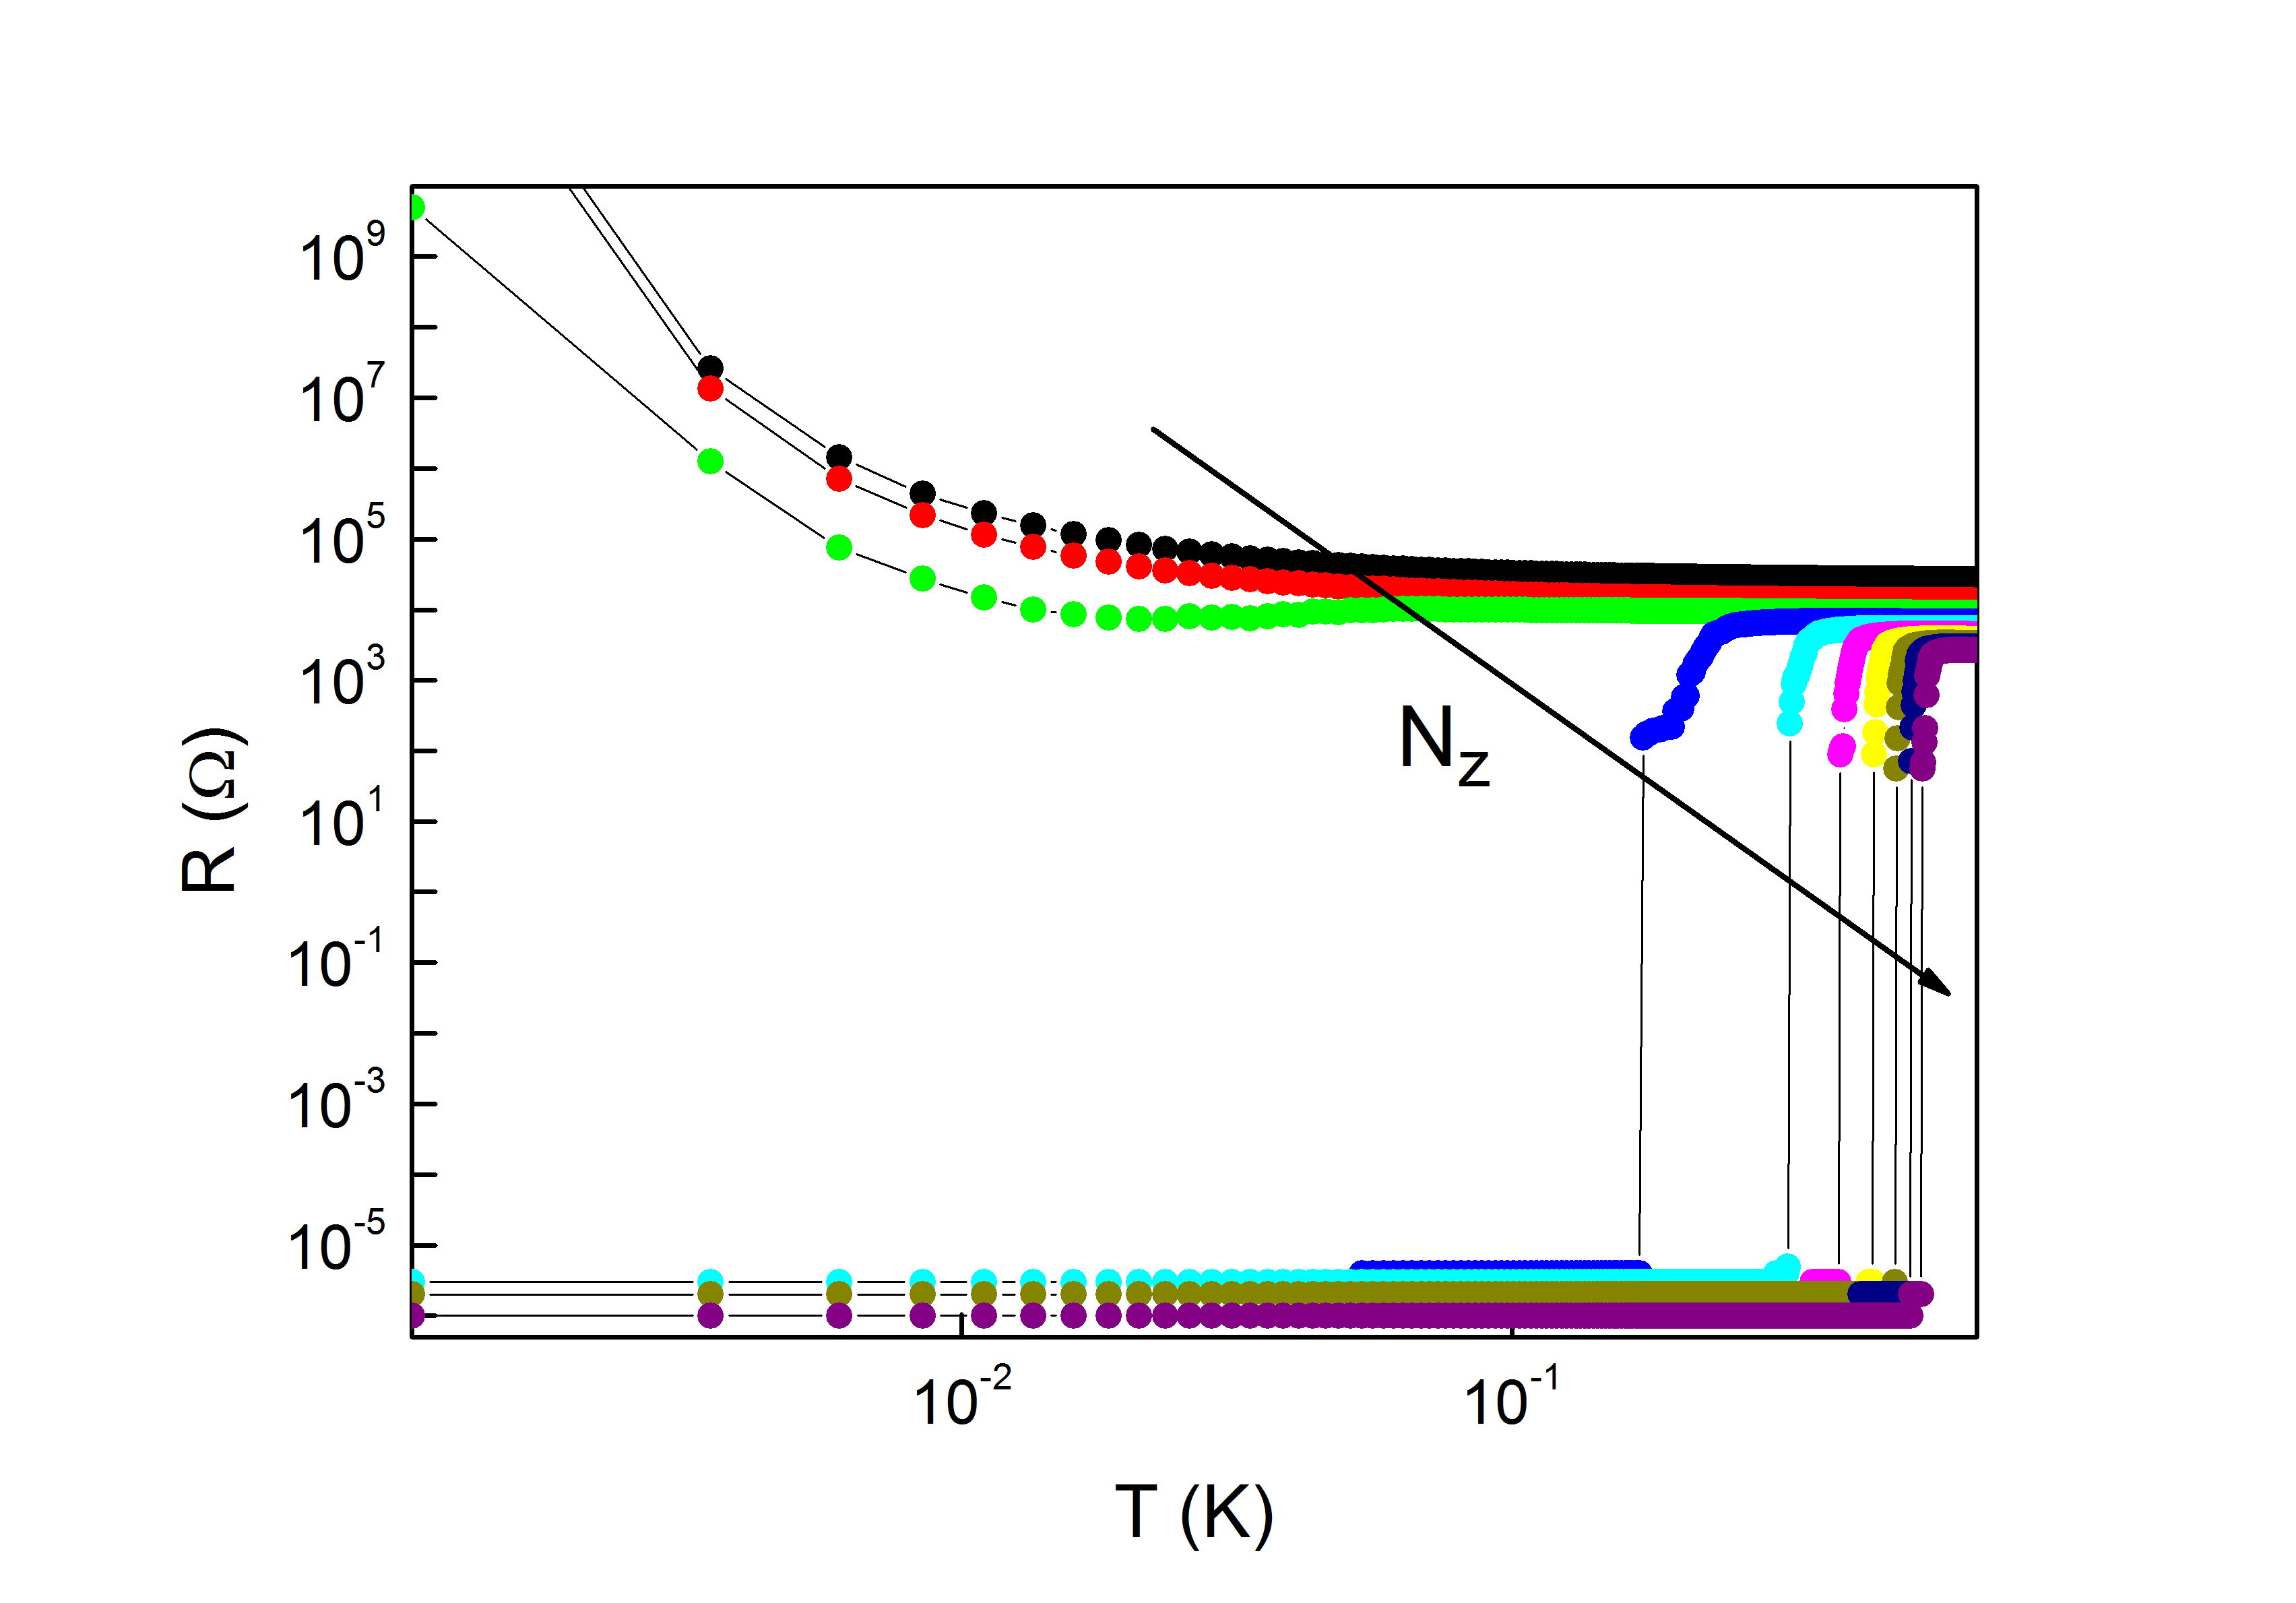
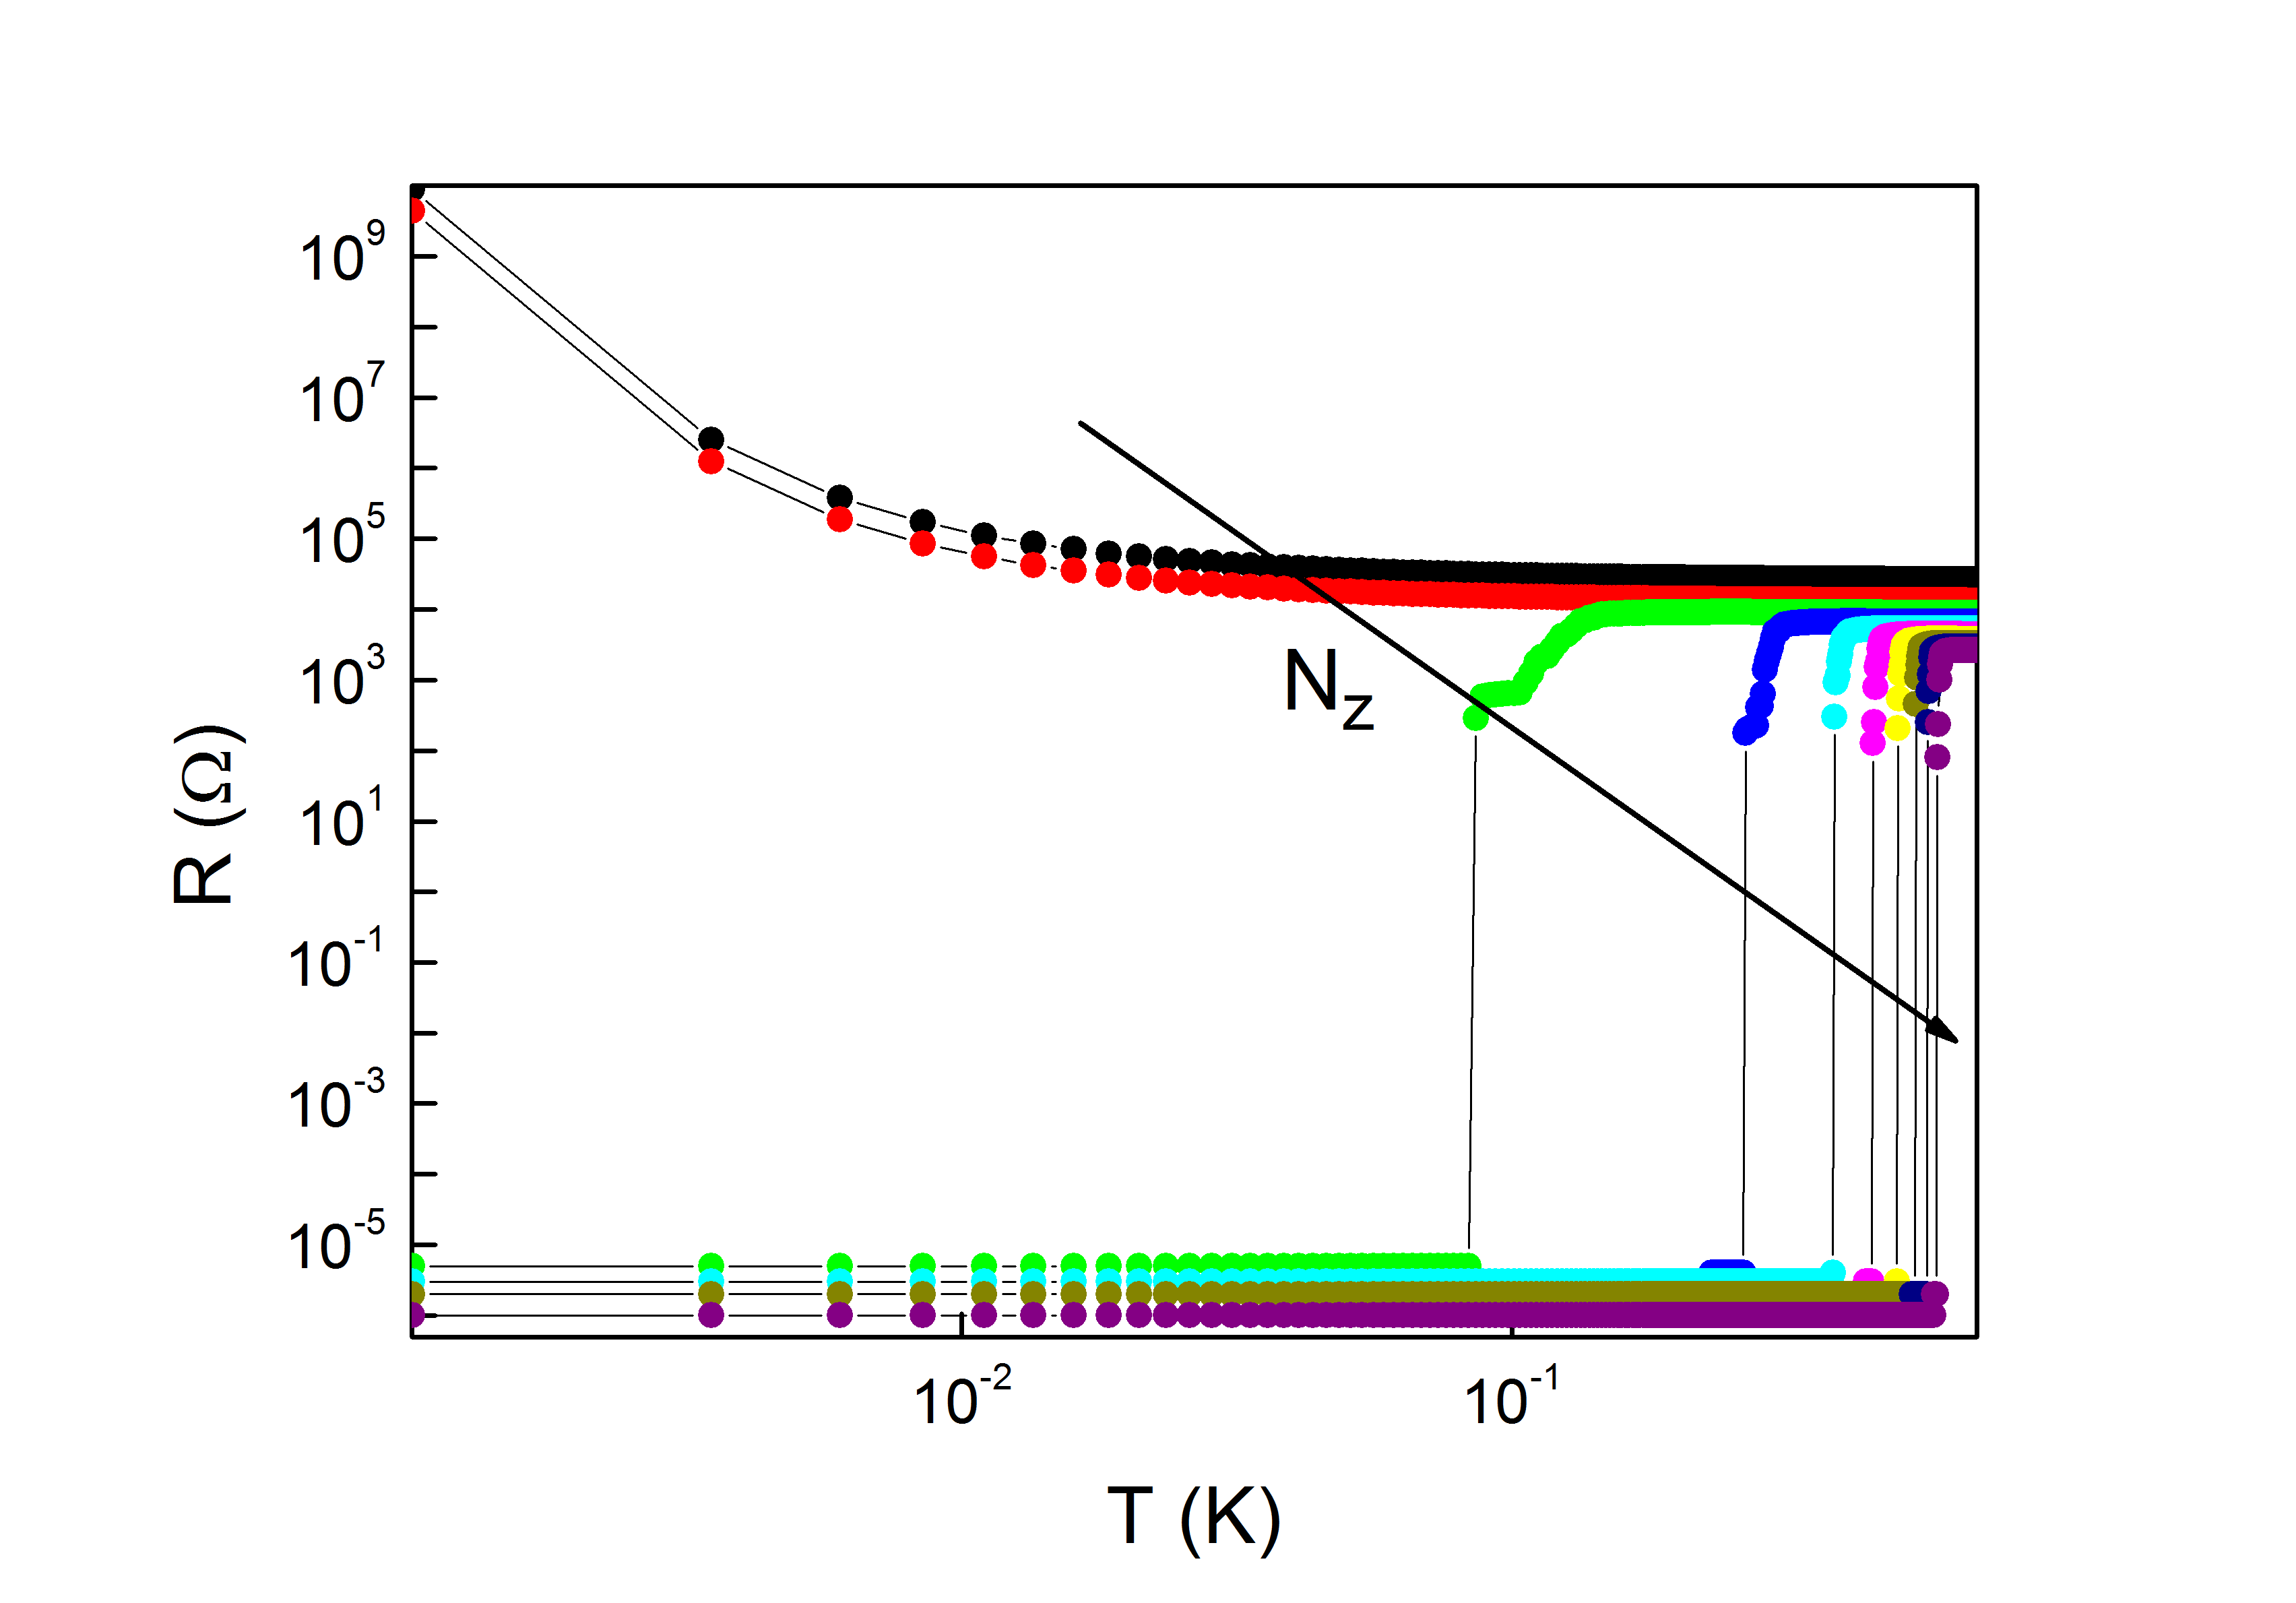
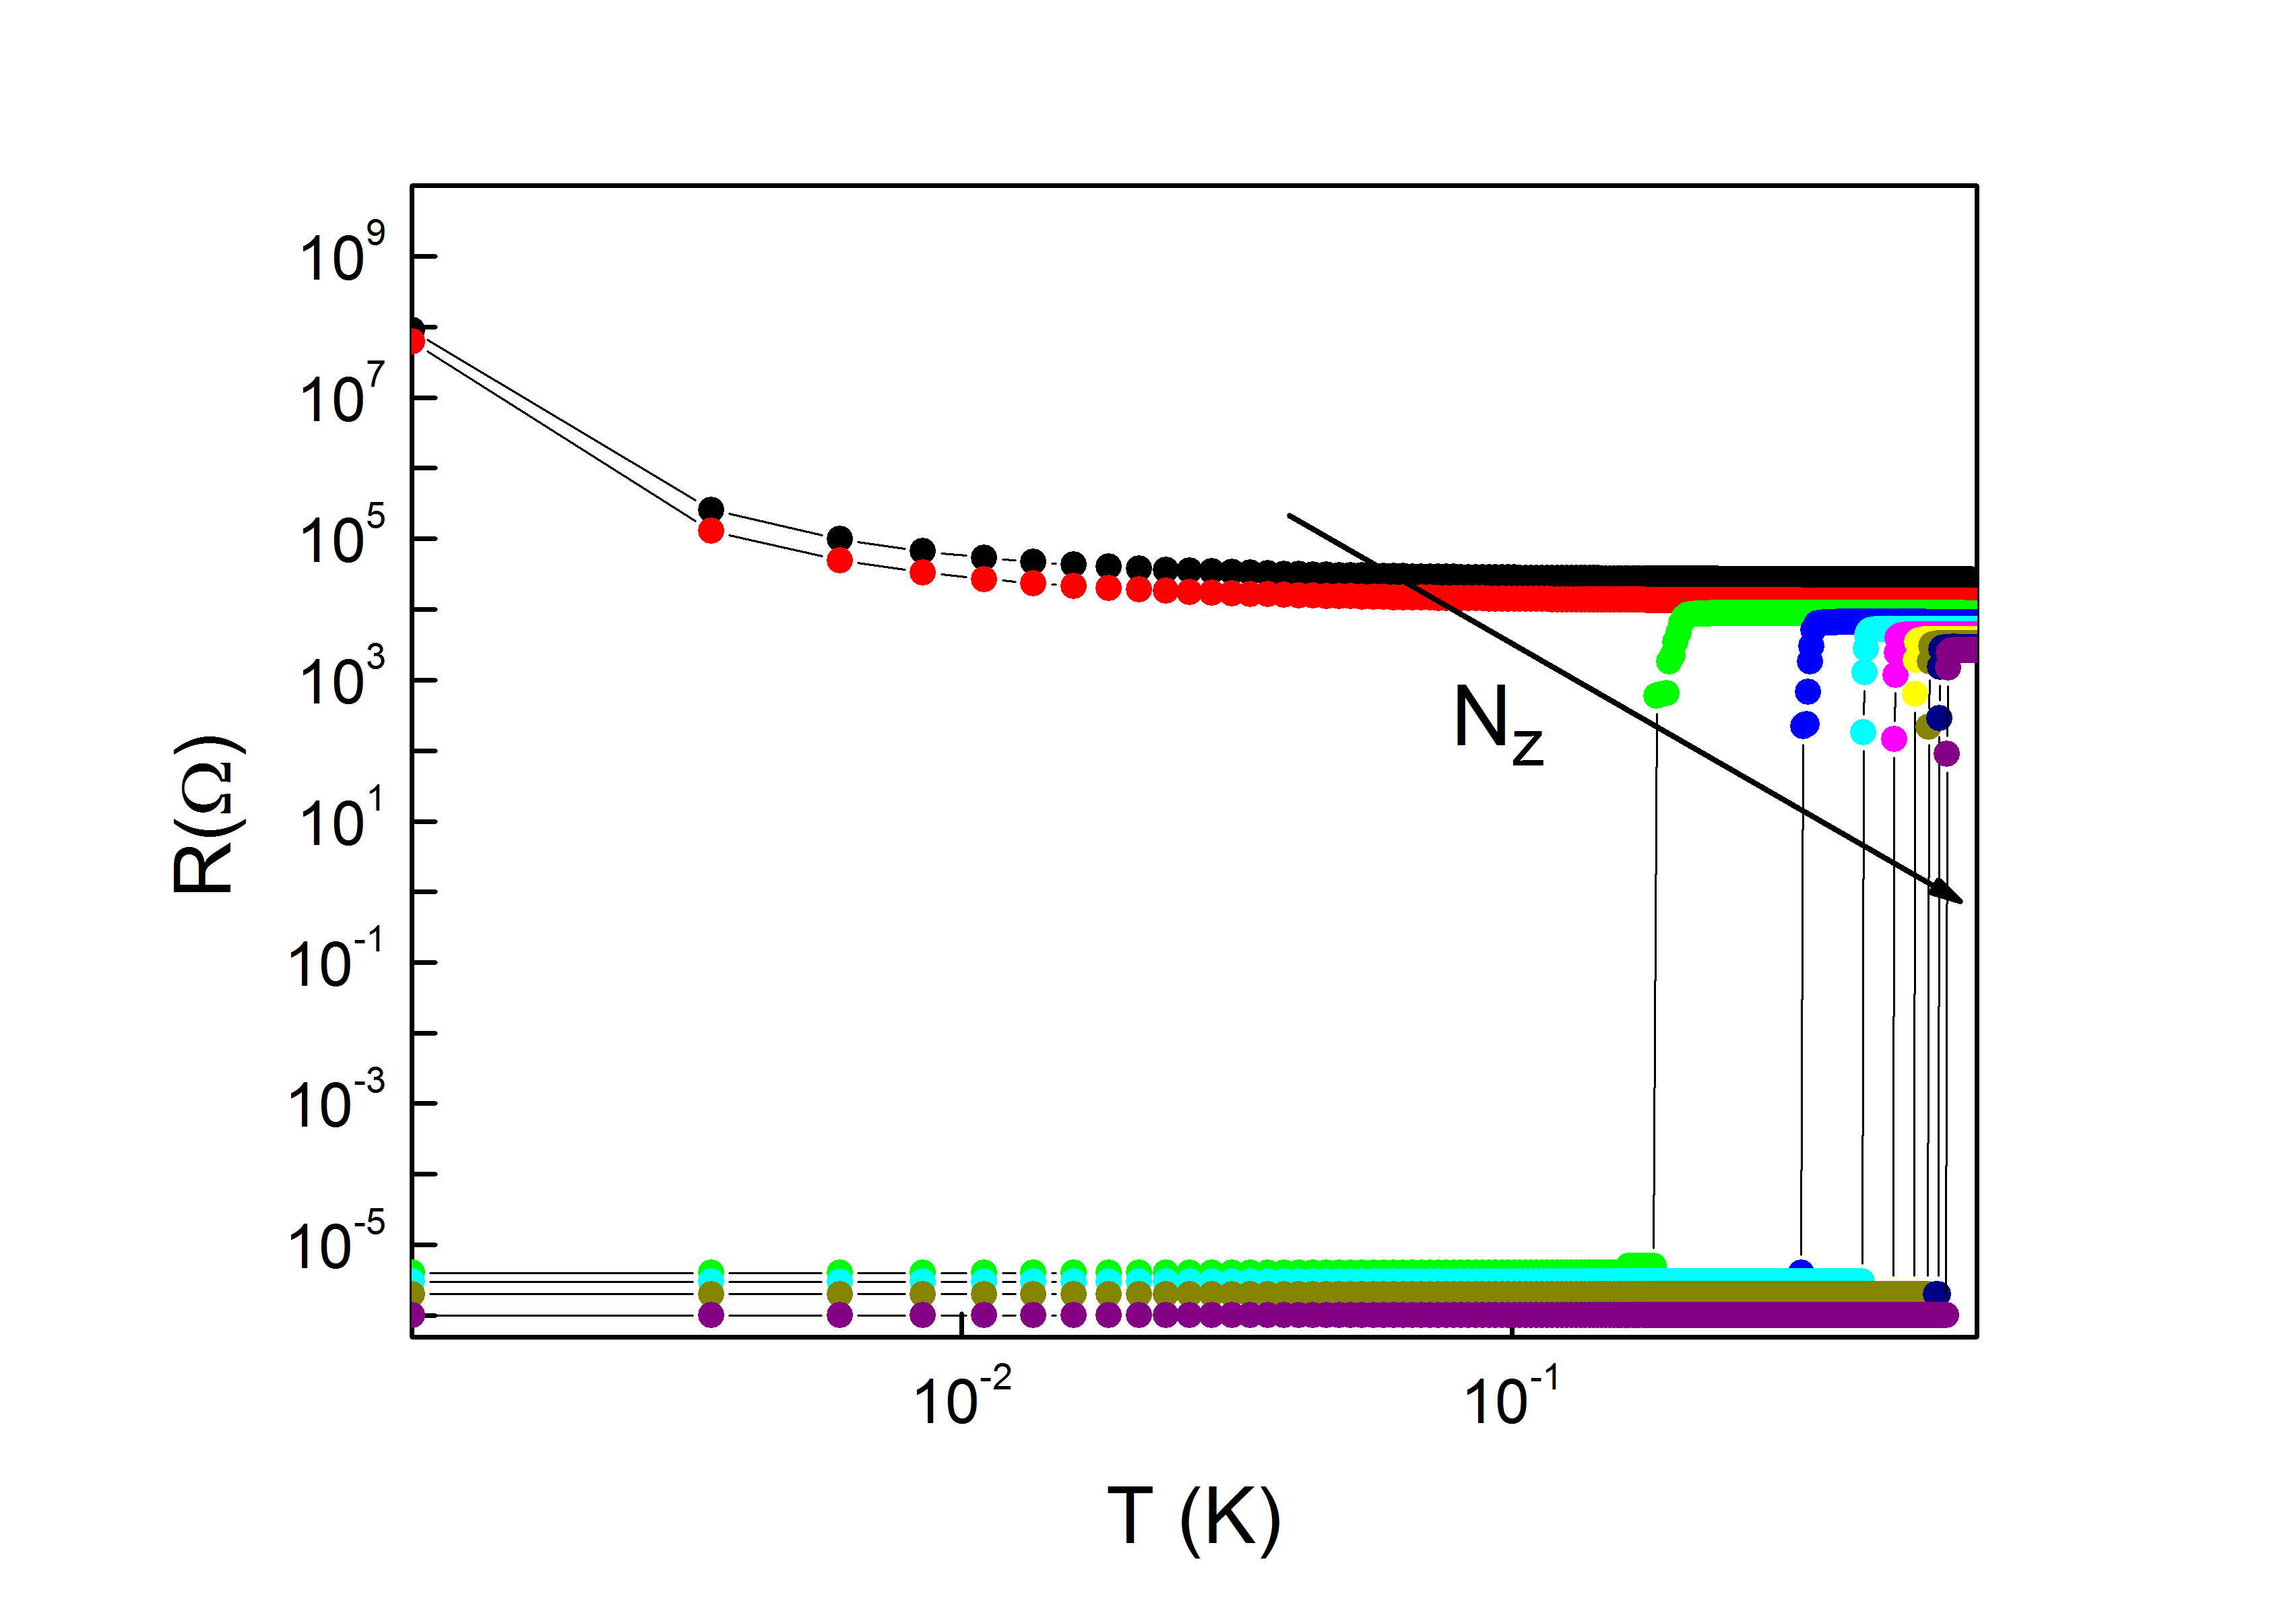
Figures 5, 6 and 7 show the superconductor insulator transition as a function of the temperature for different values of the film thickness, which is varied by changing the number of junctions in the -direction. The bias current is constant (). In each figure, the degree of disorder is constant, respectively by , and . One can notice that the simulations are robust with respect to the variation of at different disorder degrees and the insulating phase appears for thinner films (i.e. for thinner networks corresponding to smaller values of ).
In this paper, the superconducting-insulator transition has been simulated in arrays of thermally activated resistively shunted weak-links at varying disorder, bias current and film thickness. Accurate predictions of the relevant properties of the insulating state have been obtained. In particular, the agreement between simulation and experiment is consistent with a complex process according to which the homogeneous system self-organizes into a granular structure of weak-links Shahar ; Sambandamurthy ; Baturina ; Baturina2 ; Sarwa . The onset of the insulating phase, whose relevant property is the exponential dependence of the resistance on temperature , given by Eq. (4), is recovered, consistently with the existence of a nonvanishing gap in the insulating phase. Further applications and developments of this work can be envisioned to shed light on the elementary processes underlying the superconducting-insulator transition. The flexibility and ease of implementation of the proposed approach would be interesting for further investigations of the emergence of such complex electronic structures in several frameworks Staley ; Salluzzo ; Bollinger ; Ajmone .
References
- (1) P. W. Anderson, J. Phys. Chem. Solids 11, 26 (1959); A.A. Abrikosov and L.P. Gork’ov, Zh. Eksp. Teor. Fiz. Phys. 35, 319 (1959).
- (2) A. Finkels̀tein, Pisḿa Zh., Eksp. Teor. Fiz. 45, 37 (1987) [JETP Lett. 45, 46 (1987)]; Physica B 197, 636 (1994).
- (3) H.M. Jaeger, D.B. Haviland, A.M. Goldman and B.G.Orr Phys. Rev. B 34, 4920 (1986); B.G.Orr, H.M. Jaeger, A.M. Goldman and C.G. Kuper, Phys. Rev. Lett. 56, 378 (1986); H.M. Jaeger, D.B. Haviland, B.G. Orr, and A.M. Goldman, Phys. Rev. B 40, 182 (1989); D.B. Haviland, Y. Liu, and A.M. Goldman, Phys. Rev. Lett. 62, 2180 (1989).
- (4) M.P.A. Fisher, P.B. Weichman, G. Grinstein, and D.S. Fisher, Phys. Rev. B 40, 546 (1989); M.P.A. Fisher, Phys. Rev. Lett. 65, 923 (1990); M.P.A. Fisher, G. Grinstein, and S.M. Girvin, Phys. Rev. Lett. 64, 587 (1990).
- (5) N. Trivedi, R. T. Scalettar, and M. Randeria, Phys. Rev. B 54, R3756 (1990).
- (6) M. Wallin, E. S. Soresen, S. M. Girvin, and A. P. Young, Phys. Rev. B 49, 12115 (1994).
- (7) A. Yazdani and A. Kapitulnik, Phys. Rev. Lett. 74, 3037 (1995).
- (8) S.-Y. Hsu, J. A. Chervenak, and J. M. Valles Jr., Phys. Rev. Lett. 75, 132 (1995).
- (9) A. Ghosal, M. Randeria and N. Trivedi, Phys. Rev. B 65, 014501 (2001); A. Ghosal, M. Randeria and N. Trivedi, Phys. Rev. Lett. 81, 3940 (1998).
- (10) V.M. Galitski and A.I. Larkin, Phys. Rev. Lett. 87, 087001 (2001).
- (11) M.A. Skvortsov and M.V. Feigelḿan, Phys. Rev. Lett. 95, 057002 (2005).
- (12) B. Sacépé, C. Chapelier, T.I. Baturina, V.M. Vinokur, M.R. Baklanov, and M. Sanquer, Phys. Rev. Lett. 101, 157006 (2008).
- (13) Y. Dubi, Y. Meir, and Y. Avishai, Phys. Rev. B 78, 024502 (2008); Y. Dubi, Y. Meir, and Y. Avishai, Nature 449, 876 (2007).
- (14) K. Bouadim, Y.L. Loh, M. Rndeira and N. Trivedi, Nat. Phys. 7, 884 (2011).
- (15) D. Shahar and Z. Ovadyahu, Phys. Rev. B 46, 10917 (1992).
- (16) G. Sambandamurthy, L.W. Engel, A. Johansson, and D. Shahar, Phys. Rev. Lett. 92, 107005 (2004); G. Sambandamurthy, L.W. Engel, A. Johansson, E. Peled and D. Shahar, Phys. Rev. Lett. 94, 017003 (2005).
- (17) T.I. Baturina, A.Yu. Mironov, V.M. Vinokur, M.R. Baklanov, and C. Strunk, Phys. Rev. Lett. 99, 257003 (2007).
- (18) T.I. Baturina, V.M. Vinokur, A.Yu. Mironov, N. M. Chtchelkatchev, D. A. Nasimov, A.V. Latyshev, EPL. 93, 47002 (2011).
- (19) K.H. Sarwa, B. Tan, K.A. Parendo, and A.M. Goldman, Phys. Rev. B 78, 014506 (2008); J. S. Parker, D. E. Read, A. Kumar and P. Xiong, Europhys. Lett. 75, 950 (2006); K.A. Parendo, K. H. Sarwa B. Tan, and A. M. Goldman, Phys. Rev. B 73, 174527 (2006); K. A. Parendo, K. H. Sarwa B. Tan, A. Bhattacharya, M. Eblen-Zayas, N.E. Staley, and A. M. Goldman, Phys. Rev. Lett.94, 197004 (2005).
- (20) K.B. Efetov Sov. Phys. JETP, 51, 1015 (1980).
- (21) R. M. Bradley, and S. Doniach, Phys. Rev. B 30, 1138 (1984).
- (22) E. Granato, and J. M. Kosterlitz, Phys. Rev. Lett. 65, 1672 (1990).
- (23) W. Yu and D. Stroud, Phys. Rev. B 46, 14005 (1992).
- (24) A. van Otterlo, K.-H. Wagenblast, R. Fazio, and G. Schon, Phys. Rev. B 48, 3316 (1993).
- (25) H. S. J. van der Zant, W. J. Elion, L. J. Geerligs, and J. E. Mooij, Phys. Rev. B 54, 10081 (1996); R. Fazio, H. van der Zant, Phys. Rep. 355, 235 (2001).
- (26) I.S. Beloborodov, A.V. Lopatin, V.M. Vinokur, K.B. Efetov, Rev. Mod. Phys. 79, 469 (2007).
- (27) S.V. Syzranov, K.B. Efetov and B.L. Altshuler, Phys. Rev. Lett. 103, 127001 (2009).
- (28) L. Ponta, A. Carbone, M. Gilli and P. Mazzetti, Phys. Rev. B 79, 134513 (2009); A. Carbone, M. Gilli, P. Mazzetti and L. Ponta, J. Appl. Phys. 108, 123916 (2010); L. Ponta, A. Carbone, M. Gilli, Superc. Sci. Tech. 24, 015006 (2011).
- (29) N.E. Staley, J. Wu, P. Eklund, and Y. Liu, Phys. Rev. B 80, 184505 (2009).
- (30) M. Salluzzo, G. Ghiringhelli, J.C. Cezar, N.B. Brookes, G.M. De Luca, F. Fracassi, and R. Vaglio, Phys. Rev. Lett. 100, 056810 (2008).
- (31) A.T. Bollinger, G. Dubuis, J. Yoon, D. Pavuna, J. Misewich and I. Bozovic, Nature 472, 458 (2011).
- (32) M. Ajmone-Marsan et al., Eur. Phys. J Special Topics 214, 547 569 (2012).