Low-frequency radio observations of Seyfert galaxies: A test to the unification scheme
Abstract
Aims. We present low-frequency radio imaging and spectral properties of a well defined sample of Seyfert galaxies using GMRT 240/610 MHz dual frequency observations. Radio spectra of Seyfert galaxies over 240 MHz to 5.0 GHz are investigated using 240 MHz, 610 MHz flux densities derived from GMRT, and 1.4 GHz and 5.0 GHz flux densities mainly from published VLA data. We test the predictions of Seyfert unification scheme by comparing the radio properties of Seyfert type 1s and type 2s.
Methods. We choose a sample such that the two Seyferts subtypes have matched distributions in parameters that are independent to the orientation of AGN, obscuring torus and the host galaxy. Our sample selection criteria allow us to assume that the two Seyfert subtypes are intrinsically similar within the framework of the unification scheme.
Results. The new observations at 240/610 MHz, together with archival observations at 1.4 GHz, 5.0 GHz show that type 1s and type 2s have statistically similar radio luminosity distributions at 240 MHz, 610 MHz, 1.4 GHz and 5.0 GHz. The spectral indices at selected frequency intervals (, and ) as well as index measured over 240 MHz to 5.0 GHz () for the two Seyfert subtypes have similar distributions with median spectral index () -0.7 (Sν ), consistent with the synchrotron emission from optically thin plasma. In our snap-shot 240/610 MHz GMRT observations, most of the Seyfert galaxies show primarily an unresolved central radio component, except a few sources in which faint kpc-scale extended emission is apparent at 610 MHz. Our results on the statistical comparison of the multifrequency radio properties of our sample Seyfert galaxies are in agreement with the predictions of the Seyfert unification scheme.
Key Words.:
galaxies: Seyfert – galaxies: active – radio continuum: galaxies1 Introduction
Seyfert galaxies are categorized as low-luminosity (MB-Band -23; Schmidt & Green (1983)), radio-quiet
( 10; Kellermann et al. (1989)) Active Galactic Nuclei (AGN), hosted in spiral or lenticular
galaxies (Weedman 1977). Depending on the presence or absence of the broad permitted emission lines in their nuclear optical spectra,
Seyfert galaxies are classified as ‘type 1’ and ‘type 2’, respectively.
The detection of broad permitted emission lines in the spectropolarimetric observations of few Seyfert type 2s laid the foundation of Seyfert
unification scheme (Antonucci & Miller 1985). The unification scheme of Seyfert galaxies hypothesizes that Seyfert type 1s and type 2s constitute the same parent
population and appear different solely due to the differing orientations of the dusty molecular obscuring material
having a torus-like geometry around the AGN.
In Seyfert type 2s, the dusty torus intercepts the observer’s line-of-sight and blocks the direct view of the broad line region and
accreting black hole. While, in type 1s, observer’s line-of-sight is away from the obscuring torus and
therefore, broad line region and accreting black hole are directly visible (Antonucci & Miller 1985; Antonucci 1993; Urry et al. 1995).
In the literature, there have been various studies yielding consistent as well inconsistent results to the validity of the Seyfert unification scheme.
Some of the key results that support the unification scheme include, the presence of broad emission lines in the polarized optical and
infrared spectra of many Seyfert 2s (Antonucci & Miller 1985; Moran et al. 2000), the biconical structure of the narrow line region (Mulchaey et al. 1996),
the similar amount of total molecular gas detected by CO measurements in the two Seyfert subtypes (Maiolino et al. 1997), the systematic higher X-ray absorption in type 2s
(Cappi et al. 2006; Singh et al. 2011), and similar nuclear radio properties of both the subtypes (Lal et al. 2011).
However, inconsistencies to the unification scheme remain, such as the absence of hidden Seyfert 1 nuclei in several Seyfert 2s
(Tran 2001, 2003), higher tendency for Seyfert 1s to be hosted in galaxies of earlier Hubble type (Malkan et al. 1998),
the lack of X-ray absorption in some Seyfert 2s (Panessa & Bassani 2002), and higher propensity of nuclear starbursts in Seyfert 2s
(Buchanan et al. 2006).
It has been argued that the sample selection is the most crucial issue in testing the predictions of Seyfert unification scheme and the
samples used in many previous studies suffer from subtle biases (Antonucci 2002).
There are suggestions that the optical and UV selected samples are likely to have inherent biases against obscured sources (Ho & Ulvestad 2001).
Infrared selected samples can be biased towards unusually dusty sources as well as towards sources with a higher level of nuclear star
formation (Ho & Ulvestad 2001; Buchanan et al. 2006). X-ray selected samples from flux-limited surveys are likely to have obscured type 2 Seyferts that are
intrinsically more luminous than the selected type 1 counterparts (Heckman et al. 2005; Wang et al. 2009).
Recent studies on testing the unification scheme have emphasized and attempted to use less-biased samples and reported the results consistent
with the scheme (Cappi et al. 2006; Dadina 2008; Beckmann et al. 2009; Gallimore et al. 2010; Lal et al. 2011).
Nonetheless, issues related to sample selection remain and the quest to test the validity and limitations of the Seyfert unification with more improved
and well-defined samples continues.
Keeping above sample-selection arguments in mind, we attempt to test the predictions of unification scheme by using a Seyfert sample
in which types 1s and 2s have matched distributions in parameters that are independent to the orientation of the obscuring torus and AGN axis.
Our sample selection criteria help in mitigating the biases that are generally inherent in samples derived from flux-limited surveys and it
also allow us to assume that the two Seyfert subtypes are not intrinsically different within the framework of the unification scheme (Schmitt et al. 2003a; Lal et al. 2011).
In this paper we attempt to investigate the low-frequency radio properties of the two Seyfert subtypes to test the predictions of unification scheme. High resolution radio observations show that Seyferts nuclei produce weak bipolar radio-emitting jets that are largely confined within the host galaxy (Thean et al. 2000; Lal et al. 2004). However, at low-frequency significant radio emission may also arise from the extended emission related to either nuclear activity (Colbert et al. 1996; Gallimore et al. 2006) or to the star-formation (Baum et al. 1993). Notably, most of the Seyfert samples have been studied at higher frequencies ( 1.4 GHz) with high resolution ( arcsec or less) observations (Ulvestad & Wilson 1984a, b, 1989; Kukula et al. 1995; Morganti et al. 1999; Nagar et al. 1999; Thean et al. 2000, 2001; Lal et al. 2011), which effectively filter out emission from low-surface-brightness and extended radio structures. In this paper we study the low-frequency radio emission properties of Seyfert galaxies using Giant Meterwave Radio Telescope (GMRT) dual frequency 240/610 MHz observations. Hitherto, there has been dearth of low-frequency ( 1.0 GHz) radio observations of the sample of Seyfert galaxies and our observations are the first attempt, to our knowledge, to make a systematic study of the low-frequency radio properties of a well defined sample of Seyfert galaxies. To investigate the nature of multifrequency radio spectra we utilize 1.4 GHz, 5.0 GHz flux density measurements derived mainly from Very Large Array (VLA) ‘D’ configuration observations that are sensitive to the low-surface-brightness radio emission.
This paper is structured as follows. Our sample and its selection criteria are described in Section 2. The details of our observations and data reductions are described in Section 3. The comparison of radio properties of Seyfert type 1s and type 2s are discussed in Section 4. Radio properties of individual sources are given in Appendix A. Wherever required we assume cosmological parameters H0 = 71 km-1 Mpc-1, = 0.27, and = 0.73.
2 The sample
Our sample consists of 20 Seyfert galaxies with 10 type 1s and 10 type 2s.
All the sample sources satisfy basic criteria of being Seyfert galaxy radio quiet
( 10) (Kellermann et al. 1989), low optical luminosity (MB -23) AGN (Schmidt & Green 1983),
nuclear line width (FWHM) of the permitted line Hβ is larger than 1000 km s-1 for Seyfert type 1s (Khachikian & Weedman 1974),
line intensity ratio of [O III] 5007 Å to Hβ is greater that 3.0 for Seyfert type 2s (Dahari & De Robertis 1988) and sources are
hosted in spiral or lenticular galaxies (Weedman 1977). Thus, we ensure that our Seyfert sample is not contaminated by LINERs, quasars and radio loud
AGNs. Also, our sample sources fall in ‘Seyfert region’ of [O III]/O[ II] versus [O I]/Hα diagnostic diagram of
Kewley et al. (2006).
Seyfert galaxies which show any broad permitted emission line component in their optical spectra (subclasses 1.0, 1.2, 1.5, 1.8, 1.9)
are considered as type 1 while those which show only narrow permitted emission lines are considered as type 2.
Our sample selection criteria are based on the method proposed by Lal et al. (2011). An elaborate discussion on the sample selection issues and
adopted methodology is presented in Lal et al. (2011). We choose our sample using isotropic properties that are independent to the orientation
of the obscuring torus, AGN and host galaxy.
The criterion of using isotropic orientation-independent parameter mitigates biases that are caused by obscuring torus
or by the orientation of AGN jet-axis or host galaxy. It is to be noted that the inherent biases in Seyfert samples selected from optical, UV and X-ray
surveys are interpreted due to the obscuration mainly from the torus (Ho & Ulvestad 2001; Heckman et al. 2005).
The criterion of matching the distributions of the two subtypes in the orientation-independent parameters, allows us to assume that two Seyfert
subtypes in our sample are intrinsically similar within the framework of the unification scheme.
Essentially, we ascertain that we are not comparing completely intrinsically different sources.
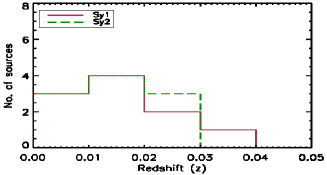
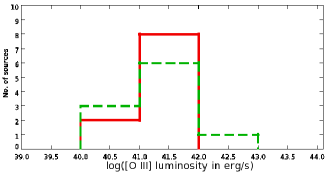
We consider five orientation-independent parameters cosmological redshift,
[O III] 5007Å luminosity, Hubble type of the host galaxy,
total absolute stellar luminosity of the host galaxy and absolute bulge magnitude.
These parameters are independent to the orientation of obscuring torus, AGN or the host galaxy and are also intimately link to
the evolution of AGN and host galaxy.
A brief description on the chosen orientation-independent parameters is given below.
(i) Cosmological redshift: it allows us to have control over cosmological evolution effect.
In our sample the two Seyfert subtypes have similar distributions of cosmological redshift spanning over a narrow interval.
This implies that the two Seyfert subtypes in our sample belong to similar cosmological epoch.
(ii) [O III] 5007Å line luminosity:
it originates from the narrow line region which is outside the torus and therefore, is not affected by the torus obscuration.
Also, [O III] 5007Å luminosity is expected to be correlated with nuclear ionizing continuum
as well as nuclear X-ray luminosity and can be considered as the proxy for intrinsic AGN power (Nelson & Whittle 1995; Heckman et al. 2005).
In our sample the two subtypes are chosen such that they have similar narrow distributions of [O III] luminosity.
This allows us to assume that the AGN powers of the two subtypes are matched.
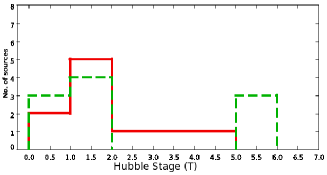
(iii) Hubble type of the host galaxy: it takes into account for the effect of the host galaxy morphology
and its environment on AGN evolution and vice-versa. Hubble type of a galaxy does not depend on the orientation of the torus or
AGN-jet axis (Pringle et al. 1999).
In our sample two Seyfert subtypes have similar distributions of Hubble type,
albeit, matching is less strong for Hubble stage (T) values higher than 2.
The values of Hubble stage for our sample sources are taken from Malkan et al. (1998) and de Vaucouleurs et al. (1991).
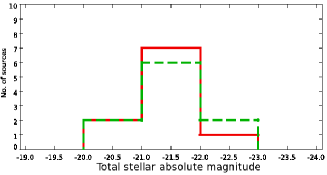
(iv) Total stellar absolute magnitude of the host galaxy: it can be considered as a characteristic property of the host galaxy.
The total stellar absolute magnitudes of the host galaxies of our sample sources are taken from (Whittle 1992) and these are corrected for
non-stellar and emission line flux, redshift (K) correction, the internal absorption and the Galactic absorption.
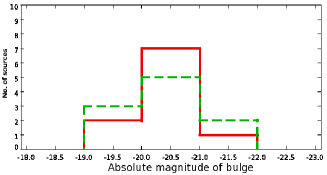
(v) Absolute magnitude of the bulge: it is independent to the orientation of obscuring torus, AGN axis.
Also, absolute magnitude of bulge is roughly proportional to the mass of the central supermassive black hole
(Kormendy & Gebhardt 2001; McConnell & Ma 2013), arguably a fundamental parameter of the AGN system.
The values of absolute magnitude of bulge of our sample sources are taken from Whittle (1992).
We chose our sample of 20 Seyfert galaxies (10 type 1s and 10 type 2s) such that the two subtypes have matched distributions in all the five orientation independent parameters. Our sample is extracted from Whittle (1992) sample of 140 Seyfert galaxies (78 type 1s and 62 type 2s). To ensure the bona fide nature of Seyfert type we selected only those sources that host in Spiral or lenticular galaxies Hubble type S0 or later (Weedman 1977). After excluding sources with early type, peculiar or uncertain host galaxy morphology we obtained a sample of 92 Seyferts (47 type 1s and 45 type 2s). In order to minimize the effects of obscuration by the host galaxy disk on the optical properties we selected Seyferts with relatively face-on host galaxies (ratio of minor to major isophotal diameter axis greater than 0.5), noting the fact that there is no correlation between AGN and host galaxy axis (Pringle et al. 1999; Nagar & Wilson 1999). It resulted the sample of 76 (41 type 1s and 35 type 2s) Seyfert galaxies. Of these 76 sources, 7 (2 type 1s and 5 type 2s) sources had declination (Dec - 53∘) beyond the GMRT coverage and were excluded. In the sample of 69 (39 type 1s and 30 type 2s) sources we further imposed redshift cutoff z 0.031, as per our selection criteria of choosing sources from narrow span of cosmological redshift. The redshift cut off rendered the sample of 49 (23 type 1s and 26 type 2s) sources. To ensure that source is easily detected above 6 in a ten minute snap-shot scan with GMRT we picked sources which had 1.4 GHz NVSS111http://www.cv.nrao.edu/nvss//FIRST222http://sundog.stsci.edu/index.html flux density higher than 6.0 mJy corresponding extrapolated 610 MHz flux density assuming a less steep radio spectral index of -0.5, higher than 9.0 mJy. This yielded a sample of 41 (19 type 1s and 22 type 2s) Seyfert galaxies. From these 41 Seyferts we picked 20 Seyferts (10 type 1s and 10 type 2s) that satisfied our selection criteria matched distributions of the two subtypes in the orientation independent parameters and could be observed in our limited telescope observing time. All our sample sources comply to the observing feasibility with GMRT sources are within the GMRT declination coverage range and are detectable with sufficient signal-to-noise ratio in a ten-minute snap shot with GMRT, there is no strong radio source in the neighborhood that can impact the dynamical range flux density of target source. Table 1 lists our sample sources and the values of their orientation-independent parameters. Redshift values are taken from NASA Extragalactic Database (NED) and are rounded off to the fourth place of decimal. The values of [O III] luminosity, absolute stellar magnitude and absolute bulge magnitude are taken from Whittle (1992). A quality factor has been assigned to all the parameters in Whittle (1992) and it reflects the level of reliability. We have used only those parameter values that have reliable quality rating ‘a’ to ‘c’ in Whittle (1992) catalog. We opted for updated values of parameters, whenever available in the literature, for example, [O III] luminosity and Hubble stage values obtained from HST observations (Schmitt et al. 2003a; Malkan et al. 1998) were preferred over values given in Whittle (1992). HST observations of [O III] emission reported in Schmitt et al. (2003a) yield spatially resolved [O III] emission associated with NLR regions. A comparison between [O III] fluxes obtained from HST and ground based observations shows that both kinds of observations give similar [O III] flux measurements (Figure 2 in Schmitt et al. (2003a)) and therefore, in general, contamination to [O III] emission by HII regions is likely to be not significant in Seyfert galaxies. The presence of circumnuclear starburst may affect the measurements of [O III] flux, bulge and stellar magnitudes. However, most of our sample sources are free from circumnuclear starburst contamination, except NGC 3227 and NGC 7469 that are known to posses circumnuclear starburst (Gonzalez Delgado & Perez 1997; Genzel et al. 1995). Thus, our sample selection is not much affected by the circmnuclear starburst contamination.
Figure 1 shows the matched distributions of the orientation-independent parameters for the two Seyfert subtypes of our sample. The matched distributions allow us to assume that we are not comparing entirely intrinsically different sources selected from different parts of the (luminosity, bulge mass, Hubble type, redshift) evolution function (Schmitt et al. 2003b). Indeed, following the same sample selection criteria there is possibility to obtain a larger sample, however, we would like to emphasize that the more important is the sample selection and not the sample size to rigorously test the predictions of the unification scheme. Larger but heterogeneous and biased sample is likely to result incorrect conclusions. The relatively small size of our sample is the result of the combined effect of restrictive selection criteria and observational constraints. And, in future, we plan to extend our analysis to a larger sample.
| Source | RA | Dec | Redshift | log L | Hubble | M | M |
|---|---|---|---|---|---|---|---|
| Name | (h m s) | (d m s) | (z) | (erg s-1) | Stage (T) | ||
| Seyfert 1s | |||||||
| MRK 6 | 06 52 12.2 | +74 25 37 | 0.01887 | 41.792 | 05 | -20.301 | -19.441 |
| NGC 3227 | 10 23 30.6 | +19 51 54 | 0.00397 | 40.311 | 16 | -21.471 | -20.461 |
| NGC 3516 | 11 06 47.5 | +72 34 07 | 0.00887 | 41.072 | 05 | -21.611 | -20.881 |
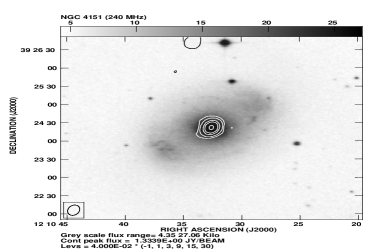
| NGC 4151 | 12 10 32.6 | +39 24 21 | 0.00337 | 41.351 | 26 | -21.221 | -19.981 |
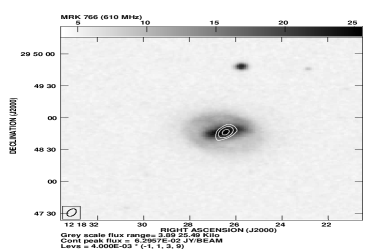
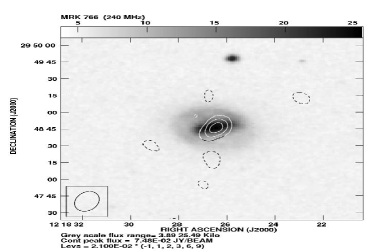
| MRK 766 | 12 18 26.5 | +29 48 46 | 0.01297 | 41.612 | 35 | -21.031 | -20.101 |
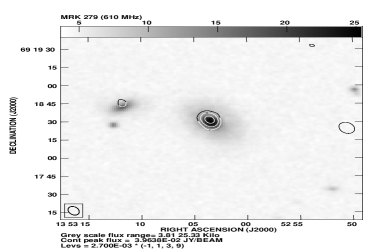
| MRK 279 | 13 53 03.4 | +69 18 30 | 0.03057 | 41.461 | 15 | -21.591 | -20.981 |
| NGC 5548 | 14 17 59.5 | +25 08 12 | 0.01727 | 41.422 | 15 | -21.821 | -20.891 |
| ARK 564 | 22 42 39.3 | +29 43 31 | 0.02477 | 41.381 | 16 | -21.651 | -20.111 |
| NGC 7469 | 23 03 15.6 | +08 52 26 | 0.01637 | 41.511 | 45 | -22.011 | -20.901 |
| MRK 530 | 23 18 56.6 | +00 14 38 | 0.02957 | 40.981 | 15 | -22.741 | -21.191 |
| Seyfert 2s | |||||||
| MRK 348 | 00 48 47.1 | +31 57 25 | 0.01507 | 41.312 | 05 | -21.131 | -20.201 |
| MRK 1 | 01 16 07.2 | +33 05 22 | 0.01597 | 41.521 | 55 | -20.321 | -19.461 |
| MRK 1066 | 02 59 58.6 | +36 49 14 | 0.01207 | 40.881 | 55 | -21.061 | -20.451 |
| NGC 2110 | 05 52 11.4 | -07 27 22 | 0.00787 | 40.351 | 15 | -21.571 | -20.721 |
| NGC 2273 | 06 50 08.6 | +60 50 45 | 0.00617 | 40.093 | 16 | -20.991 | -19.971 |
| NGC 5252 | 13 38 15.9 | +04 32 33 | 0.02307 | 41.414 | 05 | -21.961 | -21.351 |
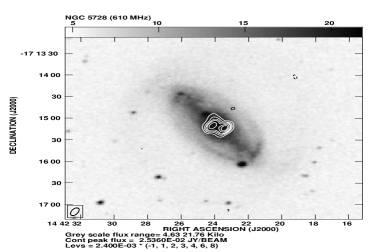
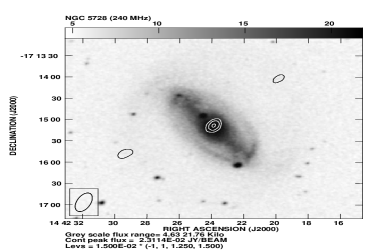
| NGC 5728 | 14 42 23.9 | -17 15 11 | 0.00947 | 41.111 | 16 | -22.351 | -21.121 |
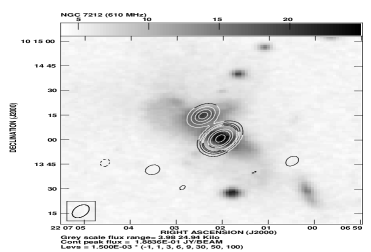
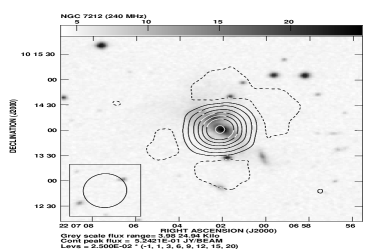
| NGC 7212 | 22 07 01.3 | +10 13 52 | 0.02667 | 42.152 | 16 | -21.241 | -20.221 |
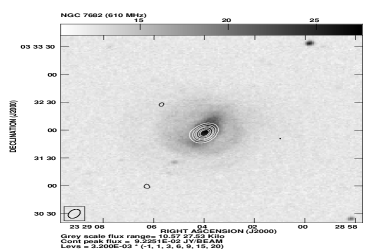
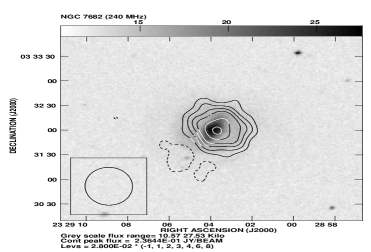
| NGC 7682 | 23 29 03.9 | +03 32 00 | 0.01717 | 41.161 | 05 | -21.111 | -19.881 |
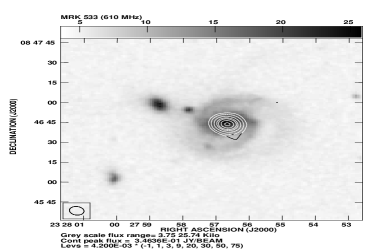
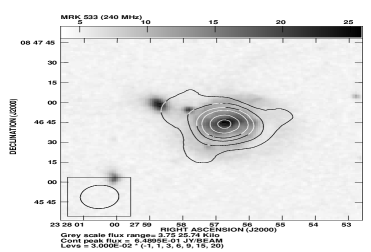
| MRK 533 | 23 27 56.7 | +08 46 45 | 0.02897 | 41.992 | 55 | -22.651 | -20.691 |
Notes. Column 1: source name; Columns 2 and 3: right ascension (hours, minutes, and seconds) and declination
(degrees, arcminutes, and arcseconds) in J2000; Column 4: cosmological redshift; Column 5: [O III] 5007Å luminosity in log;
Column 6: Hubble Stage (T); Column 7: total stellar absolute magnitude (M) corrected for the nuclear non-stellar continuum
and emission line flux, redshift correction (K), the internal absorption and the Galactic absorption; Column 8: absolute bulge magnitude in ‘B’ band
(M).
References. (1) Whittle (1992); (2) Schmitt et al. (2003a); (3) Ferruit et al. (2000); (4) Polletta et al. (1996); (5) Malkan et al. (1998);
(6) de Vaucouleurs et al. (1991); (7) NASA Extragalactic Database (NED).
3 Observations and Data Reduction
We carried out full array GMRT (Swarup et al. 1991) snapshot observations at dual frequency 610/240 MHz using 4 second integration time and bandwidth of 32 MHz. Our observing log is given in Table 2. All the 20 Seyfert galaxies are observed with 2 - 4 scans (except NGC 7469 with only one scan and NGC 5548 with 5 scans) with each scan spanning to 10 minutes. We gave more observing scans to weaker radio sources and less to stronger ones by using 1.4 GHz NVSS flux densities as the indicator of source radio strength. Absolute flux and bandpass calibration is done by observing standard flux calibrators 3C 147 and 3C 286, at the start and end of the observing run. The phase calibration is done by observing a nearby phase calibrator source for 4 minutes, before and after every scan of the target source. Our data are reduced in a standard way using ‘Astronomical Image Processing System’ (AIPS)333http://www.aips.nrao.edu package. For each run, bad visibility points are edited out, after which the data are calibrated. The edited and calibrated visibilities are Fourier transformed into radio maps using ‘IMAGR’ task in AIPS. We performed wide field imaging as the primary beam size of full array GMRT at 610/240 MHz is rather large 43′/114′. For all our sample sources the signal-to-noise ratio is sufficiently high enough to apply self-calibration which removes antenna-based phase and amplitude errors.
| Source | No. | Phase | Obs. |
|---|---|---|---|
| name | of scans | Cal | date |
| Seyfert 1s | |||
| MRK 6 | 3 | 0614+607 | 2008 August 09, 10 |
| NGC 3227 | 3 | 1111+199 | 2008 August 09 |
| NGC 3516 | 4 | 1313+675 | 2008 August 09, 10 |
| NGC 4151 | 2 | 1331+305 | 2008 August 09 |
| MRK 766 | 3 | 1331+305 | 2008 August 09, 10 |
| MRK 279 | 4 | 1313+675 | 2008 August 09, 10 |
| NGC 5548 | 5 | 1331+305 | 2008 August 09, 10 |
| ARK 564 | 3 | 2236+284 | 2008 August 10 |
| NGC 7469 | 1 | 2212+018 | 2008 August 10 |
| MRK 530 | 4 | 2212+018 | 2008 August 10 |
| Seyfert 2s | |||
| MRK 348 | 3 | 0137+331 | 2008 August 10 |
| MRK 1 | 3 | 0137+331 | 2008 August 10 |
| MRK 1066 | 3 | 0137+331 | 2008 August 10 |
| NGC 2110 | 2 | 0607-085 | 2008 August 10 |
| NGC 2273 | 3 | 0614+607 | 2008 August 09, 10 |
| NGC 5252 | 4 | 1351-148 | 2008 August 09, 10 |
| NGC 5728 | 2 | 1351-148 | 2008 August 09 |
| NGC 7212 | 2 | 2212+018 | 2008 August 10 |
| NGC 7682 | 2 | 2212+018 | 2008 August 10 |
| MRK 533 | 2 | 2212+018 | 2008 August 10 |
| Map parameter | Source parameter | ||||||||
|---|---|---|---|---|---|---|---|---|---|
| Sources | Scale | Beam size | P.A. | rms noise | SPeak | SInt. | Fitted size | ||
| name | (kpc/′′) | (arcsec2) | (deg) | (mJy/b) | (mJy/b) | (mJy) | Maj. | Min. | P.A. |
| (arcsec) | (arcsec) | (deg) | |||||||
| Seyfert 1s | |||||||||
| MRK 6 | 0.377 | 10.204.95 | -28.38 | 1.65 | 476.2 | 502 | 10.42 | 5.06 | 150.8 |
| NGC 3227 | 0.079 | 8.036.44 | -65.60 | 2.10 | 130.1 | 148 | 8.85 | 6.70 | 119.4 |
| NGC 3516 | 0.179 | 7.514.91 | -12.96 | 1.20 | 13.5 | 25 | 10.44 | 7.38 | 4.0 |
| NGC 4151 | 0.068 | 7.795.04 | -25.02 | 3.50 | 312.9 | 341.5 | 8.12 | 5.28 | 147.7 |
| 218.1 | 264.5 | 8.30 | 5.74 | 162.1 | |||||
| MRK 766 | 0.261 | 7.524.63 | -25.68 | 1.15 | 53.3 | 58.0 | 7.92 | 4.81 | 150.0 |
| MRK 279 | 0.601 | 7.475.27 | 19.68 | 0.90 | 39.6 | 44 | 7.86 | 5.54 | 19.0 |
| NGC 5548 | 0.344 | 6.315.19 | -10.90 | 0.95 | 19.7 | 56 | 14.33 | 7.11 | 158.5 |
| ARK 564 | 0.491 | 7.685.16 | -45.09 | 1.00 | 61.0 | 62.5 | 7.62 | 4.91 | 132.3 |
| NGC 7469 | 0.328 | 9.675.36 | -24.77 | 1.15 | 218.5 | 292 | 10.43 | 6.70 | 154.7 |
| MRK 530 | 0.584 | 7.186.85 | 35.11 | 0.60 | 37.1 | 40 | 7.28 | 7.18 | 97.0 |
| Seyfert 2s | |||||||||
| MRK 348 | 0.302 | 6.285.69 | -14.78 | 2.00 | 480.9 | 499 | 6.34 | 5.81 | 157.0 |
| MRK 1 | 0.320 | 6.275.19 | 0.87 | 0.75 | 109.8 | 115 | 6.31 | 5.32 | 177.3 |
| MRK 1066 | 0.243 | 6.565.21 | 19.39 | 1.20 | 166.8 | 190 | 6.67 | 5.63 | 18.9 |
| NGC 2110 | 0.158 | 6.885.09 | 5.93 | 1.20 | 494.4 | 554 | 7.68 | 5.11 | 9.0 |
| NGC 2273 | 0.125 | 7.934.77 | -29.88 | 0.80 | 85.9 | 102 | 8.32 | 5.34 | 149.6 |
| NGC 5252 | 0.458 | 10.685.12 | -22.24 | 0.70 | 18.9 | 21 | 10.56 | 5.66 | 159.6 |
| NGC 5728 | 0.189 | 11.595.98 | -22.67 | 0.75 | 25.6 | 34.3 | 12.60 | 7.46 | 154.7 |
| 17.5 | 39.4 | 16.10 | 9.39 | 159.9 | |||||
| NGC 7212 | 0.528 | 8.324.84 | -21.85 | 0.45 | 189.4 | 192 | 8.40 | 4.85 | 158.5 |
| NGC 7682 | 0.344 | 10.206.41 | -23.64 | 0.55 | 92.3 | 98 | 10.21 | 6.82 | 150.8 |
| MRK 533 | 0.572 | 6.806.15 | 46.30 | 1.20 | 340.7 | 364 | 6.98 | 6.26 | 44.1 |
| Map parameter | Source parameter | ||||||||
|---|---|---|---|---|---|---|---|---|---|
| Source | Scale | Beam size | P.A. | rms noise | SPeak | SInt. | Fitted size | ||
| name | (kpc/′′) | (arcsec2) | (deg) | (mJy/b) | (mJy/b) | (mJy) | Maj. | Min. | P.A. |
| (arcsec) | (arcsec) | (deg) | |||||||
| Seyfert 1s | |||||||||
| MRK 6 | 0.377 | 23.0411.36 | -22.04 | 3.0 | 853.2 | 944.6 | 24.14 | 11.76 | 158.8 |
| NGC 3227 | 0.079 | 27.4614.27 | -50.31 | 5.6 | 117.0 | 170.0 | 32.61 | 18.02 | 125.8 |
| NGC 3516 | 0.179 | 16.2611.44 | -15.03 | 3.8 | 36.9 | 81 | 37.09 | 14.31 | 25.82 |
| NGC 4151 | 0.068 | 17.2711.68 | -14.00 | 12.0 | 1324.4 | 1348 | 17.10 | 11.64 | 165.9 |
| MRK 766 | 0.261 | 18.1312.75 | -18.95 | 7.5 | 74.8 | 85 | 16.20 | 9.90 | 152.5 |
| MRK 279 | 0.601 | 16.0910.75 | 28.19 | 3.5 | 80.3 | 96 | 17.69 | 11.52 | 31.7 |
| NGC 5548 | 0.344 | 21.6515.17 | -30.72 | 6.5 | 77.6 | 83 | 23.54 | 14.83 | 154.0 |
| ARK 564 | 0.491 | 25.9913.81 | -45.7 | 4.4 | 164.4 | 166 | 24.29 | 12.92 | 131.97 |
| NGC 7469 | 0.328 | 38.0122.06 | -1.01 | 9.5 | 793.5 | 807 | 37.86 | 20.68 | 177.1 |
| MRK 530 | 0.584 | 38.1318.73 | -17.42 | 9.0 | 107.3 | 130 | 46.92 | 21.46 | 156.4 |
| Seyfert 2s | |||||||||
| MRK 348 | 0.302 | 18.5212.88 | -35.86 | 5.6 | 763.4 | 810 | 18.96 | 12.91 | 148.2 |
| MRK 1 | 0.320 | 18.1412.64 | -22.12 | 5.5 | 181.9 | 186 | 17.57 | 12.36 | 163.6 |
| MRK 1066 | 0.243 | 16.8913.25 | -1.87 | 6.0 | 288.6 | 300 | 17.25 | 13.53 | 177.0 |
| NGC 2110 | 0.158 | 43.6334.50 | -0.18 | 25.0 | 1498.5 | 1499 | 38.85 | 32.47 | 1.9 |
| NGC 2273 | 0.125 | 19.0411.06 | -26.39 | 4.0 | 113.8 | 127 | 20.84 | 11.53 | 152.3 |
| NGC 5252 | 0.458 | 38.2112.37 | -25.16 | 3.0 | 19.4 | 26.4 | 46.20 | 19.31 | 152.5 |
| NGC 5728 | 0.189 | 27.4212.94 | -19.36 | 3.0 | 22.8 | 40 | 37.62 | 19.20 | 131.6 |
| NGC 7212 | 0.528 | 40.1629.61 | -1.95 | 7.5 | 523.1 | 551 | 32.85 | 25.79 | 175.4 |
| NGC 7682 | 0.344 | 46.1334.28 | 0.87 | 7.5 | 227.9 | 228 | 38.68 | 29.23 | 17.14 |
| MRK 533 | 0.572 | 17.8716.98 | -33.83 | 9.0 | 639.2 | 842 | 20.01 | 19.04 | 66.3 |
| Source | L240MHz | L610MHz | S1.4GHz | L1.4GHz | S5.0GHz | L5.0GHz | ||||
|---|---|---|---|---|---|---|---|---|---|---|
| name | (erg s-1 Hz-1) | (erg s-1 Hz-1) | (mJy) | (erg s-1 Hz-1) | (mJy) | (erg s-1 Hz-1) | ||||
| Seyfert 1s | ||||||||||
| MRK 6 | 7.871030 | 4.181030 | 269.5 | 2.241030 | 100.5K | 8.371029 | -0.68 | -0.75 | -0.77 | -0.74 |
| NGC 3227 | 6.091028 | 5.301028 | 97.5 | 3.491028 | 35.0Ga | 1.251028 | -0.15 | -0.50 | -0.80 | -0.53 |
| NGC 3516 | 1.481029 | 4.581028 | 31.3 | 5.741028 | 7.4Ga | 1.361028 | -1.26 | +0.27 | -1.13 | -0.71 |
| NGC 4151 | 2.711029 | 1.221029 | 359.6 | 7.241028 | 128.0Ga | 2.581028 | -0.86 | -0.63 | -0.81 | -0.76 |
| MRK 766 | 3.281029 | 2.241029 | 38.1 | 1.471029 | 20.4Ga | 7.861028 | -0.41 | -0.51 | -0.49 | -0.47 |
| MRK 279 | 2.031030 | 9.281029 | 23.2 | 4.891029 | 7.4E | 1.561029 | -0.84 | -0.77 | -0.90 | -0.84 |
| NGC 5548 | 5.511029 | 3.721029 | 28.2 | 1.871029 | 11.2Ga | 7.441028 | -0.42 | -0.83 | -0.73 | -0.68 |
| ARK 564 | 2.411030 | 9.091029 | 28.6 | 4.161029 | 11.4L | 1.661029 | -1.05 | -0.94 | -0.72 | -0.88 |
| NGC 7469 | 4.741030 | 1.711030 | 180.5 | 1.061030 | 61.6Ga | 3.621029 | -1.09 | -0.58 | -0.84 | -0.82 |
| MRK 530 | 2.561030 | 7.881029 | 24.4 | 4.801029 | 11.5E | 2.261029 | -1.26 | -0.59 | -0.59 | -0.77 |
| Seyfert 2s | ||||||||||
| MRK 348 | 4.171030 | 2.571030 | 292.2 | 1.511030 | 801.7Ga | 4.131029 | -0.52 | -0.64 | +0.79 | -0.58 |
| MRK 1 | 1.091030 | 6.751029 | 75.4 | 4.431029 | 32.0GC | 1.881029 | -0.52 | -0.51 | -0.67 | -0.58 |
| MRK 1066 | 9.831029 | 6.231029 | 100.4 | 3.291029 | 35.0GC | 1.151029 | -0.49 | -0.77 | -0.83 | -0.72 |
| NGC 2110 | 2.171030 | 8.011029 | 298.8 | 4.321029 | 165.0Gr | 2.381029 | -1.07 | -0.74 | -0.47 | -0.72 |
| NGC 2273 | 1.031029 | 8.261028 | 62.6 | 5.071028 | 44.0GC | 3.561028 | -0.24 | -0.59 | -0.28 | -0.37 |
| NGC 5252 | 3.311029 | 2.581029 | 16.3 | 2.001029 | 18.1E | 2.221029 | -0.27 | -0.30 | +0.08 | -0.14 |
| NGC 5728 | 7.331028 | 1.361029 | 70.0 | 1.281029 | 17.5S | 3.091028 | +0.66 | -0.07 | -1.09 | …. |
| NGC 7212 | 9.371030 | 3.271030 | 128.0W | 2.181030 | 46.0Gr | 7.831029 | -1.13 | -0.49 | -0.80 | -0.79 |
| NGC 7682 | 1.511030 | 6.511029 | 59.8 | 3.971029 | 24.6E | 1.631029 | -0.91 | -0.59 | -0.70 | -0.72 |
| MRK 533 | 1.661031 | 7.171030 | 220.9 | 4.351030 | 75.1E | 1.481030 | -0.90 | -0.60 | -0.85 | -0.78 |
Notes. 1.4 GHz flux densities are from NVSS catalog (Condon et al. 1998) except for NGC 7212 for which NVSS data are unavailable.
References. (K) Kharb et al. (2006); (E) Edelson (1987); (Ga) Gallimore et al. (2006); (GC) Gregory & Condon (1991); (Gr) Griffith et al. (1995); (L) Lal et al. (2011); (S) Schommer et al. (1988),
(W) White & Becker (1992) .

4 Radio properties of Seyfert galaxies
From our GMRT observations we obtained 240 MHz and 610 MHz radio images of all our 20 Seyfert galaxies (Figure 2.0, Table 3.0 and Table 4.0). In the following sections we discuss the radio properties (luminosities, spectra and morphologies) of Seyfert type 1s and 2s in the framework of the Seyfert unification scheme.
4.1 Radio luminosities of Seyfert type 1s and type 2s
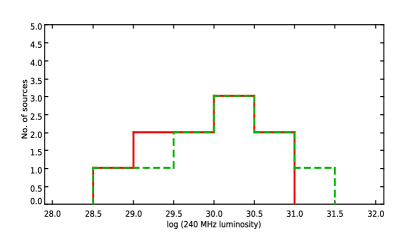
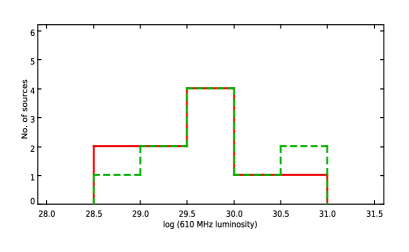
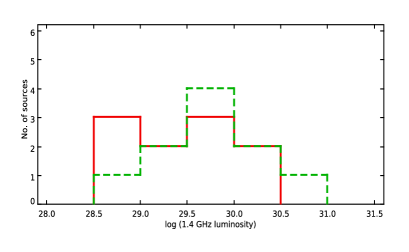
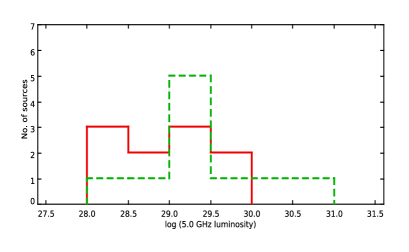
The obscuring torus around the AGN is optically thin at centimeter radio wavelengths and there is no relativistic beaming effect in Seyfert galaxies (Shastri et al. 2003; Middelberg et al. 2004; Ulvestad et al. 2005). Therefore, the measured radio luminosity is expected to be independent to the orientation of the obscuring torus and the radio jet axis. According to the unification scheme both the Seyfert subtypes are intrinsically similar and therefore, both type 1s and type 2s are expected to show similar radio luminosities. This prediction of the unification scheme has been tested in some previous studies yielding different results. For example, early studies reported in de Bruyn & Wilson (1978); Ulvestad & Wilson (1984a) suggest that Seyfert type 2s are more radio powerful than Seyfert type 1s at centimeter wavelengths, giving results inconsistent with the unification scheme. However, later studies (Ho & Ulvestad 2001) argued that the samples used in earlier studies were biased towards radio powerful Seyfert type 2s. High resolution 3.6 cm VLA observations showed that the two Seyfert subtypes have similar radio luminosities in samples based on 12 m (Thean et al. 2001) and 60 m (Schmitt et al. 2001). We make statistical comparison of the radio luminosities of the two subtypes using 240 MHz, 610 MHz GMRT observations and 1.4 GHz (NVSS), 5.0 GHz observations of relatively low resolution ( 20 - 45). Our observations are likely to pick up extended kpc-scale emission along with the nuclear AGN emission. In the unification scheme both Seyfert subtypes expected to have similar likelihood of the presence of kpc-scale radio emission. Therefore, type 1s and type 2s are expected to show similar luminosity distributions obtained with low as well as high frequency/resolution radio observations. Figure 3.0 shows the radio luminosity distributions at 240 MHz, 610 MHz, 1.4 GHz and 5.0 GHz of the type 1s and type 2s of our sample Seyferts. Seyfert type 1s have 240 MHz, 610 MHz, 1.4 GHz and 5.0 GHz luminosities in the range of L 6.091028 - 7.871030 erg s-1 Hz-1, L 5.301028 - 4.581030 erg s-1 Hz-1, L 3.491028 - 2.241030 erg s-1 Hz-1, and L 1.251028 - 8.371029 erg s-1 Hz-1, respectively, with the median values L 2.031030 erg s-1 Hz-1, L 7.881029 erg s-1 Hz-1, L 4.161029 erg s-1 Hz-1, and L 1.561029 erg s-1 Hz-1, respectively. While type 2s have 240 MHz, 610 MHz, 1.4 GHz and 5.0 GHz luminosities in the range of L 7.331028 - 9.371030 erg s-1 Hz-1, L 8.261028 - 7.171030 erg s-1 Hz-1, L 5.071028 - 4.351030 erg s-1 Hz-1, and L 3.091028 - 1.481030 erg s-1 Hz-1, respectively, with the median values L 1.511030 erg s-1 Hz-1, L 6.751029 erg s-1 Hz-1, L 4.321029 erg s-1 Hz-1, and L 2.221029 erg s-1 Hz-1, respectively. We note that the radio luminosity distributions for the two Seyfert subtypes at 240 MHz, 610 MHz, 1.4 GHz and 5.0 GHz span over similar range with similar median values at the respective frequencies. The two sample Kolmogorov-Smirnov statistical test shows that there is 99 probability that the L and L distributions of the two Seyfert subtypes are drawn from the same parent population. The 1.4 GHz and 5.0 GHz luminosity distributions of the two Seyfert subtypes are also not statistically different (Table 6.0). Our results on the comparison of radio luminosity are in complement with the previous studies which reported that the pc-scale nuclear radio luminosities at higher frequencies are similar for the two Seyfert subtypes (Lal et al. (2011)).
4.2 Radio spectra of Seyfert type 1s and type 2s
Most of the previous studies on the spectral properties of Seyfert galaxies have been limited mainly to high frequency regime ( 1.4 GHz)
(Barvainis et al. 1996; Rush et al. 1996; Morganti et al. 1999). Therefore, we aim to explore the nature of the radio spectra of Seyfert galaxies at relatively lower frequencies
extending down to 240 MHz. And, we compare the radio spectra of Seyfert type 1s and type 2s in the framework of the unification scheme.
We discussed in the previous section that the radio luminosity/flux in Seyfert galaxies is independent to the orientation of the obscuring torus.
This result implies that radio spectra should also be similar for the Seyfert type 1s and type 2s.
This prediction of the unification scheme on the radio spectra have been examined in some of the previous studies reporting varying results.
For instance, Edelson (1987) measured three point (1.4 GHz, 5.0 GHz and 20 GHz) radio spectra of Seyfert galaxies and
reported that type 1s and 2s show steep ( 0.7, Sν ) radio spectra
with type 1s occasionally tend to show flatter or inverted spectra. However, Rush et al. (1996) reported that there is no significant
difference between the average 1.4 GHz - 5.0 GHz spectral indices of Seyfert type 1s and type 2s.
Barvainis et al. (1996) studied four point (1.5 GHz, 4.9 GHz, 8.4 GHz and 14.9 GHz) radio spectra and reported that the radio spectral shapes of
Seyfert galaxies and radio-quiet quasars are quite heterogeneous.
We obtain two point spectral indices and integrated radio spectra over 240 MHz to 5.0 GHz, of our sample Seyfert galaxies using
240 MHz, 610 MHz flux densities from our GMRT observations, 1.4 GHz flux densities from NVSS (Condon et al. 1998) and 5.0 GHz flux densities from
the literature (Gallimore et al. (2006); Edelson (1987); Griffith et al. (1995)).
Since GMRT observations at 240 MHz, 610 MHz and NVSS observations at 1.4 GHz are of relatively low resolution,
we considered 5 GHz flux density measured with low resolution observations,
VLA in ‘D’ configuration (Gallimore et al. 2006; Edelson 1987) or from single dish Green Bank and Parkes radio telescopes (Griffith et al. 1995; Gregory & Condon 1991).
Table 5 lists the two point radio spectral indices measured between 240 MHz to 610 MHz (),
610 MHz to 1.4 MHz () and 1.4 GHz to 5.0 GHz ()
as well as the integrated radio spectral indices () estimated using four flux density points.
Figure 4.0 shows the four point (240 MHz, 610 MHz, 1.4 GHz and 5.0 GHz) radio spectra of all our sample Seyfert galaxies.
The integrated radio spectral index () is obtained by fitting all four spectral points with a linear chi-square fit.
The slope of the line fit in logarithmic scale gives the index of the powerlaw spectrum (Sν ).
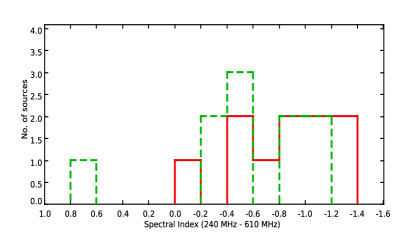
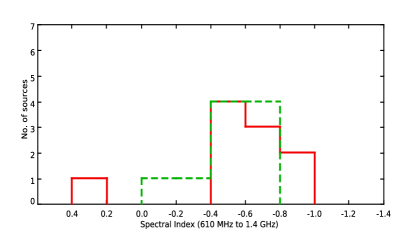
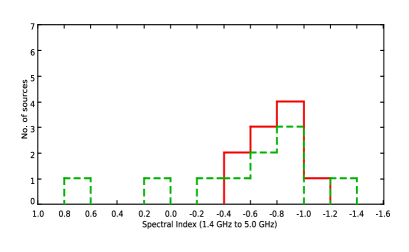
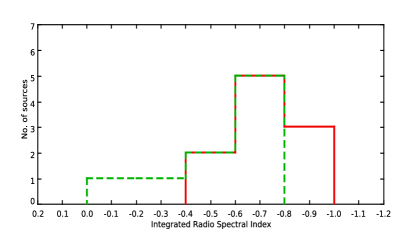
Figure 5.0 shows the distributions of two points , ,
and integrated spectral indices for Seyfert type 1s and type 2s of our sample.
We note that spectral index distributions for the two subtypes span over similar range with median spectral indices
-0.83, -0.59,
-0.77, -0.74 for type 1s and
-0.52, -0.59,
-0.67, -0.72 for type 2s (Table 6.0).
The statistical comparison using two sample KS test shows that the distributions of spectral indices for the two Seyfert subtypes are not
very different (Table 6).
Since the synthesized beam size is different at different frequencies ( 20′′ - 40′′ at 240 MHz,
8′′ - 10′′ at 610 MHz, 45′′ at 1.4 GHz
and 20′′ or larger at 5.0 GHz), it may result an error in the estimated spectral index values.
For example, the larger NVSS synthesized beam (45′′) at 1.4 GHz compared to the GMRT synthesized beam
( 8′′ - 10′′) at 610 MHz may result less steep spectrum than actual.
We assume a conservative fiducial error values of 15 at 240 MHz flux density, 10 at 610 MHz flux density, 7 at 1.4 GHz flux density
and 7 at 5.0 GHz flux density.
The assumed errors in flux densities can result
8, 5, 4 and 7 errors in ,
, and respectively.
Also, non-simultaneous observations may contribute to error in , and
estimates, if the source flux density varies in between two observations. Moreover, the estimates of
are free from the error due to non-simultaneity since 240 MHz and 610 MHz flux densities are
from simultaneous GMRT observations.
In MRK 348, the 5.0 GHz flux density ( 807.1 mJy from VLA ‘D’ array observations (Gallimore et al. 2006)) is much higher than expected
from powerlaw spectral shape determined by 240 MHz, 610 MHz and 1.4 GHz flux densities. Therefore, we consider 5.0 GHz flux density as an outlier
in fitting the radio spectrum of MRK 348. The unusual high flux density at 5.0 GHz can be attributed to strong variability
as the core of MRK 348 is variable at 5.0 GHz on a scale of months (Neff & de Bruyn 1983; Ulvestad et al. 1999).
However, it is worth noting that except in few cases (Neff & de Bruyn 1983; Wrobel 2000; Falcke et al. 2000),
most of the Seyfert galaxies show little radio variability over the period of few years (Edelson 1987; Mundell et al. 2009)
and therefore our statistical results are not expected to be affected much by variability.
We note that most of the Seyfert galaxies in our sample have steep integrated radio spectra ( -0.65 to -0.85),
except NGC 5252 and NGC 5728 which show flat and inverted spectrum, respectively.
Since NGC 5728 shows inverted spectrum over 240 MHz to 5.0 GHz, we do not obtain integrated spectral
index measured by linear chi-square fit.
There are a few sources NGC 3227, MRK 1066, NGC 5548 which show hint of spectral flattening at lower frequency.
While a few cases (NGC 3516, MRK 530) show hint for spectral steepening at lower frequencies.
The steep radio spectrum can be interpreted as emission produced via synchrotron radiation by a population of relativistic electrons and
are typically associated to relatively extended emission.
The integrated radio spectral shape of Seyfert galaxy can be attributed to the combined contributions of all the radio emitting components.
In low resolution radio observations, the radio emission from Seyfert galaxies can have contributions from four components,
a partially opaque synchrotron emission from a compact parsec-scale nuclear core, optically thin synchrotron emission from an extended component
powered by AGN, optically thin synchrotron emission from star forming regions present in the host galaxy disk and
a circumnuclear starburst emission (Wilson et al. 1991).
The relative fraction of these emitting components may vary from one source to another and in turn, may change the spectral shape.
Previous radio studies have shown that the total radio emission in Seyfert galaxies may have contributions from host galaxy disk and
from starburst regions but the radio emission in most of the Seyfert galaxies is dominated by nuclear radio emission
characterized with high brightness temperature, steep spectrum and non-thermal emission (Kukula et al. 1998).
The extended emission powered by AGN as well as star formation give rise the steep spectrum and therefore it is difficult to
conclude whether emission is either powered by AGN or starburst by using only spectral shape information.
In case of sources showing flat or inverted spectra, the total radio emission
is likely to be dominated by the compact nuclear core which is partially opaque to synchrotron emission (Kukula et al. 1998).
The compact nuclear radio emission characterized with high brightness temperature ( 108 K) and
inverted spectrum seen in some of Seyfert galaxies
is indicative of the synchrotron self-absorption close to the jet-emanating region (Mundell et al. 2000), however,
the free-free absorption by thermal, ionized gas in the vicinity of the nucleus might also be sufficient to flatten the
intrinsically steeper synchrotron spectra (Ho & Ulvestad 2001).


4.3 Radio morphologies of Seyfert type 1s and type 2s
High resolution radio observations of Seyfert galaxies show parsec-scale nuclear emission often accompanied with jet-like elongated feature, which is believed to represent outflowing radio emitting plasma from AGN, in the form of jets, bubbles or plasmoids (Wilson & Ulvestad 1982b; Thean et al. 2001; Lal et al. 2004). These are thought to be small-scale, low-power versions of the large-scale jets seen in radio loud AGNs. Radio observations of relatively lower resolution reveal that several Seyfert galaxies exhibit extended radio emission up to few kpc (Baum et al. 1993; Colbert et al. 1996; Gallimore et al. 2006). The comparison of the radio sizes of two Seyfert subtypes can be used to test the unification scheme, provided that the radio emission is primarily due to linear jet-like outflows emanating from AGN and radio structures are well resolved. According to the orientation based unification scheme, Seyfert type 1s are expected to show smaller projected radio source sizes than type 2s, since radio jets in type 1s are expected to lie along the line-of-sight to the observer, and hence to be foreshortened. Early studies attempted to test this prediction reported that Seyfert type 2s are larger in radio than type 1s (Ulvestad & Wilson (1984a)). Although, after controlling for the strengths of the radio sources Ulvestad & Wilson (1989) found that the differences in radio sizes of two subtypes are not statistically significant. Using a sample of Seyfert galaxies based on 60 m, Schmitt et al. (2001) reported the radio sizes of type 2s are systematically larger than type 1s. While, Ulvestad & Ho (2001) reported that type 1s appears to be larger than type 2s, which is inconsistent to the unification scheme.
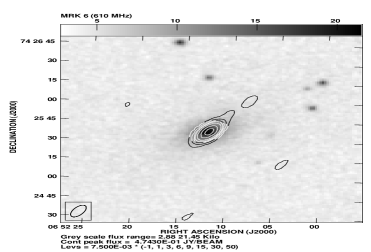
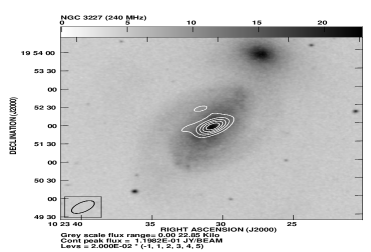
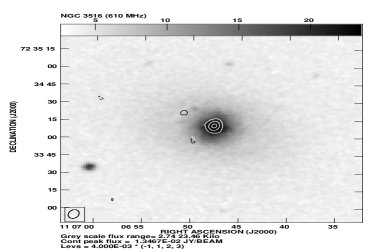
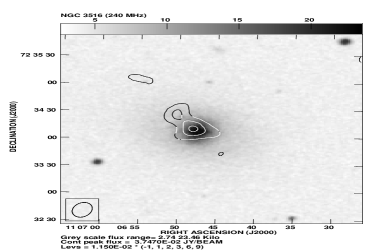
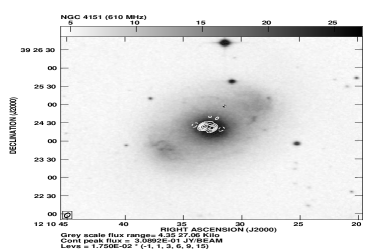
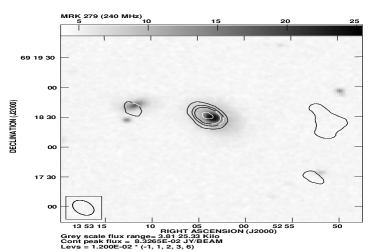
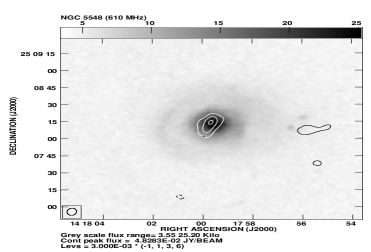
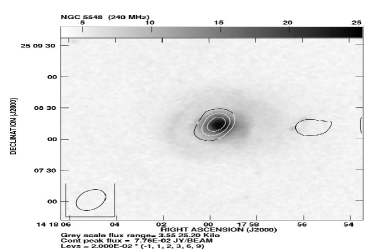
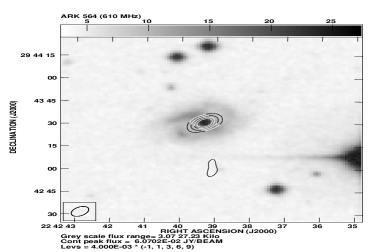
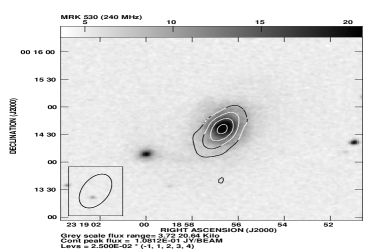
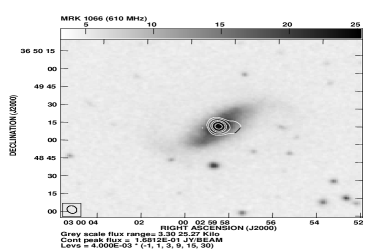
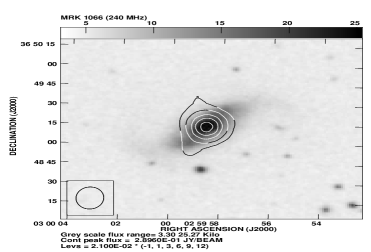
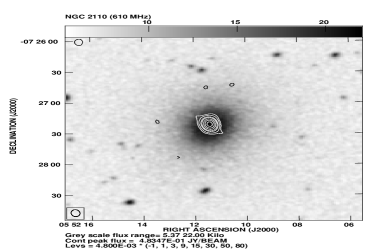
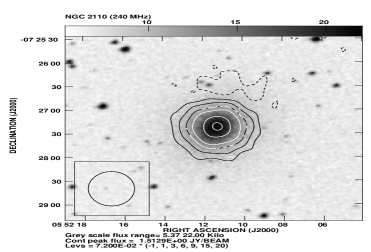
We carried out our GMRT observations with the primary aim to study the radio spectra of Seyfert galaxies at lower frequencies. Moreover, we attempt to study the low-frequency radio morphologies of our sample Seyfert galaxies. Figure 2.0 shows the 240 MHz and 610 MHz radio contour images overlaid on their Digital Sky Survey (DSS) optical images for all of our sample Seyfert galaxies. Table 3.0 and Table 4.0 list the map parameters (synthesized beam size, its position angle and noise rms) and source parameters (total flux density (Sint), peak flux density (Speak) and source fitted sizes) for all the 20 Seyfert galaxies at 610 MHz and 240 MHz, respectively. In our 610 MHz radio maps the typical noise rms and resolution are 1.0 mJy/beam and 8′′ - 10′′, respectively, while at 240 MHz, the typical noise rms is 7.5 mJy/beam and resolution is 18′′ - 40′′. We use AIPS task ‘JMFIT’ to measure the angular size of the source. Most of our sample sources are fitted with only one Gaussian component. The radio emission at 610 MHz is fitted with a single Gaussian in all of our sample sources except for NGC 4151 and NGC 5728. In NGC 4151 and NGC 5728, the 610 MHz radio emission has two distinct components which are fitted with two elliptical Gaussian components. At 610 MHz, several of our sample sources, NGC 3516, NGC 4151, NGC 5548, NGC 7469, MRK 1066 and NGC 5728 have fitted Gaussian sizes larger than their synthesized beams which indicate the possibility of the existence of kpc-scale extended radio emission in these sources. Indeed, some of our sample sources NGC 4151, MRK 766, MRK 348, NGC 5548, NGC 7469 are reported to possess kpc-scale extended emission at 5.0 GHz (Gallimore et al. 2006). At 240 MHz, all our sources are fitted with a single Gaussian component with sizes similar to their synthesized beams. Thus all our sample Seyferts can be interpreted as unresolved point sources at 240 MHz. We do not compare the radio sizes of the two Seyfert subtypes as most of our sample sources are seen as unresolved point sources at 240 MHz and 610 MHz. Moreover, both Seyfert type 1s and type 2s in our sample show similar likelihood of being represented as unresolved point sources at the given sensitivity and resolution of our 240 MHz and 610 MHz GMRT observations. The low-frequency radio emission in Seyfert galaxies may have contributions from star-forming regions or starburst other than the AGN. But our marginally resolved or unresolved radio images do not allow us to put any constrain on the relative contributions from different emitting components.
| Distribution | statistical parameters | KS test | F.D. Ref. | ||||||||
|---|---|---|---|---|---|---|---|---|---|---|---|
| Seyfert type 1s | Seyfert type 2s | ||||||||||
| min | max | SD | median | min | max | SD | median | D | p-value | ||
| logL | 28.78 | 30.90 | 0.66 | 30.31 | 28.87 | 31.22 | 0.73 | 30.18 | 0.2 | 0.99 | 1 |
| logL | 28.66 | 30.62 | 0.61 | 29.90 | 28.92 | 30.86 | 0.58 | 29.83 | 0.2 | 0.99 | 1 |
| logL | 28.54 | 30.35 | 0.55 | 29.62 | 28.70 | 30.64 | 0.55 | 29.64 | 0.3 | 0.79 | 2 |
| logL | 28.10 | 29.92 | 0.57 | 29.19 | 28.51 | 30.62 | 0.63 | 29.35 | 0.3 | 0.79 | 3 |
| -1.26 | -0.15 | 0.36 | -0.83 | -1.13 | +0.66 | 0.50 | -0.52 | 0.3 | 0.79 | 1 | |
| -0.94 | +0.27 | 0.31 | -0.59 | -0.77 | -0.07 | 0.20 | -0.59 | 0.3 | 0.79 | 1,2 | |
| -1.13 | -0.49 | 0.16 | -0.77 | -1.38 | +0.79 | 0.57 | -0.67 | 0.4 | 0.42 | 2,3 | |
| 0.88 | -0.47 | 0.12 | -0.74 | -0.79 | -0.14 | 0.20 | -0.72 | 0.38 | 0.51 | 1,2,3 | |
Notes. Flux density (F.D.) references: (1) our GMRT observations; (2) NRAO VLA Sky Survey (NVSS); (3) Literature (Gallimore et al. 2006; Edelson 1987; Gregory & Condon 1991; Griffith et al. 1995). The adopted conservative error values of 15, 10, 7 and 7 for S240MHz, S610MHz, S1.4GHz and S5.0GHz, respectively, render 8, 5, 4 and 7 errors in , , and , respectively. Radio luminosities are in units of ergs s-1 Hz-1. Kolmogorov - Smirnov (KS) two sample test examines the hypothesis that two samples comes from same distribution. D = Sup x S1(x) - S2(x) is the maximum difference between the cumulative distributions of two samples S1(x) and S2(x), respectively.
5 Conclusions
We present low-frequency radio images and spectra of our sample of 20 Seyfert galaxies wherein the sample is based on orientation independent isotropic properties. In our sample the two subtypes have matched distributions in orientation-independent parameters which allow us to assume that the two subtypes are intrinsically similar within the framework of the unification scheme. Here we outline following conclusions from our study.
-
1.
This work is the first attempt, to our knowledge, for a systematic study of low-frequency radio imaging and spectral properties of a well defined sample of Seyfert galaxies.
-
2.
The 240 MHz, 610 MHz, 1.4 GHz and 5.0 GHz radio luminosities of our sample Seyfert galaxies are in the range of 1028 - 1031 erg s-1. The 240 MHz, 610 MHz, 1.4 GHz and 5.0 GHz radio luminosity distributions of Seyfert type 1s and type 2s span over similar range with similar median values at the respective frequencies. The two sample KS test shows that 240 MHz, 610 MHz, 1.4 GHz and 5.0 GHz radio luminosity distributions of the two Seyfert subtypes are similar with statistically significant probability.
-
3.
We obtain integrated radio spectra over 240 MHz to 5.0 GHz, of all our 20 Seyfert galaxies. We find that the distributions of two point spectral indices (, , ) as well as integrated spectral index for the two subtypes span over similar range with median values -0.83, -0.59, -0.77, -0.74 for type 1s, and -0.52, -0.59, -0.67, -0.72 for type 2s. The two sample KS test shows that the distributions of spectral indices for the two Seyfert subtypes are not statistically different.
-
4.
We note that most of the Seyfert galaxies in our sample have steep integrated radio spectra ( -0.7) except NGC 5252 and NGC 5728 which show flat and inverted spectrum, respectively. The average steep radio spectral index is consistent with the previous studies (Morganti et al. 1999) and can be explained as optically thin synchrotron emission.
-
5.
610 MHz radio images of our sample sources can generally be represented as unresolved point sources wherein the radio emission is fitted with a single Gaussian component in all of our sample sources except for NGC 4151 and NGC 5728. In NGC 4151 and NGC 5728, the 610 MHz radio emission shows two distinct components.
-
6.
At 240 MHz, all our sample sources show radio emission as unresolved point source as the radio emission is fitted with a single Gaussian component with sizes similar to their synthesized beams.
-
7.
Radio images in our snap-shot GMRT 240/610 MHz observations remain mostly unresolved. This does not allow us to compare the radio sizes of the two Seyfert subtypes in the framework of the unification scheme. Moreover, both Seyfert type 1s and type 2s in our sample show similar likelihood of being represented as unresolved point sources at the given sensitivity and resolution of our 240 MHz and 610 MHz GMRT observations.
-
8.
In our study we have shown that the multifrequency radio properties luminosity and spectral distributions over 240 MHz to 5 GHz of our sample Seyfert galaxies are not inconsistent with the orientation and obscuration based unification scheme. In the appendix, we discuss 240/610 MHz GMRT radio properties and its comparison to the radio observations reported in the literature for all the individual sources in our sample. Our results on the low-frequency radio properties are complementary and consistent with the high-frequency radio observations reported in the literature.
Acknowledgements.
We thank the staff of GMRT who have made these observations possible. GMRT is run by the National Centre for Radio Astrophysics of the Tata Institute of Fundamental Research. VS would like to thank Dr. Chiranjib Konar for helpful discussions on 240 MHz GMRT data reduction. Also, this research has made use of the NASA/IPAC Extragalactic Database (NED) which is operated by the Jet Propulsion Laboratory, California Institute of Technology, under contract with the National Aeronautics and Space Administration.Appendix A Notes on individual sources
In this section we describe the radio properties of individual sources of our sample.
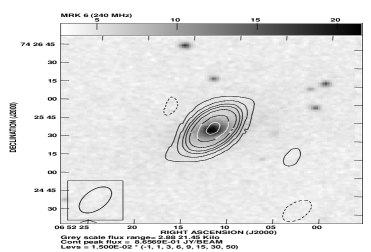
A.1 MRK 6
Kharb et al. (2006) presented a detailed study on MRK 6 radio morphology and reported that the radio emission is seen on three different spatial scales 7.5 kpc bubbles, 1.5 kpc bubbles lying nearly orthogonal to each other, and a 1 kpc radio jet lying orthogonal to the 1.5 kpc bubble. They suggested that the existence of kpc scale radio bubbles/lobes can be attributed to the radio relics related to past episodic nuclear activity. Our radio images at 610 MHz and 240 MHz show only single component that is fitted with elliptical Gaussian of 10.425.06 and 24.1411.76, respectively. The radio emission at 610 MHz and 240 MHz are likely to include all the emitting components detected by Kharb et al. (2006) as the combined 5.0 GHz flux density of all the components in Kharb et al. (2006) follow the spectral shape determined by our 240 MHz, 610 MHz GMRT and 1.4 GHz NVSS flux densities.
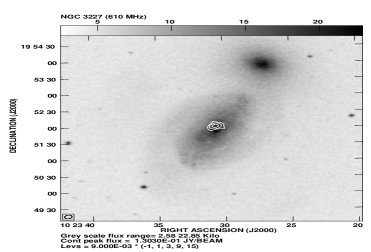
A.2 NGC 3227
8.4 GHz VLA observations show north-south elongated nuclear radio emission and at sub-arcsec resolution, the core is resolved into 0′′.4 double sources (Mundell et al. 1995). 5.0 GHz VLA ‘D’ array observations show the kpc-scale extended radio emission which is interpreted as the emission from star-forming host galaxy disk (Gallimore et al. 2006). Our GMRT images at 610 MHz and 240 MHz show radio emission as nearly unresolved point sources which are fitted with an elliptical Gaussian of 8.856.70 and 32.6118.02, respectively. The fitted powerlaw radio spectrum over 240 MHz to 5.0 GHz renders spectral index () -0.53, while there is an indication of spectral flattening toward lower frequencies.
A.3 NGC 3516
High resolution VLA observations of NGC 3516 show a compact flat-spectrum core with a 0′′.7 ( 120 pc) one-sided northern extension along P.A. 8∘ (Nagar et al. 1999). At arcsec resolution, additional radio components are seen that extend out to 4′′ ( 740 pc) and align with the co-spatial S-shaped optical emission-line structure (Miyaji et al. 1992; Ferruit et al. 1998). At coarser resolution, a linear radio structure spanning 45′′ ( 8.3 kpc), oriented along P.A. 44∘, across the nucleus is also seen (Baum et al. 1993). In our GMRT observations, the 610 MHz radio emission is detected as marginally resolved point source fitted with an elliptical Gaussian of 10′′.447′′.38. The integrated flux density at 610 MHz is substantially higher than the peak flux density and also, the fitted Gaussian size is larger than the synthesized beam size, and this may be indicative of the presence of extended emission at the kpc-scale. We fit the 240 MHz radio emission with a large Gaussian of 37′′.0914′′.31. There is hint of second component along the north-east direction from the central nuclear component which seems to be consistent with the radio morphology reported by Baum et al. (1993). NGC 3516 shows inverted spectrum between 1.4 GHz and 610 MHz while a steep spectrum between 610 MHz and 240 MHz. The changing spectral behavior can be interpreted as the presence of at least two emitting component. Possibly 5.0 GHz to 610 MHz is dominated by compact AGN core having self absorbed synchrotron emission and low frequency emission at 610 MHz to 240 MHz is dominated by optically thin synchrotron emission from extend component.
A.4 NGC 4151
The nuclear radio source in NGC 4151 resolves into compact knots aligned in a slightly curved jet structure spanning 5′′ ( 340 parsec) across the nucleus and oriented along P.A. 80∘ (Ulvestad et al. 1981; Booler et al. 1982; Wilson & Ulvestad 1982b; Pedlar et al. 1993; Mundell et al. 2003). The WSRT observations of NGC 4151 revealed a 15′′ ( 1 kpc) linear structure, roughly aligned with the inner jet, and a bracketing pair of radio continuum arcs located at 45′′ ( 3 kpc) from the radio nucleus (Baum et al. 1993). In our GMRT observations, the 610 MHz radio emission is double peaked with less stronger peak residing at a distance of 8′′.54 along the P.A. 65∘.2 from the central component. The 610 MHz radio emission can be fitted with two elliptical Gaussian components with central component having peak flux density 312.9 mJy/beam and convolved size 8′′.125′′.28, while the second Gaussian component has peak flux density 218.1 mJy/beam and convolved size 8′′.30 5′′.74. Owing to its larger beam-size, the 240 MHz radio image shows a nearly unresolved point source fitted with a Gaussian of 17′′.1011′′.64. The four point radio spectrum remains fairly steep ( -0.76) over 240 MHz to 5.0 GHz.
A.5 MRK 766
8.4 GHz VLA ‘A’ and ‘C’ array observations of MRK 766 show an unresolved point source emission and no evidence for emission at intermediate scale (Kukula et al. 1995). In our GMRT observations, the 610 MHz and 240 MHz radio emission is seen as unresolved point sources that are fitted with Gaussian of 7′′.924′′.81 and 16′′.209′′.90, respectively. The four point integrated radio spectral index ( -0.47) is less steep than average spectral index for our sample Seyfert galaxies.
A.6 MRK 279
VLA observations of MRK 279 at 8.4 GHz show an unresolved point source emission in both ‘A’ and ‘C’ array configurations and no evidence for emission at intermediate scale (Kukula et al. 1995). Our GMRT observations at 610 MHz and 240 MHz show radio emission as unresolved point source fitted with the Gaussian of sizes 7′′.865′′.54 and 17′′.6911′′.52, respectively. The four point radio spectrum of MRK 279 is fairly steep with integrated spectral index () -0.88.
A.7 NGC 5548
VLA observations of NGC 5548 revealed a compact core between two diffuse lobes separated by 15′′ (Wilson & Ulvestad 1982a). Using VLA ‘D’ array observations Gallimore et al. (2006) detected marginally resolved lobes along with the nuclear point source emission. In our GMRT observations, we fit the 610 MHz radio emission with a Gaussian of 14′′.337′′.11. We note that the 610 MHz total flux density is significantly higher than the peak flux density and also the fitted Gaussian size is larger than the synthesized beam size. This may infer the presence of kpc-scale extended radio emission. At 240 MHz, the radio emission is nearly an unresolved point source fitted with a Gaussian of 23′′.5414′′.83. The four point radio spectrum of NGC 5548 is fitted with spectral index of () -0.68.
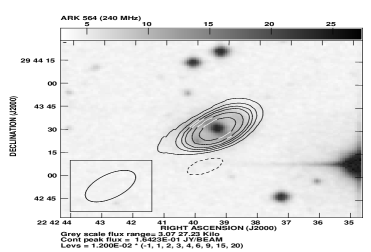
A.8 ARK 564
8.4 GHz VLA observations of ARK 564 show a triple radio source along the north-south direction (P.A. 6∘), extended to 320 pc (Moran 2000). In our GMRT observations, the radio emission at 610 MHz and 240 MHz is nearly point source emission fitted with Gaussian of 7′′.62 4′′.91 and 24′′.2912′′.92, respectively. The four point radio spectrum over 240 MHz to 5.0 GHz is fairly steep with integrated spectral index () -0.88.
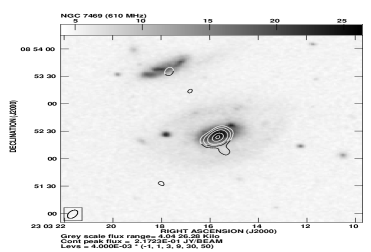
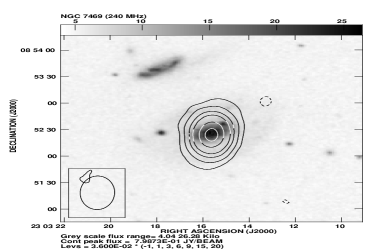
A.9 NGC 7469
1.6 GHz VLBI observations resolved the core-jet structure into five different components, lying in an east-west line which extends up to 55 pc (Lonsdale et al. 2003). A variety of observations at high spatial resolution indicate that the AGN in NGC 7469 is surrounded by a ring of starburst (Mauder et al. 1994; Genzel et al. 1995) with radio observations showing an unresolved central component surrounded by the ring-like structure (Wilson et al. 1991). In our GMRT observations, the radio emission at 610 MHz and 240 is fitted with single Gaussian components with sizes of 10′′.436′′.70 and 37′′.8620′′.68, respectively. The integrated flux density at 610 MHz is substantially higher than the peak flux density and also the fitted Gaussian size is larger than the synthesized beam size. And, this may be considered as an indication for the presence of kpc-scale extended emission in NGC 7469. The four point radio spectrum of NGC 7469 is fairly steep with integrated spectral index () -0.82.
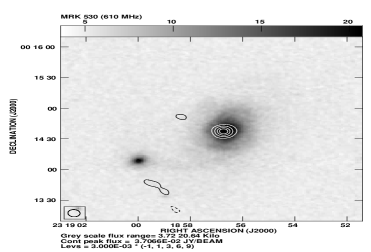
A.10 MRK 530
VLA observations of MRK 530 at 8.4 GHz show a compact point source emission with a slight extension (Kukula et al. 1995). The milli-arcsec resolution VLBI observations showed a compact core emission with extension along east-west direction at fainter levels (Lal et al. 2004). In our GMRT observations, the radio emission at 610 MHz and 240 MHz is seen as nearly point source that is fitted with single Gaussian components of sizes 7′′.287′′.18 and 46′′.9221′′.46, respectively. The four point radio spectrum of MRK 530 is fairly steep () -0.77.
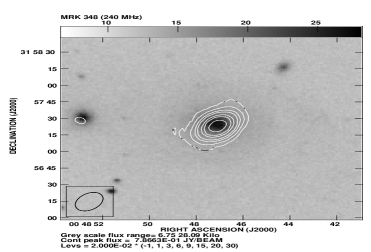
A.11 MRK 348
In MRK 348, the radio continuum emission is dominated by a variable, subparsec-scale ( 0.5 pc) jet that feeds into a larger ( 60 pc) linear radio structure oriented roughly north-south (Neff & de Bruyn 1983; Ulvestad et al. 1999; Antón et al. 2002). Baum et al. (1993) observed large-scale radio lobes ( 6 kpc extent) that roughly align with the small-scale jet structure. Using 5.0 GHz VLA ‘D’ array observations, Gallimore et al. (2006) reported the presence of extended emission such that the large-scale lobes are marginally resolved after the nuclear point source subtraction. In our GMRT observations, the radio emission 610 MHz and 240 MHz is seen as nearly point source that we fit with single Gaussian components of sizes 6′′.345′′.81 and 6′′.34 5′′.81, respectively. The radio spectrum of MRK 348 fitted over 240 MHz to 1.4 GHz has index () -0.58. The 5.0 GHz flux density appears to be dominated by variable AGN core component and does not fit with the spectral index measured over 240 MHz to 1.4 GHz.
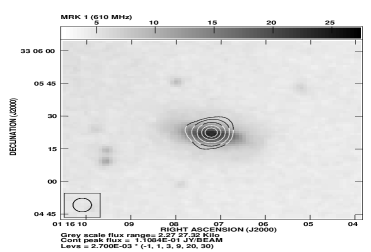
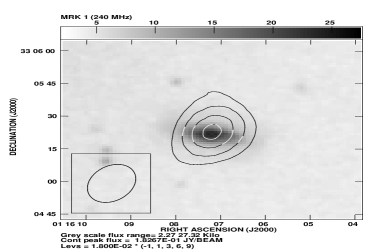
A.12 MRK 1
VLA observations of MRK 1 show an unresolved point source radio emission from AGN (Kinney et al. 2000). In our GMRT observations, 610 MHz and 240 MHz radio images are like point source emission and are fitted with single Gaussian components of sizes 6′′.31 5′′.32 and 17′′.5712′′.36, respectively. The four point radio spectrum of MRK 1 is fitted with an index () -0.58.
A.13 MRK 1066
4.9 GHz VLA observations of MRK 1066 show a linear, probably triple, source extending 2′′.8 along P.A. 134∘ (Ulvestad & Wilson 1989). Using 1.4 GHz and 8.4 GHz VLA observations Nagar et al. (1999) reported that the 1.4 GHz radio emission can be fitted with a single Gaussian component and 8.4 GHz radio emission displays the central source and northwest extension along the position angle 305∘ with respect to the core. A more diffuse southeast extension along the position angle 140∘ with respect to the core also seems to be present (Nagar et al. 1999). In our GMRT observations, 610 MHz and 240 MHz radio images show nearly point source emission and are fitted with single Gaussian components of sizes 6′′.675′′.63 and 17′′.2513′′.53, respectively. The integrated radio spectral index fitted over 240 MHz to 5.0 GHz is -0.72.
A.14 NGC 2110
VLA observations show a symmetrical, jet-like radio emission, extending 4′′ in the north-south direction and straddling a central compact core (Ulvestad & Wilson 1984b). Using 1.4 GHz and 8.4 GHz VLA (A and AnB hybrid array configuration) observations Nagar et al. (1999) reported 1.4 GHz emission as a point source emission, while at 8.4 GHz a linear jet-like structure was noticed along the position angle 9 ∘. In our GMRT observations, the radio emission at 610 MHz and 240 MHz are are seen as nearly point source emission. We fit 610 MHz and 240 MHz emission with single Gaussian components of sizes 7′′.685′′.11 and 38′′.8532′′.47, respectively. The four point radio spectrum of NGC 2110 is steep with integrated spectral index () -0.72.
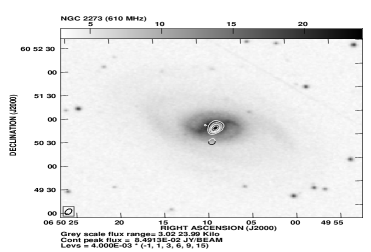
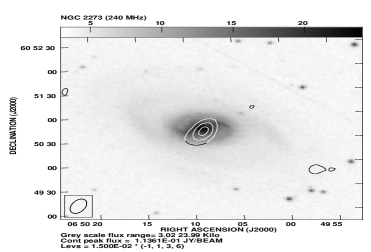
A.15 NGC 2273
5.0 GHz sub-arcsec resolution VLA observations of NGC 2273 show an unequal double with a separation of 1′′.2 ( 145 pc) at P.A. 90∘. While observations at 1.4 GHz show the double structure embedded in a more amorphous structure with an extent of 2′′.5 ( 300 pc) along P.A. 20∘ (Ulvestad & Wilson 1984b). 5.0 GHz WSRT observations show an additional amorphous structure on lager scale and suggest an extended emission with a total extent of 9′′ ( 1 kpc) along P.A. 160∘ (Baum et al. 1993). In our GMRT observations, the radio images at 610 MHz and 240 MHz show nearly point source emission which is fitted with single Gaussian components of 8′′.325′′.34 and 20′′.8411′′.53, respectively. The 610 MHz radio image appears to be marginally resolved. The four point radio spectrum of NGC 2273 is relatively flat with integrated spectral index () -0.37.
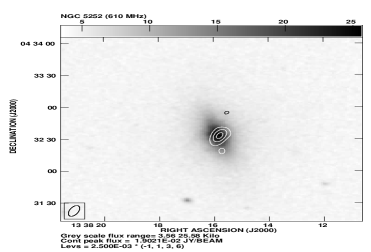
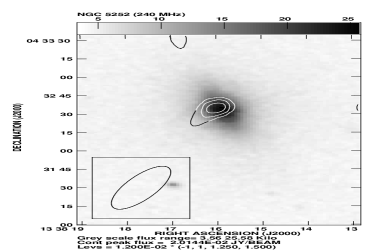
A.16 NGC 5252
1.4 GHz and 5 GHz VLA observations show a radio structure consisting of a central, compact core, with a relatively flat spectrum and a weaker emission extending 2′′ north and south of the core (Wilson & Tsvetanov 1994). Nagar et al. (1999) confirm the overall flatter spectrum of the core ( -0.32) and the radio continuum features seen in the earlier observations. In our GMRT observations, we fit the radio emission at 610 MHz and 240 MHz with single Gaussian components of sizes 10′′.565′′.66 and 46′′.2019′′.31, respectively. The four point radio spectrum of NGC 5252 is flat with integrated spectral index () -0.14, suggesting that the radio emission over 240 MHz to 5.0 GHz is dominated by compact AGN core.
A.17 NGC 5728
5.0 GHz and 14.9 GHz VLA observations of NGC 5728 show a compact core and a faint radial feature extending along north-east (Schommer et al. 1988). In our 610 MHz GMRT image we noticed a double peaked emission wherein the second off-nuclear component may correspond to the nuclear star-forming region reported in previous studies (Schommer et al. 1988; Mazzuca et al. 2008). The peaks of the two emitting components are separated by 10′′.7 ( 2.0 kpc) with the off-nuclear component residing along P.A. 67∘ from the central nuclear component. The two components have peak flux densities 25.6 mJy/beam and 17.5 mJy/beam and are fitted with Gaussian of sizes 12′′.607′′.46 and 16′′.109′′.39, respectively. The 240 MHz radio image show one component of emission (possibly due larger synthesized beam-size) fitted with a Gaussian of 37′′.6219′′.20. The four point radio spectrum have inverted shape with turnover between 610 MHz and 1.4 GHz.
A.18 NGC 7212
VLA observations of NGC 7212 show a compact double source separated by 0′′.7 in the north-south direction and the northern blob appears to be slightly elongated (Falcke et al. 1998). In our GMRT observations, the 610 MHz image shows two emission component. The radio contours overlaid on DSS optical image clearly show that the second radio component is associated with the neighboring galaxy NGC 7213. The radio emission component associated with NGC 7212 is fitted with a single Gaussian of 8′′.404′′.85. Due to large synthesized beam size ( 40′′.1619′′.61) the 240 MHz radio image shows only one emission component that includes emission from NGC 7213 as well. The 240 MHz radio emission is fitted with a Gaussian of 32′′.8525′′.79. The large beam size at 240 MHz does not allow us to estimate the flux densities of NGC 7212 and NGC 7213 separately. Therefore, 240 MHz flux density measurement of NGC 7212 is contaminated and over-estimated. The four point integrated radio spectral index of NGC 7212 is -0.79. We note that spectral steepening seen over 610 MHz to 240 MHz is likely to be caused by over-estimated 240 MHz flux density. It can also give rise the steeper value of the integrated spectral index than the actual value.
A.19 NGC 7682
8.4 GHz VLA observations of NGC 7682 show an unresolved point source nuclear emission (Kukula et al. 1995), however, the milli-arcsec 5.0 GHz VLBI observations show a point source with extension along the south (P.A. 180∘) and the south-east (P.A. 120∘) direction (Lal et al. 2004). Our GMRT images at 610 MHz and 240 MHz are fitted with single Gaussian components of sizes 10′′.216′′.82 and 38′′.6829′′.23, respectively. The four point spectrum of NGC 7682 is steep with spectral index () -0.72.
A.20 MRK 533
VLA ‘C’ array observations of MRK 533 at 8.4 GHz show a slightly extended nuclear emission which is seen resolved into 0.5 arcsec double structure in VLA ‘A’ array observations (Kukula et al. 1995). VLA and EVN observations reveal a linear triple radio source of 0′′.7 angular extent with the components at 0′′.5 west and 0′′.15 east of the main peak (Unger et al. 1988). Momjian et al. (2003) made more sensitive observations of MRK 533 using VLBA, phased VLA and Arecibo at 1.4 GHz and report the triple source and additional low-surface-brightness emission forming an S-shaped structure. Our GMRT images at 610 MHz and 240 MHz show nearly point source radio emission which are fitted with single Gaussian components of sizes 6′′.986′′.26 and 20′′.0119′′.04, respectively. The radio spectrum of MRK 533 over 240 MHz to 5.0 MHz is fairly steep with spectral index () -0.78.
References
- Antón et al. (2002) Antón, S., Thean, A. H. C., Pedlar, A., & Browne, I. W. A. 2002, MNRAS, 336, 319
- Antonucci (1993) Antonucci, R. 1993, Annual review of Asto & Asphy, 31, 473
- Antonucci (2002) Antonucci, R. 2002, in Astronomical Society of the Pacific Conference Series, Vol. 284, IAU Colloq. 184: AGN Surveys, ed. R. F. Green, E. Y. Khachikian, & D. B. Sanders, 147
- Antonucci & Miller (1985) Antonucci, R. R. J. & Miller, J. S. 1985, ApJ, 297, 621
- Barvainis et al. (1996) Barvainis, R., Lonsdale, C., & Antonucci, R. 1996, AJ, 111, 1431
- Baum et al. (1993) Baum, S. A., O’Dea, C. P., Dallacassa, D., de Bruyn, A. G., & Pedlar, A. 1993, ApJ, 419, 553
- Beckmann et al. (2009) Beckmann, V., Soldi, S., Ricci, C., et al. 2009, A&A, 505, 417
- Booler et al. (1982) Booler, R. V., Pedlar, A., & Davies, R. D. 1982, MNRAS, 199, 229
- Buchanan et al. (2006) Buchanan, C. L., Gallimore, J. F., O’Dea, C. P., et al. 2006, AJ, 132, 401
- Cappi et al. (2006) Cappi, M., Panessa, F., Bassani, L., et al. 2006, A&A, 446, 459
- Colbert et al. (1996) Colbert, E. J. M., Baum, S. A., Gallimore, J. F., O’Dea, C. P., & Christensen, J. A. 1996, ApJ, 467, 551
- Condon et al. (1998) Condon, J. J., Cotton, W. D., Greisen, E. W., et al. 1998, AJ, 115, 1693
- Dadina (2008) Dadina, M. 2008, A&A, 485, 417
- Dahari & De Robertis (1988) Dahari, O. & De Robertis, M. M. 1988, ApJ, 331, 727
- de Bruyn & Wilson (1978) de Bruyn, A. G. & Wilson, A. S. 1978, A&A, 64, 433
- de Vaucouleurs et al. (1991) de Vaucouleurs, G., de Vaucouleurs, A., Corwin, Jr., H. G., et al. 1991, Third Reference Catalogue of Bright Galaxies (Volume 1-3, XII, 2069 pp. 7 figs.. Springer-Verlag Berlin Heidelberg New York)
- Edelson (1987) Edelson, R. A. 1987, ApJ, 313, 651
- Falcke et al. (2000) Falcke, H., Henkel, C., Peck, A. B., et al. 2000, A&A, 358, L17
- Falcke et al. (1998) Falcke, H., Wilson, A. S., & Simpson, C. 1998, ApJ, 502, 199
- Ferruit et al. (2000) Ferruit, P., Wilson, A. S., & Mulchaey, J. 2000, ApJS, 128, 139
- Ferruit et al. (1998) Ferruit, P., Wilson, A. S., & Mulchaey, J. S. 1998, ApJ, 509, 646
- Gallimore et al. (2006) Gallimore, J. F., Axon, D. J., O’Dea, C. P., Baum, S. A., & Pedlar, A. 2006, AJ, 132, 546
- Gallimore et al. (2010) Gallimore, J. F., Yzaguirre, A., Jakoboski, J., et al. 2010, ApJS, 187, 172
- Genzel et al. (1995) Genzel, R., Weitzel, L., Tacconi-Garman, L. E., et al. 1995, ApJ, 444, 129
- Gonzalez Delgado & Perez (1997) Gonzalez Delgado, R. M. & Perez, E. 1997, MNRAS, 284, 931
- Gregory & Condon (1991) Gregory, P. C. & Condon, J. J. 1991, ApJS, 75, 1011
- Griffith et al. (1995) Griffith, M. R., Wright, A. E., Burke, B. F., & Ekers, R. D. 1995, ApJS, 97, 347
- Heckman et al. (2005) Heckman, T. M., Ptak, A., Hornschemeier, A., & Kauffmann, G. 2005, ApJ, 634, 161
- Ho & Ulvestad (2001) Ho, L. C. & Ulvestad, J. S. 2001, ApJS, 133, 77
- Kellermann et al. (1989) Kellermann, K. I., Sramek, R., Schmidt, M., Shaffer, D. B., & Green, R. 1989, AJ, 98, 1195
- Kewley et al. (2006) Kewley, L. J., Groves, B., Kauffmann, G., & Heckman, T. 2006, MNRAS, 372, 961
- Khachikian & Weedman (1974) Khachikian, E. Y. & Weedman, D. W. 1974, ApJ, 192, 581
- Kharb et al. (2006) Kharb, P., O’Dea, C. P., Baum, S. A., Colbert, E. J. M., & Xu, C. 2006, ApJ, 652, 177
- Kinney et al. (2000) Kinney, A. L., Schmitt, H. R., Clarke, C. J., et al. 2000, ApJ, 537, 152
- Kormendy & Gebhardt (2001) Kormendy, J. & Gebhardt, K. 2001, in American Institute of Physics Conference Series, Vol. 586, 20th Texas Symposium on relativistic astrophysics, ed. J. C. Wheeler & H. Martel, 363–381
- Kukula et al. (1998) Kukula, M. J., Dunlop, J. S., Hughes, D. H., & Rawlings, S. 1998, MNRAS, 297, 366
- Kukula et al. (1995) Kukula, M. J., Pedlar, A., Baum, S. A., & O’Dea, C. P. 1995, MNRAS, 276, 1262
- Lal et al. (2004) Lal, D. V., Shastri, P., & Gabuzda, D. C. 2004, A&A, 425, 99
- Lal et al. (2011) Lal, D. V., Shastri, P., & Gabuzda, D. C. 2011, ApJ, 731, 68
- Lonsdale et al. (2003) Lonsdale, C. J., Lonsdale, C. J., Smith, H. E., & Diamond, P. J. 2003, ApJ, 592, 804
- Maiolino et al. (1997) Maiolino, R., Ruiz, M., Rieke, G. H., & Papadopoulos, P. 1997, ApJ, 485, 552
- Malkan et al. (1998) Malkan, M. A., Gorjian, V., & Tam, R. 1998, ApJS, 117, 25
- Mauder et al. (1994) Mauder, W., Weigelt, G., Appenzeller, I., & Wagner, S. J. 1994, A&A, 285, 44
- Mazzuca et al. (2008) Mazzuca, L. M., Knapen, J. H., Veilleux, S., & Regan, M. W. 2008, ApJS, 174, 337
- McConnell & Ma (2013) McConnell, N. J. & Ma, C.-P. 2013, ApJ, 764, 184
- Middelberg et al. (2004) Middelberg, E., Roy, A. L., Nagar, N. M., et al. 2004, A&A, 417, 925
- Miyaji et al. (1992) Miyaji, T., Wilson, A. S., & Perez-Fournon, I. 1992, ApJ, 385, 137
- Momjian et al. (2003) Momjian, E., Romney, J. D., Carilli, C. L., & Troland, T. H. 2003, ApJ, 597, 809
- Moran (2000) Moran, E. C. 2000, New Astronomy Review, 44, 527
- Moran et al. (2000) Moran, E. C., Barth, A. J., Kay, L. E., & Filippenko, A. V. 2000, ApJ, 540, L73
- Morganti et al. (1999) Morganti, R., Tsvetanov, Z. I., Gallimore, J., & Allen, M. G. 1999, A&AS, 137, 457
- Mulchaey et al. (1996) Mulchaey, J. S., Wilson, A. S., & Tsvetanov, Z. 1996, ApJ, 467, 197
- Mundell et al. (2009) Mundell, C. G., Ferruit, P., Nagar, N., & Wilson, A. S. 2009, ApJ, 703, 802
- Mundell et al. (1995) Mundell, C. G., Holloway, A. J., Pedlar, A., et al. 1995, MNRAS, 275, 67
- Mundell et al. (2000) Mundell, C. G., Wilson, A. S., Ulvestad, J. S., & Roy, A. L. 2000, ApJ, 529, 816
- Mundell et al. (2003) Mundell, C. G., Wrobel, J. M., Pedlar, A., & Gallimore, J. F. 2003, ApJ, 583, 192
- Nagar & Wilson (1999) Nagar, N. M. & Wilson, A. S. 1999, ApJ, 516, 97
- Nagar et al. (1999) Nagar, N. M., Wilson, A. S., Mulchaey, J. S., & Gallimore, J. F. 1999, ApJS, 120, 209
- Neff & de Bruyn (1983) Neff, S. G. & de Bruyn, A. G. 1983, A&A, 128, 318
- Nelson & Whittle (1995) Nelson, C. H. & Whittle, M. 1995, ApJS, 99, 67
- Panessa & Bassani (2002) Panessa, F. & Bassani, L. 2002, A&A, 394, 435
- Pedlar et al. (1993) Pedlar, A., Kukula, M. J., Longley, D. P. T., et al. 1993, MNRAS, 263, 471
- Polletta et al. (1996) Polletta, M., Bassani, L., Malaguti, G., Palumbo, G. G. C., & Caroli, E. 1996, ApJS, 106, 399
- Pringle et al. (1999) Pringle, J. E., Antonucci, R. R. J., Clarke, C. J., et al. 1999, ApJ, 526, L9
- Rush et al. (1996) Rush, B., Malkan, M. A., & Edelson, R. A. 1996, ApJ, 473, 130
- Schmidt & Green (1983) Schmidt, M. & Green, R. F. 1983, ApJ, 269, 352
- Schmitt et al. (2001) Schmitt, H. R., Antonucci, R. R. J., Ulvestad, J. S., et al. 2001, ApJ, 555, 663
- Schmitt et al. (2003a) Schmitt, H. R., Donley, J. L., Antonucci, R. R. J., Hutchings, J. B., & Kinney, A. L. 2003a, ApJS, 148, 327
- Schmitt et al. (2003b) Schmitt, H. R., Donley, J. L., Antonucci, R. R. J., et al. 2003b, ApJ, 597, 768
- Schommer et al. (1988) Schommer, R. A., Caldwell, N., Wilson, A. S., et al. 1988, ApJ, 324, 154
- Shastri et al. (2003) Shastri, P., Lal, D. V., & Gabuzda, D. C. 2003, in Astronomical Society of the Pacific Conference Series, Vol. 290, Active Galactic Nuclei: From Central Engine to Host Galaxy, ed. S. Collin, F. Combes, & I. Shlosman, 311
- Singh et al. (2011) Singh, V., Shastri, P., & Risaliti, G. 2011, A&A, 532, A84
- Swarup et al. (1991) Swarup, G., Ananthakrishnan, S., Kapahi, V. K., et al. 1991, CURRENT SCIENCE V.60, NO.2/JAN25, P. 95, 1991, 60, 95
- Thean et al. (2000) Thean, A., Pedlar, A., Kukula, M. J., Baum, S. A., & O’Dea, C. P. 2000, MNRAS, 314, 573
- Thean et al. (2001) Thean, A., Pedlar, A., Kukula, M. J., Baum, S. A., & O’Dea, C. P. 2001, MNRAS, 325, 737
- Tran (2001) Tran, H. D. 2001, ApJ, 554, L19
- Tran (2003) Tran, H. D. 2003, ApJ, 583, 632
- Ulvestad & Ho (2001) Ulvestad, J. S. & Ho, L. C. 2001, ApJ, 558, 561
- Ulvestad & Wilson (1984a) Ulvestad, J. S. & Wilson, A. S. 1984a, ApJ, 278, 544
- Ulvestad & Wilson (1984b) Ulvestad, J. S. & Wilson, A. S. 1984b, ApJ, 285, 439
- Ulvestad & Wilson (1989) Ulvestad, J. S. & Wilson, A. S. 1989, ApJ, 343, 659
- Ulvestad et al. (1981) Ulvestad, J. S., Wilson, A. S., & Sramek, R. A. 1981, ApJ, 247, 419
- Ulvestad et al. (2005) Ulvestad, J. S., Wong, D. S., Taylor, G. B., Gallimore, J. F., & Mundell, C. G. 2005, AJ, 130, 936
- Ulvestad et al. (1999) Ulvestad, J. S., Wrobel, J. M., Roy, A. L., et al. 1999, ApJ, 517, L81
- Unger et al. (1988) Unger, S. W., Pedlar, A., Axon, D. J., et al. 1988, MNRAS, 234, 745
- Urry et al. (1995) Urry, K., Padovanni, G., Wilson, A. S., & Yoshida, M. 1995, ApJ, 521, 565
- Wang et al. (2009) Wang, J., Mao, Y. F., & Wei, J. Y. 2009, AJ, 137, 3388
- Weedman (1977) Weedman, D. W. 1977, ARA&A, 15, 69
- White & Becker (1992) White, R. L. & Becker, R. H. 1992, ApJS, 79, 331
- Whittle (1992) Whittle, M. 1992, ApJS, 79, 49
- Wilson et al. (1991) Wilson, A. S., Helfer, T. T., Haniff, C. A., & Ward, M. J. 1991, ApJ, 381, 79
- Wilson & Tsvetanov (1994) Wilson, A. S. & Tsvetanov, Z. I. 1994, AJ, 107, 1227
- Wilson & Ulvestad (1982a) Wilson, A. S. & Ulvestad, J. S. 1982a, ApJ, 260, 56
- Wilson & Ulvestad (1982b) Wilson, A. S. & Ulvestad, J. S. 1982b, ApJ, 263, 576
- Wrobel (2000) Wrobel, J. M. 2000, ApJ, 531, 716