The local radio-galaxy population at 20 GHz
Abstract
We have made the first detailed study of the high-frequency radio-source population in the local universe, using a sample of 202 radio sources from the Australia Telescope 20 GHz (AT20G) survey identified with galaxies from the 6dF Galaxy Survey (6dFGS). The AT20G-6dFGS galaxies have a median redshift of z=0.058 and span a wide range in radio luminosity, allowing us to make the first measurement of the local radio luminosity function at 20 GHz.
Our sample includes some classical FR-1 and FR-2 radio galaxies, but most of the AT20G-6dFGS galaxies host compact (FR-0) radio AGN which appear lack extended radio emission even at lower frequencies. Most of these FR-0 sources show no evidence for relativistic beaming, and the FR-0 class appears to be a mixed population which includes young Compact Steep-Spectrum (CSS) and Gigahertz-Peaked Spectrum (GPS) radio galaxies.
We see a strong dichotomy in the Wide-field Infrared Survey Explorer (WISE) mid-infrared colours of the host galaxies of FR-1 and FR-2 radio sources, with the FR-1 systems found almost exclusively in WISE ‘early-type’ galaxies and the FR-2 radio sources in WISE ‘late-type’ galaxies.
The host galaxies of the flat- and steep-spectrum radio sources have
a similar distribution in both K–band luminosity and WISE colours,
though galaxies with flat-spectrum sources are more likely to show
weak emission lines in their optical spectra. We conclude that these
flat-spectrum and steep-spectrum radio sources mainly represent different
stages in radio-galaxy evolution, rather than beamed and unbeamed radio-source
populations.
keywords:
radio continuum: general – catalogues – surveys – galaxies: active1 Introduction
Measurements of the radio-source population in the local universe provide an essential benchmark for studying the co-evolution of galaxies and their central black holes over cosmic time. The local radio-source population has now been mapped out in detail at 1.4 GHz through the combination of large-area radio continuum and optical redshift surveys (Condon et al. 2002; Sadler et al. 2002; Best et al. 2005a; Mauch & Sadler 2007; see also De Zotti et al. 2010 for a recent review), and the radio luminosity functions of both star-forming galaxies and active galactic nuclei (AGN) have been accurately measured. Members of the two classes overlap in radio luminosity, but can usually be distinguished using optical spectra (Sadler et al. 1999; Best et al. 2005b).
Much less is known about the local radio-source population at other frequencies, and the recent completion of a sensitive, large-area radio continuum survey at 20 GHz, the AT20G survey (Murphy et al. 2010) provides a first opportunity to study the high-frequency radio properties of nearby galaxies in a systematic way.
The radio emission from active galaxies at 20 GHz arises mainly from the galaxy core, rather than from extended radio lobes (e.g Sadler et al. 2006, De Zotti et al. 2010, Massardi et al. 2011a, Mahony et al. 2011). The AT20G survey therefore allows us to identify some of the youngest radio galaxies in the local universe, with radio spectra peaking above 5 GHz, which can provide new insights into the earliest stages of radio-galaxy evolution (Snellen et al. 2000; Hancock et al. 2009).
Our aim in this paper is to map out the overall properties of the local radio-source population at 20 GHz, compare this with earlier studies of local radio sources selected at 1.4 GHz (Best et al. 2005a; Mauch & Sadler 2007; Best & Heckman 2012) and use the radio spectral-index information available from the AT20G sample to test whether the host galaxies of flat-spectrum and steep-spectrum radio sources are drawn from the same population.
Section 2 describes the construction of the first 20 GHz-selected sample of nearby galaxies, and provides a data table for the 202 southern (dec 0∘) galaxies in this sample. The radio properties of the sample are discussed in §3, and the local radio luminosity function at 20 GHz derived in §4. §5 discusses the optical and infrared properties of our galaxy sample. §6 compares the local radio-source population at 20 GHz with that seen in earlier studies at 1.4 GHz, and §7 presents our conclusions and some suggestions for further work. Some notes on individual sources are added in Appendix A.
Throughout this paper, we assume H0 = 71 km s-1 Mpc-1, = 0.27 and = 0.73.
2 The AT20G–6dFGS galaxy sample
We assembled the galaxy sample studied in this paper by matching radio sources from the Australia Telescope 20 GHz Survey catalogue (AT20G; Murphy et al. 2010) with nearby galaxies from the Third Data Release of the 6dF Galaxy Survey (6dFGS DR3; Jones et al. 2009). The 6dFGS was chosen because it is a large-area survey well-matched to the area covered by AT20G, and shallow enough in redshift that the effects of cosmic evolution within the sample volume can be neglected.
In assembling the AT20G-6dFGS sample we used a similar methodology to that of Mauch & Sadler (2007), who assembled and studied a sample of several thousand nearby radio sources selected at 1.4 GHz from the 6dFGS DR2 (Jones et al. 2004) and NVSS (Condon et al. 1998) catalogues. By doing this, we can make direct comparisons between two galaxy samples selected from the same optical survey but at very different radio frequencies.
The AT20G source catalogue covers the whole southern sky111As noted by Massardi et al. (2011a), the AT20G catalogue has low completeness in a strip of sky at 16–18 hours RA at declination north of because of bad weather during the final observing run. The 6dFGS also has a small number of fields which could not be observed during the survey, mainly in the RA range 6–12 hours with declination south of . Diagrams showing the survey completeness as a function of position on the sky can be found in Figure 1 of Massardi et al. (2011a) for AT20G and Figure 1(c) of Jones et al. (2009) for 6dFGS. (declination and Galactic latitude ) and includes 5890 sources above a 20 GHz flux density limit of 40 mJy. The 6dFGS catalogue contains infrared JHK photometry and optical redshifts for a sample of about 125,000 southern (declination and Galactic latitude ) galaxies brighter than K = 12.75 mag. The median redshift of the 6dFGS galaxies is .
2.1 Source selection
We matched the AT20G catalogue (Murphy et al. 2010) against the 6dFGS DR3 spectroscopic catalogue for galaxies in the main K-band sample (progID=1 in the 6dFGS catalogue), taking into account the following points:
-
1.
Most AT20G sources are unresolved on scales of 10-15 arcsec, and are associated with the radio cores of galaxies and QSOs (Sadler et al. 2006). For these objects, making an optical identification is generally straightforward.
-
2.
Around 5-6% of AT20G sources show extended structure within the 2.4 arcmin ATCA primary beam at 20 GHz, and are flagged as extended in the catalogue (Murphy et al. 2010). The AT20G catalogue position for these sources corresponds to the peak flux in the image. This is usually the flat-spectrum core, and for these sources the optical identification will again be straightforward. In a small number of the strongest peak is a hotspot in the lobes or jet, rather than the core, and extra effort is needed to make the correct optical identification.
-
3.
Previous work on the AT20G sources generally used a 2.5 arcsec cutoff radius in making optical identifications (e.g. Sadler et al. 2006; Massardi et al. 2008). While this is appropriate for the AT20G sample as a whole (where distant QSOs are the dominant source population), a larger matching radius should be used for the 6dFGS galaxies because of their large angular size and the relatively low surface density of these bright galaxies.
We began by setting a cutoff radius of 60 arcsec for candidate AT20G/6dFGS matches. This produced a total of 425 candidates, 218 of which were galaxies in the main 6dFGS sample (progID=1) with the remainder belonging to one of the “additional target” samples carried out in parallel with the 6dFGS (Jones et al. 2009). These additional target objects (which include samples of QSOs, radio and infrared-selected AGN as well as other galaxies which are fainter than the K=12.75 mag cutoff) are not discussed here, but are analysed in a separate paper (Mahony et al. 2011).
We then visually inspected all the candidate matches, looking at the 20 GHz AT20G images, optical overlay plots and (lower-resolution) low-frequency radio images from the 843 MHz SUMSS and 1.4 GHz NVSS images (Bock et al. 1999; Condon et al. 1998). We also cross-matched the full AT20G catalogue with the lower-frequency southern 2Jy (Morganti et al. 1993) and MS4 (Burgess & Hunstead 2006) bright radio-source samples to check whether any AT20G sources were identified with hotspots of nearby radio galaxies with very large angular sizes (which would have been missed by our 1 arcmin cutoff radius).
| Source | comp | AT20G name | AT20G position | S20 | m20 | Notes | |||
| (J2000) | arcsec | (mJy) | % | ||||||
| (a) Galaxies associated with two or more catalogued AT20G sources | |||||||||
| PKS 0043-42 | 1 | J004613-420700 | 00 46 13.32 | -42 07 00.1 | 71 | 363 | 15 | 7.4 | Hotspot |
| 2 | J004622-420842 | 00 46 22.30 | -42 08 42.6 | 72 | 139 | 14 | 17.9 | Hotspot | |
| Pictor A | 1 | J051926-454554 | 05 19 26.34 | -45 45 54.5 | 245 | 1464 | 55 | 38.0 | Hotspot |
| 2 | J051949-454643 | 05 19 49.70 | -45 46 43.7 | 0 | 1107 | 54 | 1.0 | Core | |
| 3 | J052006-454745 | 05 20 06.47 | -45 47 45.4 | 186 | 426 | 10 | 8.6 | Hotspot | |
| PKS 0634-20 | 1 | J063631-202857 | 06 36 31.24 | -20 28 57.6 | 356 | 55 | 3 | 14.7 | Hotspot |
| 2 | J063633-204239 | 06 36 33.00 | -20 42 39.3 | 466 | 183 | 6 | 12.1 | Hotspot | |
| PKS 1717-00 | 1 | J172019-005851 | 17 20 19.74 | -00 58 51.2 | 126 | 313 | 7 | 11.0 | Hotspot |
| 2 | J172034-005824 | 17 20 34.24 | -00 58 24.6 | 94 | 122 | 6 | 8.1 | Hotspot | |
| PKS 1733-56 | 1 | J173722-563630 | 17 37 22.24 | -56 36 30.0 | 185 | 208 | 8 | 9.2 | Hotspot |
| 2 | J173742-563246 | 17 37 42.95 | -56 32 46.4 | 97 | 488 | 19 | 5.9 | Hotspot | |
| (b) Galaxies associated with a single catalogued AT20G source which is offset by more than 10 arcsec from the nucleus | |||||||||
| PKS 0000-550 | J000311-544516 | 00 03 11.04 | -54 45 16.8 | 19 | 95 | 3 | 17.0 | Resolved double | |
| PKS 0349-27 | J035145-274311 | 03 51 45.09 | -27 43 11.4 | 149 | 122 | 8 | 24.8 | Hotspot | |
| PKS 0625-53 | J062620-534151 | 06 26 20.58 | -53 41 51.4 | 16 | 253 | 4 | 7.8 | Resolved double | |
| PKS 0625-545 | J062648-543214 | 06 26 48.91 | -54 32 14.0 | 21 | 106 | 3 | 12.9 | Resolved triple | |
| PKS 0651-60 | J065153-602158 | 06 51 53.67 | -60 21 58.4 | 21 | 44 | 2 | 23.0 | Resolved double | |
| PKS 0806-10 | J080852-102831 | 08 08 52.49 | -10 28 31.9 | 55 | 131 | 5 | 7.9 | Hotspot | |
| Hydra A | J091805-120532 | 09 18 05.82 | -12 05 32.5 | 12 | 1056 | 52 | 13.6 | Resolved double | |
| MRC 0938-118 | J094110-120450 | 09 41 10.74 | -12 04 50.6 | 47 | 44 | 2 | 18.6 | Resolved triple | |
| PKS 1251-12 | J125438-123255 | 12 54 38.55 | -12 32 55.7 | 68 | 83 | 2 | 23.4 | Resolved double | |
| PKS 1801-702 | J180712-701234 | 18 07 12.55 | -70 12 34.5 | 12 | 62 | 3 | 13.5 | Resolved double | |
| PKS 1954-55 | J195817-550923 | 19 58 17.08 | -55 09 23.3 | 14 | 581 | 12 | 43.5 | Resolved double | |
| PKS 2053-20 | J205603-195646 | 20 56 03.52 | -19 56 46.8 | 16 | 159 | 3 | 14.4 | Resolved double | |
| PKS 2135-147 | J213741-143241 | 21 37 41.17 | -14 32 41.9 | 60 | 256 | 7 | 4.5 | Hotspot | |
| PKS 2158-380 | J220113-374654 | 22 01 13.79 | -37 46 54.3 | 50 | 174 | 5 | 18.3 | Hotspot | |
In most cases there was good agreement between the AT20G and 6dFGS positions. About 20% of the candidate matches showed extended or double structure in the AT20G image, and in a few cases there was more than one catalogued AT20G source near the same 6dFGS galaxy, suggesting that the AT20G catalogue may be listing several discrete components of a single radio source (see §2.2).
Our next step was to accept as genuine IDs the 183 candidate matches with a position difference of less than 10 arcsec. Monte Carlo tests imply that all matches out to this radius are likely to be genuine, with less than one match expected to occur by chance. Of these 183 sources, 24 (13%) were flagged as extended in the AT20G catalogue and the remainder were unresolved on scales of 10-15 arcsec at 20 GHz.
2.2 Sources with large radio-optical offsets
On the basis of our visual inspection (and cross-comparison with low-frequency radio images where necessary), we accepted a further 19 galaxies with AT20G-6dFGS position offsets arcsec as genuine IDs. These are listed in Table 1.
All but one of the 19 galaxies in Table 1 are associated with sources flagged as extended in the AT20G catalogue (the exception is J031545-274311, which is an unresolved hotspot in one lobe of the radio galaxy PKS 0349-27). Five of the 6dFGS galaxies in Table 1 are associated with two or more sources which are listed separately in the AT20G catalogue.
Most of the objects in Table 1 (11/19) are nearby FR-2 radio galaxies, where the catalogued AT20G source corresponds to one of the hotspots and so is offset from the optical position of the host galaxy. The remaining sources have extended radio emission in which the brightest region at 20 GHz is slightly offset from the galaxy nucleus. Adding the 19 galaxies from Table 1 to the 183 galaxies identified the matching process described in §2.1 gives a total of 202 galaxies in our final AT20G-6dFGS sample.
2.3 Optical spectroscopy and spectral classification
Of the 202 galaxies in our final sample, 139 have a good-quality 6dFGS optical spectrum. The remaining 62 galaxies were not observed in the 6dFGS survey because a published redshift was already available in the literature and so they were given lower priority when scheduling optical spectroscopy for the 6dFGS.
For each galaxy where a 6dFGS spectrum was available, we visually classified the optical spectrum in the same way as Mauch & Sadler (2007) to determine the dominant physical process responsible for the radio emission.
Each object is first classified as either a star-forming galaxy (if the spectrum shows emission lines with ratios characteristic of star-formation regions) or an active galactic nucleus (AGN) if no evidence of star formation is seen. The AGN class is then further sub-classified into objects which have strong, weak or no emission lines in their spectra. Table 2 lists the different classifications used and the number of objects in each class.
| Class | Type of spectrum | 6dF | 6dF |
|---|---|---|---|
| only | +2Jy | ||
| Aa | AGN, pure absorption-line spectrum | 67 | 72 |
| Aae | AGN, weak narrow emission lines | 40 | 51 |
| Ae | AGN, strong narrow emission lines | 25 | 27 |
| AeB | AGN, strong emission with broad Balmer lines | 7 | 9 |
| SF | HII region-like emission spectrum | 0 | 1 |
| .. | No spectral class, redshift from literature | 63 | 42 |
| Total | 202 | 202 |
As noted by Mauch & Sadler (2007), the 6dFGS spectra are obtained through 6 arcsec fibres which correspond to a projected diameter of about 6.8 kpc at the median redshift of the survey (). As a result, the 6dF fibres include an increasing fraction of the total galaxy light for higher-redshift galaxies and so galaxies with weak emission lines in their nuclei may be harder to recognize at higher redshift.
Less information is available for the 63 galaxies without 6dFGS spectra, but 21 of these galaxies are members of the 2 Jy radio galaxy sample (Morganti et al. 1993) for which optical spectra at 3500–5500 Å have been published by Tadhunter et al. (1993; see their Figure 1) along with detailed notes on the spectral features. For these 21 objects, we made a spectral classification using the Tadhunter et al. (1993) spectra. These spectral classifications are marked with quality flag ‘J’ in Table 3. For objects with spectra from both 6dFGS and Tadhunter et al. (1993), the two classifications agree well. For the remaining objects where no 6dFGS spectrum was available, no spectral classification was generally made. In these cases, the catalogued 6dFGS redshift is included in Table 3 (see below) but the quality flag and spectral class are left blank.
2.4 Origin of the radio emission
As can be seen from Table 2, 159 of the 160 20 GHz-selected galaxies with good-quality optical spectra are classified as AGN and only one (NGC 253) as a star-forming galaxy.
This is quite different from the 1.4 GHz-selected NVSS-6dFGS sample (Mauch & Sadler 2007), which contains roughly 60% star-forming galaxies and 40% AGN. The difference is not simply due to the higher flux limit of the AT20G sample (40 mJy, compared to 2.4 mJy for NVSS), since at least 15% of the Mauch & Sadler (2007) sources stronger than 40 mJy at 1.4 GHz are star-forming galaxies, but also reflects differences in the radio spectral index distribution of AGN and star-forming galaxies over the frequency range 1–20 GHz.
Murphy et al. (2010) note that the AT20G survey is insensitive to extended 20 GHz emission on angular scales larger than about 45 arcsec, making it difficult to detect diffuse synchrotron emission from the disks of nearby spiral galaxies. In practice, however, the relatively low radio luminosity and steeply-falling radio spectrum of the disk emission from ‘normal’ galaxies means that we would expect to detect very few such objects above the 40 mJy AT20G survey limit even if the brightness sensitivity was not an issue.
NGC 253, the lowest-redshift galaxy in our sample, is the only galaxy in which the 20 GHz radio emission appears to arises from a central starburst rather than an AGN. The main supporting evidence for this is the lack of a parsec-scale central radio source with the high brightness temperature characteristic of AGN cores (Sadler et al. 1995; Lenc & Tingay 2006). NGC 253 is also one of only two starburst galaxies so far detected as high-energy gamma-ray sources by the Fermi satellite (Abdo et al. 2010).
2.5 The main data table
Table 3 lists radio and optical measurements for the 202 galaxies in the final AT20G-6dFGS sample. Galaxies with unresolved 20 GHz sources are listed first, followed by galaxies where the 20 GHz radio source is flagged as extended in the AT20G catalogue and/or has multiple components.
The column headings are as follows:
-
(1)
Source name from the AT20G catalogue. For galaxies which are identified with two or more AT20G sources (see Table 1), we list a commonly-used source name instead.
-
(2)
The 20 GHz radio position (J2000) as catalogued by Murphy et al (2010).
-
(3,4)
The catalogued 20 GHz flux density, and its error (Murphy et al. 2010). For sources with multiple AT20G components, we list the sum of the component flux densities.
-
(5,6)
Where available, the catalogued 8.4 GHz flux density and its error (Murphy et al. 2010).
-
(7,8)
Where available, the catalogued 5 GHz flux density and its error (Murphy et al. 2010).
-
(9)
For sources north of declination , the total 1.4 GHz flux density measured from the NVSS catalogue (Condon et al. 1998). For sources with more than one NVSS component the listed flux is the sum of the components, as described by Mauch & Sadler (2007).
-
(10)
For sources south of declination , the total 843 MHz flux density measured from the SUMSS catalogue (Mauch et al. 2003). For sources with more than one SUMSS component the listed flux is the sum of the components.
-
(11)
6dFGS name.
-
(12)
Offset between the AT20G and 6dFGS positions, in arcsec.
-
(13)
Total infrared K-band magnitude Ktot from the 2MASS extended source catalogue (Jarrett et al. 2000), as listed in the 6dFGS database.
-
(14)
Optical redshift, as listed in the 6dFGS catalogue (Jones et al. 2009).
-
(15)
6dFGS redshift quality, q, where q=4 represents a reliable redshift and q=3 a probable redshift (Jones et al. 2004).
-
(16)
Spectral classification for galaxies with a good-quality 6dFGS spectrum. Aa = absorption-line spectrum, Aae = absorption lines plus weak emission lines, Ae = strong emission lines (see Sadler et al. 1999, 2002).
-
(17)
Notes on individual sources.
The final AT20G-6dFGS sample contains 202 galaxies, 42 of which are flagged in the AT20G catalogue as extended radio sources at 20 GHz.

3 Radio properties of the AT20G–6dFGS sample
We now consider the radio morphology and spectral-index distribution of the AT20G-6dFGS galaxies.
The available radio data allow us to probe a range of size scales, as summarized in Figure 1. At frequencies near 1 GHz, the NVSS and SUMSS images can resolve extended radio structure on scales larger than about 30 arcsec. In the redshift range covered by our sample, this corresponds to radio emission on scales of tens to hundreds of kpc, typical of classical FR-1 and FR-2 radio galaxies (Fanaroff & Riley 1974). Around 25% of the galaxies in Table 3 have extended low-frequency radio emission in the NVSS/SUMSS images, as discussed below in §3.1.
At high frequency, the AT20G snapshot images have an angular resolution of 10–15 arcsec (Murphy et al. 2010), corresponding to a projected linear size of 10–15 kpc for galaxies at (the median redshift of galaxies in our sample). In most cases, therefore, a source which is unresolved in the 20 GHz images is confined within its host galaxy. This size scale is characteristic of Compact Steep Spectrum (CSS) radio sources, which are usually smaller than 15 kpc in extent (Fanti et al. 1990).
Measurements of the visibilities on the longest (6 km) ATCA baselines at 20 GHz allow us to identify sources which are smaller than 0.2 arcsec in size (Massardi et al. 2011a; Chhetri et al. 2012) and so confined to the central kiloparsec of their host galaxy. This size scale is characteristic of Gigahertz Peaked Spectrum (GPS) galaxies, which are generally smaller than a few hundred parsecs in size (Stanghellini et al. 1997). The high-frequency radio structure of the AT20G-6dFGS galaxies is discussed further in §3.2.
Finally, we note that the 6dFGS spectra are taken with 6-arcsec diameter optical fibres (Jones et al. 2009), and so sample a large fraction of the galaxy light for all but the closest AT20G-6dFGS objects. In particular, optical emission lines seen in the 6dFGS spectra could arise either from the nucleus or from ionized gas distributed more widely within the galaxy.
3.1 Radio morphology at frequencies near 1 GHz
All the galaxies in AT20G-6dFGS sample have low-frequency radio images available from the NVSS (1.4 GHz) or SUMSS (843 MHz) surveys. NVSS and SUMSS are well-matched in sensitivity, and both surveys have similar angular resolution of around 45 arcsec (i.e. about a factor of three lower than the AT20G 20 GHz images). NVSS covers the sky north of declination , and SUMSS the region south of declination , so there is a 10-degree band at declination where images are available form both these surveys. The main motivation for studying these low-frequency images was to link the high-frequency core properties of nearby radio galaxies to the FR-1 and FR-2 classifications traditionally used in lower-frequency studies (Fanaroff & Riley 1974).
Of the 201 radio galaxies in our sample222Excluding the star-forming galaxy NGC 253, 65 (32%) have extended radio emission (on scales larger than about 30 arcsec) in the 1.4 GHz NVSS or 843 MHz SUMSS images. These 65 galaxies are listed in Table 3 along with a classification as either FR-1 or FR-2. For 36 of the 65 objects we used existing FR classifications from the literature, mainly from the southern 2-Jy sample (Morganti, Killeen & Tadhunter 1993) and the Molonglo Southern 4-Jy sample (Burgess & Hunstead 2006). The other 29 extended sources had no published FR classification, and were classified by the authors as either FR-1 or FR-2 using the NVSS and SUMSS images. The final column of Table 3 indicates whether the galaxy is known to be a member of an Abell cluster, and in some cases gives additional information about the low-frequency radio structure.
We classify the remaining 136 galaxies in our sample, for which the 1 GHz emission is unresolved in the NVSS and SUMSS images as ‘FR-0’ radio galaxies. The FR-0 classification was introduced by Ghisellini et al. (2011) as the name of a class of weak, compact radio sources described by Baldi & Capetti (2009) but dating back to Slee et al. (1994) and possibly even earlier. In this paper, we adopt the FR-0 designation as a convenient way of linking the compact radio sources seen in nearby galaxies into the canonical Fanaroff-Riley classification scheme.
Our final set of low-frequency classifications contains 49 FR-1, 16 FR-2 and 136 FR-0 radio galaxies. Thus only about one-third of the nearby radio AGN in our 20 GHz-selected sample are classical FR-1/FR-2 radio galaxies at frequencies near 1 GHz.
| Source | AT20G | 2 Jy | MS4 | Spec. | S20 | S0.4 | FR | Ref. | Notes | |
|---|---|---|---|---|---|---|---|---|---|---|
| name | name | name | class | (Jy) | (Jy) | class | ||||
| PKS 0001-531 | J000413-525458 | … | … | 0.0328 | .. | 0.065 | 1.25 | 1 | v | |
| 3C 015 | J003704-010907 | 0034-01 | … | 0.0734 | Aa | 0.404 | 9.74 | 2 | a | |
| PKS 0043-42 | (Two sources) | 0043-42 | B0043-424 | 0.1160 | Aae | 0.438 | 21.0 | 2 | a, b | |
| 3C 029 | J005734-012328 | 0055-01 | … | 0.0450 | Aa | 0.055 | 10.88 | 1 | a | |
| NGC 547 | J012600-012041 | 0123-01 | … | 0.0184 | Aa | 0.147 | 16.4 | 1 | a | In cluster Abell 194 |
| NGC 612 | J013357-362935 | 0131-36 | B0131-367 | 0.0305 | Ae | 0.440 | 17.1 | 2 | a,b | |
| ESO 198-G01 | J021645-474908 | … | B0214-480 | 0.0643 | Aa | 0.093 | 9.5 | 1 | b | In cluster Abell 239S |
| PKS 0229-208 | J023137-204021 | … | … | 0.0898 | Aa | 0.160 | 1.87 | 1 | v | |
| PMN J0315-1906 | J031552-190644 | … | … | 0.0671 | Ae? | 0.108 | .. | 1 | c | In cluster Abell 428 |
| PKS 0344-34 | J034630-342246 | … | B0344-345 | 0.0535 | .. | 0.102 | 9.3 | 2 | b | Complex source, in cluster |
| PKS 0349-27 | J035145-274311 | 0349-27 | … | 0.0657 | Ae | (0.122) | 8.75 | 2 | a | Lower limit at 20 GHz |
| IC 2082 | J042908-534940 | 0427-53 | B0427-539 | 0.0380 | Aa | 0.145 | 14.6 | 1 | a,b | In cluster Abell 463S |
| PKS 0429-61 | J043022-613201 | … | B0429-616 | 0.0555 | Aa | 0.148 | 6.5 | 1 | b | In cluster Abell 3266 |
| Pictor A | (Three sources) | 0518-45 | B0518-458 | 0.0351 | AeB | 6.320 | 166.0 | 2 | a, b | |
| PKS 0545-199 | J054754-195805 | … | … | 0.0551 | Aa | 0.042 | 1.81 | 1 | d | |
| PKS 0620-52 | J062143-524132 | 0620-52 | B0620-52 | 0.0511 | Aae | 0.266 | 9.3 | 1 | a, b | |
| ESO 161-IG07 | J062620-534151 | 0625-53 | B0625-536 | 0.0551 | Aa | 0.253 | 26.0 | 1 | a, b | In cluster Abell 3391 |
| PKS 0625-545 | J062648-543214 | … | B0625-545 | 0.0517 | .. | 0.106 | 7.86 | 1 | b | In cluster Abell 3395 |
| PKS 0625-35 | J062706-352916 | 0625-35 | B0625-354 | 0.0549 | Aa | 0.688 | 9.23 | 1 | a, b | In cluster Abell 3392 |
| PKS 0634-20 | (Two sources) | .. | .. | 0.0551 | Ae | 0.238 | 210.0 | 2 | e | |
| PKS 0651-60 | J065153-602158 | … | … | 0.1339 | Aa | 0.044 | 3.06 | 1 | v | |
| PKS 0652-417 | J065359-415144 | … | … | 0.0908 | Aa | 0.056 | 1.02 | 1 | v | |
| ESO 207-G19 | J070459-490459 | … | … | 0.0419 | .. | 0.084 | .. | 1 | v | In cluster Abell 3407 |
| PKS 0707-35 | J070914-360121 | … | B0707-35 | 0.1108 | .. | 0.094 | 4.60 | 2 | b | |
| PKS 0803-00 | J080537-005819 | … | … | 0.0902 | Aa | 0.081 | 3.39 | 1 | v | Wide-angle tail, in cluster Abell 623 |
| PKS 0806-10 | J080852-102832 | 0806-10 | … | 0.1090 | Ae | 0.131 | 10.2 | 2 | a | |
| ESO 060-IG02 | J081611-703944 | … | … | 0.0332 | Aa | 0.062 | 2.56 | 1 | v | Complex source |
| PMN J0844-1001 | J084452-100059 | … | … | 0.0429 | Aa | 0.046 | .. | 1 | v | |
| PMN J0908-1000 | J090802-095937 | … | … | 0.0535 | Aa | 0.060 | .. | 1 | v | Narrow-angle tail |
| PMN J0908-0933 | J090825-093332 | … | … | 0.1590 | Aa | 0.046 | .. | 1 | v | In cluster Abell 0754 |
| Hydra A | J091805-120532 | 0915-11 | … | 0.0548 | Aae | 1.056 | 132.0 | 1 | a | In cluster Abell 780 |
| PMN J0941-1205 | J094110-120450 | … | … | 0.1500 | Aa | 0.044 | 1.77 | 2 | v | Compact triple |
| NGC 3557 | J110957-373220 | … | … | 0.0101 | Aa | 0.052 | 0.96 | 1 | f | |
| PKS 1118+000 | J112119-001316 | … | … | 0.0993 | .. | 0.108 | 1.50 | 1 | v | Wide-angle tail |
| PKS 1130-037 | J113305-040046 | … | … | 0.0520 | Aa | 0.108 | 1.18 | 1 | v | In cluster Abell 1308 |
| NGC 4783 | J125438-123255 | 1251-12 | … | 0.0150 | Aae | 0.083 | 14.7 | 1 | a | |
| ESO 443-G24 | J130100-322628 | … | … | 0.0170 | .. | 0.176 | 2.99 | 1 | g | In cluster Abell 3537 |
| PKS 1308-441 | J131124-442240 | … | … | 0.0506 | Aae | 0.044 | 1.07 | 1 | v | Giant radio galaxy |
| NGC 5090 | J132112-434216 | 1318-43 | B1318-434 | 0.0112 | Aae | 0.705 | 10.0 | 1 | a, b | |
| NGC 5128 | J132527-430104 | 1322-42 | B1322-427 | 0.0018 | Aae | 28.35 | 2740. | 1 | a, b | |
| IC 4296 | J133639-335756 | 1333-33 | B1333-33 | 0.0125 | Aae | 0.323 | 30.8 | 1 | a, b | In cluster Abell 3565 |
| ESO 325-G16 | J134624-375816 | … | … | 0.0376 | Aa | 0.071 | 1.44 | 1 | v | Complex structure, in cluster Abell 3570 |
| PKS 1452-367 | J145509-365508 | … | … | 0.0946 | Aae | 0.198 | 2.90 | 1 | v | |
| PKS 1637-77 | J164416-771548 | 1637-77 | B1637-771 | 0.0430 | Aae | 0.399 | 13.5 | 2 | a, b | |
| PKS 1717-00 | (Two sources) | 1717-00 | … | 0.0304 | Aae | 0.435 | 61.28 | 2 | a | |
| PKS 1733-56 | (Two sources) | 1733-56 | B1733-565 | 0.0985 | Ae | 0.696 | 20.3 | 2 | a, b | |
| MRC 1758-473 | J180207-471930 | … | … | 0.1227 | Aa | 0.114 | 1.06 | 1 | v | |
| PMN J1818-5508 | J181857-550815 | … | … | 0.0726 | Aa | 0.075 | .. | 1 | v | |
| PKS 1839-48 | J184314-483622 | 1839-48 | B1839-487 | 0.1108 | Aa | 0.305 | 9.08 | 1 | a, b | |
| PMN J1914-2552 | J191457-255202 | … | … | 0.0631 | Aa | 0.147 | 1.06 | 1 | v | Head-tail source |
| MRC 1925-296 | J192817-293145 | … | … | 0.0244 | Aa | 0.078 | 3.18 | 1 | v | Wide-angle tail, in cluster? |
| PKS 1954-55 | J195817-550923 | 1954-55 | B1954-552 | 0.0581 | Aae | 0.581 | 14.8 | 1 | a, b | |
| ESO 234-G68 | J204552-510627 | … | … | 0.0485 | Aa | 0.054 | 0.96 | 1 | v | |
| IC 1335 | J205306-162007 | … | … | 0.0427 | Aa | 0.056 | .. | 1 | v | |
| ESO 106-IG15 | J205754-662919 | … | … | 0.0754 | Aa | 0.049 | .. | 1 | v | In cluster Abell 2597? |
| PMN J2122-5600 | J212222-560014 | … | … | 0.0518 | Aae | 0.058 | .. | 1 | v | Head-tail source? |
| NGC 7075 | J213133-383703 | … | … | 0.0182 | Aa | 0.046 | 1.79 | 1 | v | |
| PKS 2135-147 | J213741-143241 | 2135-14 | B2135-147 | 0.1999 | AeB | 0.256 | 8.78 | 2 | a, b | |
| PMN J2148-5714 | J214824-571351 | … | … | 0.0806 | .. | 0.048 | 1.67 | 1 | v | Head-tail source, in cluster? |
| PKS 2148-555 | J215129-552013 | … | B2148-555 | 0.0388 | .. | 0.088 | .. | 1 | b | In cluster Abell 3816 |
| ESO 075-G041 | J215706-694123 | 2152-69 | B2152-699 | 0.0285 | AeB | 3.400 | 61.6 | 2 | a, b | |
| PKS 2158-30 | J220113-374654 | … | B2158-380 | 0.0334 | Ae | 0.174 | 4.12 | 2 | b | |
| PKS 2316-423 | J231905-420648 | … | … | 0.0543 | Aae | 0.150 | .. | 1 | v | Complex structure, in cluster Abell 1111S |
| PKS 2316-538 | J231915-533159 | … | … | 0.0958 | Aa | 0.075 | .. | 1 | v | |
| PKS 2339-164 | J234205-160840 | … | … | 0.0649 | Aa | 0.043 | 0.95 | 1 | v | Complex structure, in cluster? |
3.2 Radio morphology at 20 GHz
The AT20G data provide a range of information on the radio morphology at 20 GHz, as discussed by Murphy et al. (2010) and Massardi et al. (2011a). The angular resolution of the 20 GHz AT20G snapshot images made with the ATCA is typically arcsec (Murphy et al. 2010), corresponding to a linear size of kpc at the median redshift () of the AT20G-6dFGS galaxies. The 20 GHz snapshot images therefore provide information on the high-frequency radio morphology of the AT20G-6dFGS galaxies on kiloparsec scales.
We can recover some extra information on the smaller-scale structure of most AT20G sources by examining the 20 GHz visibilities on baselines to the fixed ATCA ‘6 km’ antenna, which were not used for imaging (Murphy et al. 2010). These ‘6 km visibility’ measurements are available for 186 of the AT20G-6dFGS galaxies (92%), and provide information about the source compactness on sub-kpc scales as discussed in §3.2.2.
3.2.1 20 GHz morphology on kpc scales, from the AT20G snapshot images
Murphy et al. (2010) flagged 337 of the 5890 sources in the AT20G catalogue (5.7%) as extended (i.e. generally larger than about 10 arcsec in size) at 20 GHz. If we remove the 82 objects flagged by Murphy et al. (2010) as Galactic or LMC sources, then the fraction of extended sources falls slightly, to 308 out of 5806 or 5.3%.
The fraction of AT20G-6dFGS galaxies with extended 20 GHz emission (42/202 or 20.8%) is significantly higher than the 5% fraction seen for all extragalactic sources in the AT20G survey (Massardi et al. 2011a). This is not too surprising, since the AT20G-6dFGS galaxies are generally the lowest-redshift objects in the AT20G catalogue. The extended AT20G-6dFGS sources show a variety of radio morphologies, as summarized in Table 4. The classifications in this table are based on visual inspection of the AT20G snapshot images. The radio galaxy NGC 612 (J013357-010907), which has very extended 20 GHz radio emission imaged by Burke-Spolaor et al. (2009), is classifed here as a ‘wide triple’.
Sources which are unresolved in the AT20G images will generally be smaller in extent than the galaxies which host them, but may still be several kpc in size. Classical GPS and CSS radio sources, with typical sizes of kpc and kpc respectively (O’Dea 1998), are expected to be unresolved or marginally resolved sources in the AT20G images.
For the great majority of AT20G-6dFGS galaxies (77%), the high-frequency radio emission arises from an unresolved point source centred on the galaxy nucleus (i.e. a ‘radio core’). A further 11% have an extended AT20G source centred on the galaxy nucleus. Only 12% of the detected galaxies have 20 GHz emission which is significantly offset from the galaxy nucleus or resolved into two or more components.
| Description | Class | Number |
|---|---|---|
| Single source, centred on galaxy nucleus | Core | 178 |
| (compact at 20 GHz) | (159) | |
| (extended at 20 GHz) | (19) | |
| Single source, offset from nucleus | Hotspot | 4 |
| Two sources within a single ATCA beam | Compact double | 11 |
| Two separate AT20G detections | Wide double | 4 |
| Three sources within a single ATCA beam | Compact triple | 3 |
| Three separate AT20G detections | Wide triple | 2 |
| Total | 202 |
3.2.2 20 GHz morphology on sub-kpc scales, from ATCA 6 km visibilities
Chhetri et al. (2012) introduced a second measure of compactness for the AT20G sources, based on a visibility determined by the ratio of the average scalar amplitude of the five long ( km) ATCA baselines to the ten short (30–214 m) baselines in the H214 configuration. Sources with a flux density ratio were considered to be unresolved, and therefore have angular sizes smaller than about 0.2 arcsec. Measurements of the compactness parameter are available for 92% of the AT20G-6dFGS galaxies (Chhetri et al., in preparation).

Figure 2 shows the 20 GHz compactness parameter versus the 1-20 GHz spectral index for the AT20G-6dFGS galaxies. The clean separation between steep-spectrum extended sources and flat-spectrum compact sources seen seen by Massardi et al. (2011a; their Figure 4) is also visible here, and the fraction of sub-kpc scale 6dFGS-AT20G sources (i.e. those with compactness parameter ) is 87% (81/93) for flat spectrum sources, but only 35% (32/92) for steep-spectrum sources. We find no significant correlation between the compactness parameter and either redshift or 20 GHz radio luminosity.
3.3 20 GHz flux density measurements for extended sources
The AT20G survey images are insensitive to extended 20 GHz emission on scales larger than about 45 arcsec (Murphy et al. 2010). As can be seen from Figure 1, this may affect the measured 20 GHz flux densities of sources which are either at very low redshift () or extend well beyond their host galaxy.
Figure 3 allows us to estimate the importance of this effect, by comparing the AT20G catalogue measurements at 5 GHz with the Parkes-MIT-NRAO (PMN) catalogue (Gregory et al. 1994) which used the single-dish Parkes telescope (with a 4 arcmin beam at 5 GHz). The observations were taken more than a decade apart, so the flux density of individual sources may have varied, but the average value of the ratio SAT20G/SPMN is 0.930.04 for the AT20G sources which are unresolved in both the 20 GHz and NVSS/SUMSS images. In this case, it seems plausible that the small departure from unity could be due to confusing sources within the Parkes beam, or small differences in the flux-density scale, rather than missing flux in the AT20G images.
We therefore conclude that for the 70% of AT20G-6dFGS sources which fall into the FR-0 class, the catalogued AT20G flux densities at 5, 8 and 20 GHz represent an accurate measurement of the total radio flux density at these frequencies.
For AT20G-6dFGS galaxies with extended low-frequency radio emission (i.e. the FR-1 and FR-2 radio galaxies listed in Table 3, which represent around 30% of the AT20G–6dFGS sample), the ratio SAT20G/SPMN is 0.470.05. We therefore need to keep in mind that the listed AT20G flux densities for the FR-1 and FR-2 radio galaxies often reflect the high-frequency radio emission from the central core alone, rather than the core plus extended jets and lobes.
Burke-Spolaor et al. (2009) made new 20 GHz images of nine of the most extended sources in the AT20G sample, and their flux-density measurements were incorporated into the final AT20G catalogue (Murphy et al. 2010). Five of these sources (J013357-362935 (=NGC 612), J133639-335756 (=IC 4296). J215706-694123 (=ESO 075-G41), Pictor A and Centaurus A) are also members of the AT20G-6dFGS sample. Additional radio observations, with better sensitivity to extended emission, would be valuable to measure the total high-frequency flux density accurately for the other AT20G-6dFGS sources which have extended 20 GHz radio emission.

3.4 Radio spectral-index distribution
The spectral-energy distribution of radio sources is commonly expressed in terms of a two–point spectral index (where ) between frequencies and . Since many radio sources have curved rather than power-law continuum spectra, particularly at higher frequencies (Taylor et al. 2004; Sadler et al. 2006; Chhetri et al. 2012), it is important to keep in mind that the measured value of may shift with observing frequency and/or redshift.
Most radio-loud AGN have both a compact, flat-spectrum core and extended, steep-spectrum radio lobes, so the observed value of reflects the relative dominance of compact (recent) versus extended (longer-term) radio emission. While most core-dominated radio sources have flat radio spectra, compact steep-spectrum (CSS) radio sources are also seen (Fanti et al. 1990; O’Dea 1998).
At low frequencies, the radio AGN population is commonly divided into ‘steep-spectrum’ () and ‘flat-spectrum’ () sources (De Zotti et al. 2010; Chhetri et al. 2012). Steep-spectrum radio sources dominate in samples selected at frequencies near 1 GHz. For example, Mauch et al. (2003) measured a median 843–1400 MHz spectral index of for sources brighter than 50 mJy at 843 MHz. About 25% of these sources were classified as flat-spectrum and 75% as steep-spectrum.
Samples selected at higher radio frequencies are known to contain more flat-spectrum sources (e.g De Zotti et al. 2010). Sources brighter than 40 mJy in the 20 GHz–selected AT20G survey (Murphy et al. 2010) have a median 5–20 GHz spectral index of , with 69% classified as flat-spectrum objects (Massardi et al. 2011a).
3.4.1 Near-simultaneous spectral indices at 5-20 GHz
124 of the 202 galaxies in Table 3 (61%) have near-simultaneous radio flux density measurements at 5, 8 and 20 GHz available from the AT20G catalogue (Murphy et al. 2010). These multi-frequency data allow us to calculate high-frequency spectral indices between 5, 8 and 20 GHz, , in the same way as Massardi et al. (2011a) have done for the full AT20G sample.
As can be seen from Table 5, the distribution of spectral behaviour for the AT20G-6dFGS galaxies is similar to that found by Massardi et al. (2011a) for the weaker (S mJy) sources in the full AT20G sample, with a roughly equal mix of flat and steep-spectrum objects and a much smaller fraction of peaked or upturning radio spectra.
The main difference is that the local AT20G-6dFGS galaxies contain almost no ‘inverted-spectrum’ sources with both and . This is consistent with a picture in which the inverted-spectrum AT20G population (with a spectral peak above 20 GHz) is dominated by flares from relativistically-beamed objects (blazars), as discussed by Bonaldi et al. (2013). We would not expect these beamed objects to be present in the AT20G-6dFGS sample of nearby, K-band selected galaxies.
Bonaldi et al. (2013) estimate that the fraction of genuine ‘high-frequency peaker’ (HFP) radio galaxies in the full AT20G sample is per cent, implying that we would expect to see no more than one such object in the 6dFGS-AT20G sample of 201 galaxies. In fact, our sample does contain one galaxy (AT20G J212222-560014) which appears to have a genuine HFP radio spectrum. Hancock et al. (2010) note that J212222-560014 has a radio spectrum peaking above 40 GHz and shows no evidence for variability at 20 GHz, consistent with the behaviour expected for a very young GPS radio galaxy.
The median spectral indices measured for the local AT20G-6dFGS galaxies, and are similar to those measured for the AT20G sample as a whole ( and ; Massardi et al. 2011a), though it should be noted that (in contrast to the full AT20G sample) the median radio spectral index for the local AT20G-6dFGS galaxies is no steeper at 8-20 GHz than at 5-8 GHz.
This lack of curvature in the median 5–20 GHz radio spectrum for the AT20G-6dFGS galaxies is almost certainly due to their low redshift. Chhetri et al. (2012) show that the radio spectra of compact AT20G sources start to steepen above a rest frequency of about 30 GHz. For the nearby galaxies in the AT20G-6dFGS sample, unlike the more distant sources in the AT20G catalogue as a whole, this high-frequency curvature has not been shifted into the 8-20 GHz spectral range, so it is not surprising that the median 5–8 and 8–20 GHz spectral indices are similar for the local AT20G-6dFGS sample.
| Spectrum | Class | AT20G-6dFGS | Full AT20G | Full AT20G, |
|---|---|---|---|---|
| galaxies | sample | S mJy | ||
| No. (per cent) | No. (per cent) | No. (per cent) | ||
| and | Flat (Fhigh) | 55 (44.7) | 1766 (53.0) | 694 (45.0) |
| , | Steep (Shigh) | 54 (43.9) | 1086 (32.6) | 619 (40.1) |
| , | Inverted (Ihigh) | 1 (0.8) | 195 (5.8) | 66 (4.3) |
| , | Peak (Phigh) | 6 (4.9) | 183 (5.5) | 92 (5.9) |
| , | Upturn (Uhigh) | 7 (5.7) | 102 (3.1) | 73 (4.7) |
| Any | 123 (100) | 3332 (100) | 1544 (100) |

3.4.2 1-20 GHz spectral indices
All 202 galaxies in the AT20G-6dFGS sample have low-frequency radio data available from the 1.4 GHz NVSS (Condon et al. 1998) or 843 MHz SUMSS (Mauch et al. 2003) surveys, allowing us to calculate a 1–20 GHz spectral index for each galaxy. These spectral-index values need to be used with some caution since (i) the radio measurements were made several years apart and some sources may be variable, and (ii) the low- and high-frequency radio measurements have slightly different spatial resolution, which may affect the measured spectral index for extended sources.
Figure 4 compares with the near-simultaneous values for the 6dFGS galaxies which have multi-frequency AT20G data. The median 1–20 GHz spectral index for the 123 galaxies with 5, 8 and 20 GHz data, , is slightly steeper than the median 5–20 GHz spectral index of for the same group of galaxies. This is mainly because (as we discuss later in §3.5), some of the flat-spectrum objects seen at 5–20 GHz are embedded in more diffuse steep-spectrum lobes which contribute to the total flux density measured at frequencies near 1 GHz.

In the analysis which follows, we will use the values of (which are available for the whole AT20G-6dFGS sample) as a guide to separating the ‘flat-spectrum’ and ‘steep-spectrum’ radio-source populations (though it is important to keep in mind that, as can be seen from Figure 4, roughly 15% of the AT20G-6dFGS galaxies will have radio spectra which are ‘steep’ at low frequencies and ‘flat’ at higher frequencies).
Figure 5 shows the distribution of for the 202 sources in the AT20G-6dFGS sample. The median 1–20 GHz spectral index for the full AT20G-6dFGS sample is and although this plot suggests that the distribution may be bimodal, the data are statistically consistent with a normal distribution with a mean value of and a standard deviation of 0.503.
3.5 Candidate GPS and CSS radio sources
In §3.1, we divided the AT20G-6dFGS radio galaxies into three subclasses (FR-0, FR-1 and FR-2) based on their low-frequency radio morphology. We now use the radio morphology and spectral index information presented in §3.2 snd §3.4 to identify possible members of the class of Compact Steep Spectrum (CSS) and Gigahertz-Peaked Spectrum (GPS) sources which are generally thought to represent the earliest stages of radio-galaxy evolution (O’Dea 1998).
We have chosen to sub-divide the FR-0 class (i.e. the AT20G-6dFGS galaxies whose radio emission is unresolved in the 1 GHz NVSS/SUMSS images) as follows:
-
•
Candidate GPS sources (FR-0g). These are radio sources with a compactness parameter and 1-20 GHz spectral index , i.e. likely to be less kpc in size and have a radio spectrum peaking above 1 GHz (many of these sources peak at or above 5–10 GHz).
-
•
Candidate CSS sources (FR-0c). These are radio sources with a steep 1-20 GHz spectral index , i.e. less than 10-20 kpc in size and likely to have a radio spectrum peaking below 1-5 GHz.
-
•
Unclassified compact sources (FR-0u). These are sources which can’t be classsified as either CSS or GPS using the currently available data, either because they have no measured compactness parameter or because they have (making it difficult to locate a radio spectral peak in these objects, which generally have only a few data points available).
These results confirm that the AT20G-6dFGS sample contains a high fraction of possible CSS and GPS galaxies. At least 83 objects (41% of the total sample) are candidate CSS/GPS sources, and the fraction rises to 67% if we include the unclassified FR-0u objects.
Further analysis of the CSS/GPS candidate sources is difficult at this stage, though we discuss the possible effects of relativistic beaming in §6.2. Higher-resolution (VLBI) radio images of these objects, together with improved multi-wavelength radio data to measure their spectral turnover frequency, are needed to estimate the source ages and establish how many of them are genuinely young radio galaxies.
4 The local radio luminosity function (RLF) at 20 GHz
The local radio luminosity function (RLF) is the global average space density of radio sources at the present epoch (Auriemma et al. 1977; Condon et al. 1989), and provides an important benchmark for studying the cosmic evolution of radio-source populations (De Zotti et al. 2010). The local radio luminosity function of galaxies at 20 GHz provides a particularly useful benchmark for the study of high-redshift radio galaxies (since, for example, 1.4 and 5 GHz measurements of a galaxy at redshift correspond to 8 and 20 GHz in the object’s rest frame). High-frequency data also provide important constraints for the ‘simulated skies’ (Wilman et al. 2008) which are increasingly used in the science planning for future large radio telescopes like the Square Kilometre Array.
4.1 Calculating the local RLF
To calculate the local radio luminosity function of galaxies at 20 GHz, we used the same methodology as Mauch & Sadler (2007).
For the radio data, we set a flux–density limit of 50 mJy at 20 GHz and assumed a differential completeness of 78% above 50 mJy and 93% above 100 mJy (Massardi et al. 2011a).
For the 6dFGS data, we used a magnitude limit of K=12.75 mag. and assumed a spectroscopic completeness of 92.5% (Jones et al. 2009). The sky area covered by the AT20G-6dFGS sample was assumed to be the total 6dFGS area of 5.19 sr (16,980 deg2).
We calculated the local radio luminosity function using the 1/ method of Schmidt (1968), where is the maximum volume within which a galaxy can satisfy all the sample selection criteria (for the AT20G-6dFGS sample, mJy, mag. and ).

| log10 P20 | N | log |
|---|---|---|
| (W Hz-1) | (mag-1 Mpc-3) | |
| 21.2 | 1 | |
| 21.6 | 1 | |
| 22.0 | 3 | |
| 22.4 | 7 | |
| 22.8 | 6 | |
| 23.2 | 20 | |
| 23.6 | 28 | |
| 24.0 | 39 | |
| 24.4 | 33 | |
| 24.8 | 22 | |
| 25.2 | 10 | |
| 25.6 | 2 | |
| V/V = 0.450.02 | ||
4.2 Results
The local 20 GHz radio luminosity function measured from the AT20G-6dFGS galaxy sample is listed in Table 6 and plotted in Figure 6.
We derive a mean value of V/Vmax (0.450.02) for these galaxies, which is slightly lower than the value of 0.50 expected for a complete sample. This is almost certainly because the total 20 GHz flux density for some extended AT20G sources is underestimated, as discussed in §3.3. If these sources have measured flux densities below 50 mJy, they will be excluded from the RLF sample when they should have been included. If we separate the extended 20 GHz sources from those which are unresolved, we find V/V = 0.470.02 for unresolved sources and V/V = 0.370.05 for the extended sources, confirming that the small incompleteness in our overall sample arises mainly from the extended 20 GHz sources. Because of the relatively small size of the AT20G sample and the likely incompleteness in the extended-source population, we have not attempted to fit a functional form to the 20 GHz RLF. Instead, we used the parameterized form of the 1.4 GHz local RLF from equation (6) of Mauch & Sadler (2007), and fitted this to the 20 GHz data by making a simple shift in radio power set by a single characteristic 1-20 GHz spectral index for the RLF as a whole. The best-fitting value, , is shown by the dashed line in Figure 6.
It is important to note that the shift of which provides the best match for the 1.4 GHz and 20 GHz radio luminosity functions is steeper than the median 1-20 GHz spectral index of which we found for the AT20G-6dFGS galaxies in §3.4.2. The reason for this difference is not yet completely clear, but one plausible explanation is that the value of represents a characteristic 1–20 GHz spectral index for the local radio-galaxy population as a whole. Since the individual objects which make up this population have a broad spread in radio spectral index, the flat-spectrum members of this population are more likely to be detected at 20 GHz than the steep-spectrum objects and so this will flatten the observed spectral-index distribution for sources selected at 20 GHz.
5 Optical and infrared properties of the AT20G–6dFGS sample
5.1 Redshift and infrared K-band luminosity
Figure 7 shows the distribution of the sample galaxies in K-band apparent magnitude and redshift. Since the infrared K-band light in these nearby galaxies arises mainly from old giant stars, the K-band luminosity is closely related to the stellar mass of the galaxy.

Most of the galaxies in Table 3 lie close to the well-known K– relation for radio galaxies (Lilly & Longair 1984; Willott et al. 2003; De Breuck et al. 2002). The K- relation derived by Willott et al. (2003) and plotted in Figure 7,
is very close to the expected K-magnitude evolution of a passively-evolving galaxy which formed at high redshift () and has a present-day () luminosity of around 3 L∗. We therefore find that the AT20G-6dFGS radio sources are hosted by galaxies which have K-band luminosities matching those of powerful radio galaxies in the distant universe.
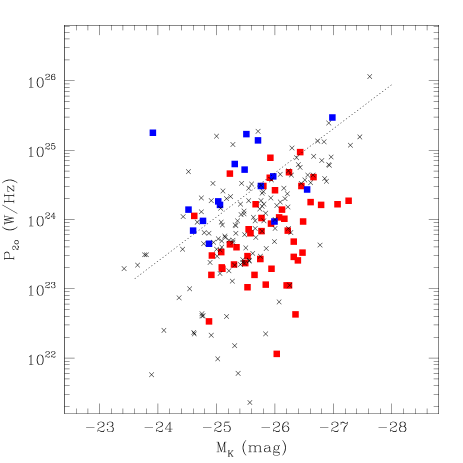
5.2 The radio/optical luminosity diagram
Figure 8 shows the distribution of the sample galaxies in radio and K-band luminosity. A radio -correction of the form has been applied, where is the radio spectral index (). Different symbols show galaxies classified as FR-1, FR-2 or FR-0 (compact) on the basis of their 1 GHz radio morphology, as discussed in §3. As with the NVSS-6dFGS sample of Mauch et al. (2007), almost all the AT20G-6dFGS galaxies are optically luminous (MK brighter than mag.), but there is no obvious correlation between radio and optical luminosity for galaxies above this K-band luminosity threshold.
There is a clear tendency for FR-2 radio galaxies to have a higher radio luminosity than FR-1 radio galaxies of similar stellar mass, implying that the relation found by Ledlow & Owen (1996; see their Figure 1), in which the FR-1/FR-2 division is a strong function of optical luminosity, also holds at 20 GHz. Interestingly, the compact (FR-0) sources cover the full range in 20 GHz radio power spanned by the FR-1 and FR-2 objects, and a few are also found in low-luminosity (MK fainter than mag.) galaxies. The radio galaxy Pictor A (AT20G J051949-454643) is a notable outlier in this plot, having a total 20 GHz radio power of W Hz-1 despite being one of the least optically-luminous galaxies in the AT20G-6dFGS sample (with M mag).
5.3 High-excitation and low-excitation radio galaxies
Recently, several authors (e.g. Hardcastle et al. 2007, Best & Heckman 2012 and references therein) have proposed a fundamental dichotomy between ‘high-excitation radio galaxies’ (HERGs), in which the AGN is fuelled in a radiatively efficient way by a classic accretion disk, and ‘low-excitation radio galaxies’ (LERGs) in which the accretion rate is significantly lower and radiatively inefficient. Best & Heckman (2012) derive accretion rates of one and ten per cent of the Eddington rate for HERGs, in contrast to a typical accretion rate below one per cent Eddington for the LERGs in their sample.
Observationally, HERGs are characterised by strong optical emission lines with line ratios characteristic of highly-excited gas (e.g. Kewley et al. 2006), while LERGs generally show weak or no optical emission lines. Ideally we would use a well-determined quantity such as emission-line luminosity to classify the AT20G-6dFGS radio galaxies, but this is difficult since the 6dFGS spectra are not flux-calibrated. Instead, we make a qualitative separation by associating the ‘Ae’ and ‘AeB’ radio galaxies in our sample with the HERG class, and ‘Aa’ and ‘Aae’ objects with the LERG class.
There are several reasons why this appears reasonable:
-
1.
The 6dFGS spectra have a resolution of 5-6 Å in the blue and 10-12 Å in the red (Jones et al. 2004). Since our Ae classification requires that a galaxy show optical emission lines which are strong relative to the stellar continuum, these objects are likely to have an [OIII] equivalent width well above the value of 5 Å which Best & Heckman (2012) use as one of the distinguishing criteria for of their HERG class.
-
2.
At least 25% of the Ae objects in our sample show broad Balmer emission characteristic of high-excitation Seyfert galaxies, while many of the narrow-line Ae objects also have a literature classification as Seyfert galaxies (see the notes in Appendix A).
-
3.
We know that most early-type galaxies show weak optical emission lines (generally with low-excitation LINER-like spectra as described by Heckman 1980) if one looks carefully enough (e.g. Phillips et al. 1986). In some cases, these emission lines may be excited by hot post-AGB stars rather than an AGN (Bertelli et al. 1989; Cid Fernandes et al. 2011). For fibre spectroscopy these weak emission lines may be easier to recognize in lower-redshift galaxies, simply because the fibre contains less of the stellar light from the surrounding galaxy, as discussed by Mauch & Sadler (2007). As a result, we expect to see significant overlap between our Aa and Aae classes and so it seems plausible to associate all these objects with the LERG class.
If we make this separation, then 23% of the AT20G-6dFGS radio sources are classified as high-excitation (HERG) systems and 77% as low-excitation (LERG). While LERGs are the majority population, the HERG fraction is higher than that seen in comparable radio-source samples selected at 1.4 GHz. Only of the radio AGN in the Mauch & Sadler (2007; MS07) are classified as Ae galaxies, and the HERG fraction in the Best & Heckman (2012; BH12) sample of radio AGN is even lower than this.
The higher HERG fraction seen in the 20 GHz sample is not simply an effect of comparing objects with different radio luminosities (the AT20G sources are typically more powerful than those selected from NVSS, because the AT20G catalogue has a 40 mJy flux density limit, compared to 2.5 mJy for NVSS). To check this, we compared the HERG fraction in several bins of 1.4 GHz (not 20 GHz) radio power for the AT20G-6dFGS, BH12 and MS07 galaxy samples. For radio powers in the range 1023.8 to 1025.6 W Hz-1 the HERG fraction in the AT20G-6dFGS sample was at least three to five times higher than in the corresponding BH12 and MS07 samples. In the highest-power bin (1025.6 to 1026.5 W Hz-1), which contains only a relatively small number of objects, all three samples showed a high HERG fraction of around 40–50%.
| AT20G name | Alt. | Redshift | Spectral | MK | log P20 | Galaxy | T-type | Notes | |
|---|---|---|---|---|---|---|---|---|---|
| name | class | mag | W Hz-1 | class | |||||
| (a) Nearby () galaxies classified as spiral in the RC3 and/or ESO/Uppsala catalogues | |||||||||
| J004733-251717 | NGC 253 | 0.0008 | SF | 22.74 | 20.93 | 0.91 | Sc | 5.0 | Nuclear starburst |
| J024240-000046 | NGC 1068 | 0.0038 | Ae | 25.31 | 22.18 | 0.86 | Sb | 3.0 | Seyfert 2 galaxy |
| J123959-113721 | NGC 4594 | 0.0036 | .. | 25.57 | 21.36 | 0.05 | Sa | 1.0 | |
| J130527-492804 | NGC 4945 | 0.0019 | .. | 23.89 | 21.76 | 0.64 | Scd | 6.0 | AGN (Liner) |
| J130841-242259 | IRAS 13059-2407 | 0.0142 | Ae | 22.11 | 22.41 | 0.80 | Sc? | … | Drake et al. (2003) |
| J131949-272437 | NGC 5078 | 0.0071 | Aae | 25.37 | 21.78 | 0.59 | Sa | 1.0 | |
| J133608-082952 | NGC 5232 | 0.0228 | Aae | 25.78 | 23.83 | 0.16 | Sa | 0.0 | |
| J145924-164136 | NGC 5793 | 0.0117 | .. | 24.10 | 22.40 | 1.00 | Sb | 3.0 | Seyfert 2 galaxy |
| J172341-650036 | NGC 6328 | 0.0142 | .. | 24.74 | 24.11 | 0.08 | Sab | 1.8 | AGN (Liner) |
| J220916-471000 | NGC 7213 | 0.0060 | .. | 25.01 | 21.99 | 0.01 | Sa | 1.0 | Seyfert 1 galaxy |
| (b) More distant () galaxies noted in the literature as spirals | |||||||||
| J001605-234352 | ESO 473-G07 | 0.0640 | Ae | 24.79 | 23.81 | 0.53 | S… | 5.0 | |
| J031552-190644 | PMN J0315-1906 | 0.0671 | Ae? | 24.62 | 24.05 | 0.03 | S.. | … | Ledlow et al. (2001) |
| J220113-374654 | AM 2158-380 | 0.0334 | Ae | 24.87 | 23.65 | 0.82 | S? | .. | Drake et al. (2003) |
5.4 Optical morphology of the host galaxies
Most of the powerful radio-loud AGN in the local universe are hosted by massive elliptical galaxies (e.g. Lilly & Prestage 1987; Owen & Laing 1989; Veron-Cetty & Veron 2001), though some exceptions are known (e.g. Ledlow et al. 2001; Hota et al. 2011), and we also know that nearby spiral galaxies can host compact radio-loud AGN (e.g. Norris et al. 1988; Sadler et al. 1995).
Some of the galaxies in the AT20G-6dFGS sample are at low enough redshift () that a reliable classification of their optical morphology is available from the RC3 (de Vaucouleurs et al. 1991) and/or ESO-Uppsala (Lauberts 1982) galaxy catalogues. We have therefore used these classifications, where available, to look at the host galaxy properties of the AT20G-6dFGS sample.
Of the 34 lowest-redshift () galaxies in Table 3, twenty-four are classified as early-type (E or S0) galaxies and ten as late-type (spiral/disk) galaxies, implying that at the lowest 20 GHz luminosities probed by our sample ( to W Hz-1) around 30% of the host galaxies are spirals.
Although the morphologically-classified subsample (34 AT20G-6dFGS galaxies with ) is small, some general patterns can be seen. In particular, all nine FR-1 radio galaxies in this redshift range have E/S0 host galaxies but almost half the compact FR-0 sources are in spiral galaxies.
Table 7 lists the thirteen galaxies in our sample which are known to have spiral or disk-like optical morphology (this table also includes some objects with ). Six of these galaxies (NGC 253, NGC 1068, NGC 4594. IRAS 13059-2407, NGC 5078 and NGC 5232) also belong to the sample of dusty ‘infrared-excess IRAS galaxies’ identified by Drake et al. (2004), and PMN J0315-1906 has been identified by Ledlow et al. (2001) as a rare example of an FR-1 radio source hosted by a spiral galaxy.
Since reliable morphological classifications are not available for the more distant galaxies in the 6dFGS-AT20G sample, the next section discusses the use of mid-infrared photometry from WISE as an alternative way of investigating host-galaxy properties.
5.5 Mid-infrared photometry from WISE
Near- and mid-infrared photometry (at 3.4, 4.6, 12 and 22 m) is now available for all the AT20G-6dFGS galaxies from the WISE mission (Wright et al. 2010). The majority of galaxies in our sample (141/202) are flagged as extended 2MASS objects (ext_flag=5), and for these we used the elliptical aperture magnitudes as recommended by Wright et al. (2010). For the remaining galaxies, which were flagged as unresolved in the WISE catalogue, we used the profile-fit magnitudes.
We restricted our analysis to galaxies with WISE 3.6m magnitude fainter than 6.0, since galaxies brighter than this may be too large on the sky to allow accurate photometry with WISE. We also excluded five galaxies which had anomalous WISE colours because of contamination from a companion galaxy or bright foreground star. This left a total of 193 AT20G-6dFGS galaxies with good-quality WISE photometry.
5.6 The WISE two-colour plot
Figure 9 shows a WISE colour-colour plot for the full AT20G-6dFGS sample, based on Figure 12 of Wright et al. (2010). The errors on individual data points are typically 0.05 mag in colour and 0.1 mag in colour. The dotted horizontal and vertical lines are also based on the work of Wright et al. (2010), who divide elliptical and spiral galaxies at a WISE colour of +1.5 mag. and note that the most powerful optical AGN lie above a colour of +0.6 mag. For nearby AT20G-6dFGS galaxies with a reliable optical classification (see §4.3 above), there is excellent agreement between the optical and WISE galaxy classes. We also see that all the galaxies in which we detected strong, broad Balmer emission lines (class AeB) lie close to the line followed by blazars and radio-loud QSOs (Massaro et al. 2012).
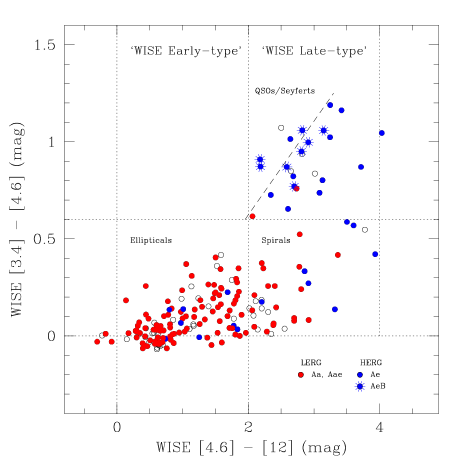
The WISE two-colour plot is becoming widely used for galaxy population studies, and its interpretation has recently been discussed by several authors. The [3.4] - [4.6] micron colour can be used to separate normal galaxies from AGN with a strongly-radiating accretion disk (Assef et al. 2010; Yan et al. 2013), while the [4.6] - [12] micron colour separates dusty star-forming galaxies (or galaxies in which the dust is heated by radiation from an AGN) from early-type galaxies with little or no warm dust. Donoso et al. (2012) have shown that the colour reflects a galaxy’s specific star-formation rate (SSFR), i.e. the current star-formation rate divided by the total stellar mass.
If we follow Wright et al. (2010) and set the dividing line between WISE ‘ellipticals’ and ‘spirals’ at a colour of mag., we find that almost half of our AT20G-6dFGS galaxies (93/193, or 48%) fall into the ‘spiral’ category. If we set a more stringent cutoff for WISE ‘spirals’ at mag. (which roughly corresponds to the main locus of star-forming galaxies in Figure 8 of Donoso et al. 2012), we find a spiral fraction of 31% (60/193) for the AT20G-6dFGS sample. This is similar to the spiral fraction of % derived from optical classification of the closest galaxies in our sample (see §4.4), so we adopt mag. as a reasonable dividing line between host galaxies which lie in the ‘WISE elliptical’ region and those which correspond to ‘WISE spirals’. Since ‘elliptical’ and ‘spiral’ are morphological descriptions, while the WISE two-colour plot is based on the mid-infrared spectral-energy distribution, in the remainder of this paper we refer to the two classes of host galaxy as ‘WISE early-type’ ( mag) and ‘WISE late-type’ ( mag) galaxies respectively.
5.6.1 WISE early-type galaxies
As discussed above, around 70% of the AT20G-6dFGS galaxies have WISE colours which are typical of normal elliptical and S0 galaxies. Of the 25 ‘WISE early-type’ galaxies with an RC3 or ESO morphological type, 22 are classified as E or S0 galaxies and three as early-type (Sa) spirals, showing that there is generally good agreement between the WISE classification and the optical morphology where both are available.
5.6.2 WISE late-type galaxies
The remaining 30% of AT20G-6dFGS galaxies fall into the ‘WISE late-type’ class. Nine of them also have an RC3 or ESO morphological type – seven are classified as spirals (ranging from Sa to Scd) and two as S0 galaxies, again implying that the WISE classification is generally consistent with the observed optical morphology.
We note, however, that the ‘WISE late-type’ galaxies in our sample may be a heterogeneous class, since they are selected because they contain significant quantities of (warm or hot) dust. They include genuine spiral galaxies like those listed in Table 7, as well as elliptical and S0 galaxies with dust lanes (e.g. NGC 612 = AT20G J013357-362935; see Ekers et al. 1978) and composite objects like the ‘radio-excess IRAS galaxies’ identified by Drake et al. (2004).
5.6.3 Host galaxies of HERGs and LERGs
Table 8 relates the WISE classification (derived from Figure 9) to the HERG/LERG spectral class for the AT20G-6dFGS galaxies. We find that almost all the WISE ‘early-type’ galaxies (92%) have low-excitation (LERG) optical spectra, while the WISE ‘late-type’ galaxies have a mix of HERG and LERG spectra.
This result is in broad agreement with earlier studies of radio galaxies selected at 1.4 GHz. Hardcastle et al. (2013) found that HERGs are typically about four times as luminous as LERGS in the far-infrared 250 m band, and interpret this as showing that HERGs are more likely to be located in star-forming galaxies. Best & Heckman (2012) found that HERGs in their local sample typically had lower stellar masses and younger stellar populations than LERGS, again consistent with a picture in which HERGs are commonly found in star-forming galaxies.
| WISE [4.6] - [12] m | Spectral class | Median | HERG | ||
|---|---|---|---|---|---|
| colour | class | HERG | LERG | MK (mag) | fraction |
| 2.0 mag | ‘Early-type’ | 8 | 100 | 7 % | |
| 2.0 mag | ‘Late-type’ | 26 | 20 | 57 % | |
| Class | 1 GHz radio | 20 GHz radio | N | Median | Median | Median log P20 | Spectral class | WISE class | ||
| morphology | morphology | redshift | MK (mag) | (W Hz-1) | LERG | HERG | Early | Late | ||
| /spectral index | (Aa/Aae) | (Ae/AeB) | ||||||||
| FR-2 | Resolved, | Any | 16 | 0.0604 | 36% | 64% | 7% | 93% | ||
| edge-brightened | ||||||||||
| FR-1 | Resolved, | Any | 49 | 0.0535 | 98% | 2% | 93% | 7% | ||
| not edge-brightened | ||||||||||
| FR-0 (all) | Unresolved | Any | 136 | 0.0653 | 75% | 25% | 67% | 33% | ||
| (LAS 30 arcsec) | ||||||||||
| FR-0g | Unresolved | Compactness param. | 34 | 0.0662 | 75% | 25% | 64% | 36% | ||
| 0.85,and | ||||||||||
| FR-0c | Unresolved | 49 | 0.0684 | 67% | 33% | 67% | 33% | |||
| FR-0u | Unresolved | (not in FR-0g | 53 | 0.0517 | 84% | 16% | 69% | 31% | ||
| or 0c class) | ||||||||||
| All flat-spectrum sources () | 97 | 0.0576 | 81% | 19% | 68% | 32% | ||||
| All steep-spectrum sources () | 104 | 0.0596 | 74% | 26% | 69% | 31% | ||||
| All AT20G-6dFGS AGN | 201 | 0.0581 | 77% | 23% | 68% | 32% | ||||
5.7 Comparison with the 1.4 GHz-selected NVSS-6dFGS radio galaxy sample
Finally, we compare the spectroscopic properties of the current (20 GHz-selected) 6dFGS-AT20G galaxy sample with the 1.4 GHz-selected 6dFGS-NVSS sample complied by Mauch & Sadler (2007). This is a useful comparison, since both samples were selected from the 6dFGS galaxy catalogue and so differ only in their radio flux limit and the frequency at which they were selected.
Table 10 compares the spectroscopic properties of the two samples. The AT20G survey has a significantly brighter flux-density limit (40 mJy at 20 GHz) than the NVSS (2.5 mJy at 1.4 GHz), so a comparison with a brighter NVSS sub-sample (S mJy at 1.4 GHz) is also included.
One striking difference between the 6dFGS-NVSS and 6dFGS samples is the fraction of galaxies which show optical emission lines (class Aae, Ae or AeB), which is 20–25% for radio AGN selected at 1.4 GHz, but more than twice as high (50%) for galaxies selected at 20 GHz.
| 6dFGS-NVSS (1.4 GHz) | 6dFGS-AT20G (20 GHz) | ||
| Mauch & Sadler (2007) | This paper | ||
| all radio AGN | S mJy only | all AGN | |
| No. of galaxies | 2784 | 271 | 201 |
| Magnitude limit | K | K | K |
| Slim (mJy) | 2.5 | 100.0 | 40.0 |
| Area (sr) | 2.16 | 2.16 | 5.19 |
| Median | 0.073 | 0.0798 | 0.0596 |
| Median absolute magnitude MK | |||
| HERG fraction (Ae, AeB) (%) | 13 | 10 | 23 |
| Emission-line fraction (Aae, Ae, AeB)(%) | 26 | 19 | 50 |
This is not a redshift-based selection effect, since the AT20G–6dFGS galaxies consistently show a higher emission-line fraction than NVSS–6dFGS galaxies at the same redshift. Instead, it arises from two effects: (i) a significantly higher HERG fraction in the AT20G-6dFGS sample as a whole (23% HERGs, compared to 10-13% for the NVSS-6dFGS sample, see Table 10), and (ii) a correlation between the 1–20 GHz radio spectral index of a galaxy and the probability that it will show weak optical emission lines. We find that a radio-loud AGN selected at 1.4 GHz from the 6dFGS sample is typically three times more likely to be detected in the AT20G survey if it has an emission-line (Aae or Ae) spectrum.

Figure 10 shows that while galaxies with strong emission lines (class Ae) are seen across the full range of radio spectral index, the fraction of radio galaxies with weak optical emission lines (class Aae) increases rapidly as we move from steep-spectrum to flat-spectrum sources. Further work is needed to understand what produces this correlation. There are several possibilities. The sources may be small enough to be affected by free-free absorption in the innermost regions of the nucleus, giving rise to an observed radio spectrum which peaks at frequencies above 5 GHz, as appears to be the case in the nearby galaxy NGC 1052 (Kameno et al. 2001; Vermeulen et al. 2003). Alternatively, young radio sources may be preferentially triggered in galaxies where sufficient gas is present in the nucleus to fuel them.
Whatever the physics involved, it appears that the AT20G sample contains a distinct class of compact, flat-spectrum radio sources which lie in galaxies with (generally weak) emission-line AGN. Because of their flat or peaked radio spectra, such objects are more likely to be seen in samples selected at higher radio frequencies and so they have not been studied in a systematic way in the past.
6 Discussion
6.1 Radio and optical properties of the AT20G-6dFGS sample
We have measured three main radio parameters for galaxies in our sample: the radio morphology, radio luminosity and spectral index. We also have three key optical/infrared measurements: the K-band (2.2 m) absolute magnitude, which is a proxy for galaxy stellar mass, the WISE mid-infrared colours, which can reveal the presence of dust heated by star formation, or a radiatively-efficient AGN, and the spectral class (Aa, Aae or Ae), which is thought to reflect the efficiency of gas accretion onto the central black hole.
Four of these parameters (radio luminosity, radio morphology, galaxy stellar mass and spectral class) have been examined in previous large studies of radio-source populations, using galaxy samples selected at frequencies of 1.4 GHz or below. In terms of the interplay of these four properties, our results (which we discuss briefly below) are in broad agreement with earlier work.
The other parameters (radio spectral index and WISE mid-infrared colours) are less well-studied. The WISE data (Wright et al. 2010) are relatively new, but are rapidly coming into wide use for studies of galaxy evolution. Earlier studies of local radio-source populations have generally not had any radio spectral-index information which allowed them to distinguish between steep-spectrum and flat-spectrum sources, though a flux-limited multi-frequency catalogue of northern radio sources extending up to 5 GHz has been published by Kimball & Ivezic (2008).
Table 9 summarizes the overall properties of the AT20G-6dFGS galaxies as a function of Fanaroff-Riley class (FR 0, 1 and 2) and radio spectral index. We can draw several conclusions from this:
6.1.1 Radio morphology:
Only one-third of the AT20G-6dFGS sources (32%) are associated with classical FR-1 and FR-2 radio galaxies – the other two-thirds appear to be relatively compact sources even at low radio frequencies (0.8-1 GHz).
The host galaxies of FR-2 radio sources are typically less massive than the hosts of FR-1 galaxies (as measured by their infrared K-band luminosity), and the FR-2 galaxies also have a much higher fraction of HERG (Ae/AeB) spectra, in broad agreement with the results of Best & Heckman (2012) and earlier studies (e.g. Hardcastle et al. 2004).
The compact (FR-0) radio galaxies have typical properties which are intermediate between the FR-1 and FR-2 systems in both stellar mass and spectral class. The FR-0 class contains a mix of HERG and LERG systems, and seems likely to be a composite class which includes the early stages of both FR-1 and FR-2 radio galaxies, as well as some sources in which the core is brioghtened by relativistic beaming. We discuss this question further in §6.2 and §6.3.
Baum et al. (1998) found that GPS radio sources tend to have lower emission-line luminosities than CSS sources. The fraction of galaxies with strong optical emission lines is slightly higher for the candidate CSS (FR-0c) sources (%) than in the GPS (FR-0g) sources (%), but the difference is not statistically significant in this relatively small sample.
6.1.2 Radio luminosity
By selecting our sample from the AT20G catalogue, which has a cutoff flux density of 40 mJy, we are by definition selecting the more luminous radio galaxies in the local universe. The median 20 GHz radio luminosity of the AT20G-6dFGS galaxies is just below 1024 W Hz-1, i.e. close to the dividing line between classical FR-1 and FR-2 radio galaxies.
The FR-2 radio galaxies have a significantly higher median radio luminosity at 20 GHz (by almost an order of magnitude) than the FR-1 objects, even though the FR-1 sources generally lie in more massive galaxies. Our data support the finding of Ledlow and Owen (1996) that FR-2 radio sources are more powerful than FR-1 sources in galaxies of similar stellar mass. It is interesting that the ‘Ledlow-Owen’ line derived for the total radio power at 1.4 GHz also these objects reasonably well at 20 GHz, with the majority of FR-2 sources (69%) lying above the line and the majority of FR-1 sources (92%) below.
6.1.3 Radio spectral index:
As discussed in §3.4, roughly half of the AT20G-6dFGS galaxies have flat-spectrum radio sources and (as shown in Figure 2) there is a close relationship between between radio morphology and spectral index, with flat-spectrum sources being more compact than steep-spectrum ones.
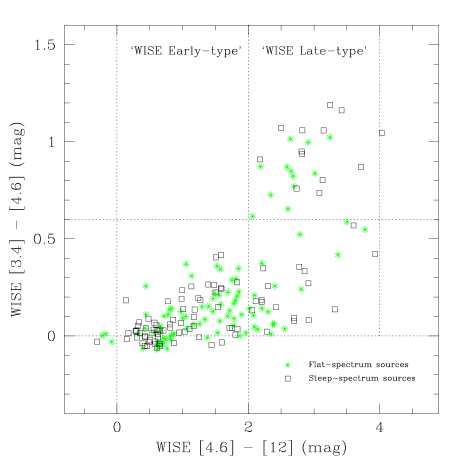
Figure 11 shows a WISE two-colour plot similar to Figure 9, but with now with separate symbols for steep-spectrum () and flat-spectrum () radio sources. We see a roughly equal mix of flat-spectrum and steep-spectrum radio sources in both the ‘WISE early-type’ and ‘WISE late-type’ galaxies, showing that the distribution of radio spectral index does not depend on the host-galaxy type.
Table 9 also shows that the flat–spectrum and steep–spectrum radio sources in our sample are found in galaxies of similar median stellar mass. Both findings are consistent with a picture in which the flat-spectrum and steep-spectrum sources in the AT20G-6dFGS sample correspond to different stages of radio–galaxy evolution, rather than physically-distinct radio-source populations.
6.2 Relativistic beaming
De Zotti et al. (2010) note that radio surveys at frequencies of 5 GHz and above are dominated by flat-spectrum sources (at least at higher flux densities), and that most of these flat-spectrum sources are likely to be brightened by relativistic beaming because they are observed along a line of sight which is very close to the jet axis. These beamed sources generally show rapid variability at radio wavelengths, and fall into two classes: Flat-spectrum radio quasars (FSRQs), which show strong optical emission lines with broad Balmer wings, and BL Lac objects (BLLs), in which the optical emission lines are weak or absent. In unified models for AGN (Urry & Padovani 1995; Jackson & Wall 1999), BLLs and FSRQs are assumed to be the beamed counterparts of FR-1 and FR-2 radio galaxies respectively.
Most tests of the unified model have been carried out for populations of very luminous (radio power W Hz-1) radio sources (e.g. Padovani & Urry 1992; Cara & Lister 2008), and the extent to which the much larger population of low-luminosity, flat-spectrum radio AGN is beamed remains unclear. The radio sources in the AT20G-6dFGS sample have typical radio luminosities of 1023 to 1025 W Hz-1 at 20 GHz.
Marcha at al. (2005) compared the emission-line luminosities of a sample of core-dominated sources (with core powers in the range to 1025 W Hz-1 at 5 GHz) and a matched sample of FR-1 radio galaxies with similar redshift and 1.4 GHz flux density. They found that the core-dominated objects had significantly stronger optical emission lines than the matched FR-1 sample, contradicting the predictions of a simple unified model. These authors concluded that while a more sophisticated version of the unified model could fit their data, their results were equally consistent with a model in which relativistic beaming has little or no effect on the observed flux density of most low-luminosity flat-spectrum sources. Ekers et al. (1983) carried out a six-year program to monitor the 5 GHz flux densities of a sample of low-luminosity compact radio sources, and also concluded that their results did not support simple relativistic beaming models.
The AT20G-6dFGS galaxies in this paper are selected from within a sample of normal, nearby galaxies. If all the compact flat-spectrum sources in this sample are brightened at 20 GHz by relativistic beaming, then the effects at optical and mid-IR wavelengths must generally be quite subtle since only about 10% of these sources lie near the WISE ‘blazar line’ (Massaro et al. 2012) in Figure 9 and most have mid-IR colours characteristic of normal galaxies rather than beamed AGN.
A detailed test of beaming models for the AT20G-6dFGS sample would require high-quality radio imaging of these sources at VLBI resolution, and so is outside the scope of the present paper. We can however make some simple tests to estimate the fraction of AT20G-6dFGS sources which may have their observed 20 GHz radio luminosity affected by relativistic beaming. In the absence of detailed VLBI images of the galaxies in our sample, we consider (i) objects which are already identified in the literature as blazars, (ii) tests for radio variability, as used by Bonaldi et al. (2013) to distinguish between genuine High-Frequency Peakers and candidate blazars, and (iii) the evidence for a non-thermal contribution to the optical spectrum, as used by Marcha & Caccianiga (2013) to identify low-luminosity BL Lacs.
6.2.1 Individual AT20G-6dFGS galaxies identified as beamed radio sources (blazars)
Four of the galaxies in our sample (AT20G J024554-445939; J052223-072513; J130715-760245 and J180957-455241) have compact (FR-0), flat-spectrum radio emission and show broad emission lines in their optical spectra. All four can be regarded as flat-spectrum radio quasars (FSRQs), in which the high-frequency radio emission is probably beamed.
A further three galaxies (AT20G J090802-095937; J151741-242220 and J231905-420648) are classified as radio-selected BL Lacs in the literature. One of these, J151741-242220 (AP Lib; Carini et al. 1991) is a compact flat-spectrum source and a well-studied blazar which shows strong variability at both optical and radio wavelengths. The other two objects (J090802-095937, which is in the BL Lac sample studied by Nieppola et al. 2006, and J231905-420648, identified as a radio-selected BL Lac object by Roberts et al. 1998) are both associated with FR-1 radio galaxies in clusters, rather than flat-spectrum FR-0 sources. Whether these last two objects are beamed is therefore somewhat unclear.
If we assume that all seven of these objects are blazars, we can estimate the minimum fraction of beamed radio sources in the local AT20G-6dFGS sample – this is roughly 3.5% (7/201) for the sample as a whole, and 6% (5/83) for the sub-sample of compact flat-spectrum (FR-0g and FR-0u) sources.
Since the classification of low-luminosity BL Lac objects in the literature is inhomogeneous and likely to be incomplete (particularly in the southern hemisphere; Massaro et al. 2009), we address the question of beaming by using two indicators which can be applied in a fairly uniform way to at least a subset of our sample. These tests are described in the next two subsections, after which we derive the likely maximum beaming fraction in the AT20G-6dFGS sample.
6.2.2 Radio-frequency variability of the compact, flat-spectrum (FR-0g and FR-0u) AT20G-6dFGS sources
Relativistically-beamed radio sources are expected to be strongly variable at GHz radio frequencies on timescales of months to years (e.g. Hovatta et al. 2007; Massardi et al. 2011b; Chen et al. 2013). In contrast, genuinely young GPS and CSS are not expected to be beamed, and typically vary in flux density by less than 10% on timescales of a year or so (O’Dea 1998).
Bonaldi et al. (2013) used measurements of radio variability to discriminate between candidate High Frequency Peakers (HFPs; i.e. very young radio galaxies) and candidate blazars. Over a 2–4 year timescale, they found a median variability index of 13.1% at 5 GHz and 15.0% at 9 GHz for their sample of flat-spectrum sources, 95% of which were blazars.
We are not able to measure the variability of the AT20G-6dFGS sources at 20 GHz, since at this frequency we only have data at a single epoch. We can, however, use 5 and 8 GHz flux measurements from the ATPMN survey (McConnell et al. 2012) to estimate the variability at these frequencies. Since the ATPMN survey was carried out with a different ATCA configuration which had significantly higher spatial resolution than the 5 and 8 GHz observations carried out for the AT20G survey, we can only make this test for compact, flat spectrum sources which are unresolved in both surveys.
The ATPMN observations were taken between 1992 November and 1994 March, and the AT20G observations between 2004 November and 2007 May. Thus the time interval between each pair of observations is between 10 and 15 years. We defined our 5 and 8 GHz variability sample as follows:
-
1.
We only included galaxies in the area of sky covered by the ATPMN survey, i.e. south of declination .
-
2.
We restricted our analysis to compact (FR-0) sources with flat radio spectra from 1–20 GHz (i.e. ), to avoid introducing false ‘variability’ in sources where extended 5/8 GHz structures included in the AT20G flux density measurement were partly resolved out by the smaller ATPMN beam.
This left a final sample of 26 flat-spectrum FR-0 galaxies, and for each of these objects we calculated a debiased variability index (as described by Sadler et al. 2006 and Massardi et al. 2011b) at both 5 and 8 GHz.
For the compact, flat-spectrum AT20G-6dFGS galaxies which were also observed in the ATPMN survey, we find a median variability index of % at 5 GHz and 6.5% at 8 GHz, over a time interval of 10-15 years. Only 35% of sources (9/26) varied by more than 10% at 5 GHz over this time interval, and 38% (10/26) varied by more than 10% at 8 GHz. Only three sources (J024326-561242, J121044-435437 and J194524-552049) varied by more than 20% at either 5 or 8 GHz over this 10-15 year interval.
In practice, the fraction of sources with observed flux density variations of 10% is likely to be an upper limit to the blazar fraction in our sample. There are two reasons for this. Firstly, the time interval over which we measure variability (10–15 years) is much longer than the 1–2 year interval for which O’Dea (1998) characterises the variability of young GPS and CSS and CSS radio galaxies, so it is plausible than even non-beamed compact sources could vary by up to 15–20% over this longer interval. Secondly, the mean flux ratio is at 5 GHz and at 8 GHz, implying that even though we have restricted our analysis to compact flat-spectrum sources, the AT20G flux measurements include some extended emission which is not seen in the higher-resolution ATPMN images. If so, the presence of this extended emission at one of our two epochs will produce a spurious rise in the measured variability level.
Since we find that around two-thirds of the flat-spectrum FR-0 sources in our sample show a long-term variability in flux density of less than 10% at 5–8 GHz, consistent with the behaviour expected for young radio galaxies rather than beamed radio sources, we estimate that the fraction of beamed sources in the combined FR-0g and FR-0u subsample is no higher than 35–40%.
A more detailed variability study of the AT20G-6dFGS sources, using a smaller time interval and better-matched array configuration, would allow more stringent limits to be placed on the likely beamed fraction.
6.2.3 Tests for a non-thermal contribution to the optical spectrum
Since the variability sample discussed above is relatively small, we make a second test using the 6dFGS optical spectra. Marcha & Caccianiga (2013) note that it can be difficult to recognise the presence of low-luminosity BL Lac nuclei concealed within optically bright galaxies, and used the contrast across the Ca HK break at 4000 Å to identify these weak beamed AGN. Their selection criteria required that enough non-thermal flux from the AGN was present, in addition to the starlight of the host galaxy, to reduce the contrast across the 4000 Å break from the value of seen in a normal early-type galaxy to .
We applied the same test to the 6dFGS spectra of the FR-0 and FR-1 galaxies in our sample, including both flat-spectrum (FR-0g, FR-0u) and steep-spectrum (FR-0c, FR-1) sources. The FR-2 sources were excluded from this test, since only a few of them have a suitable 6dFGS spectrum available.
| Flat-spectrum | Steep-spectrum | ||
| Spectral type | FR-0u, 0g | FR-0c | FR-1 |
| Aa/Aae, contrast | 31 | 18 | 25 |
| (normal galaxy) | |||
| Aa/Aae, contrast | 14 | 1 | 3 |
| (BLL candidate) | |||
| Ae | 6 | 7 | – |
| AeB | 5 | 2 | – |
| Total | 56 | 32 | 28 |
| Maximum beamed fraction: | |||
| Galaxies with Aa/Aae spectra | 31% (14/45) | 5% (1/19) | |
| All galaxies | 32% (18/56) | 9% (3/32) | 11% (3/28) |
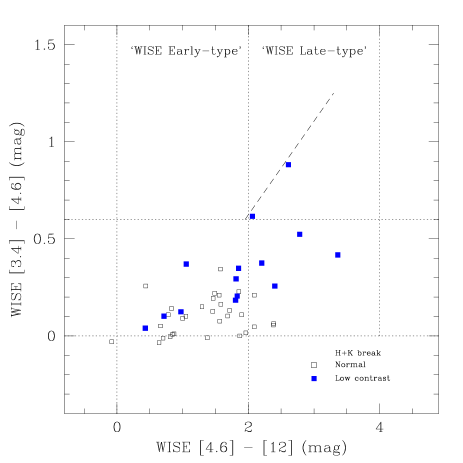
Table 11 summarizes the results of these measurements. If we assume that all the galaxies with a low-contrast () HK break are low-luminosity BL Lacs (Marcha & Caccianiga 2013), and that all the galaxies which show broad optical emission lines also contain beamed sources (Hardcastle et al. 1999), then the fraction of AT20G-6dFGS sources which are beamed is around 35% for flat-spectrum sources and 11% for steep-spectrum sources.
In practice, it is likely that not all the galaxies with a ‘low-contrast’ break are BL Lacs, since the presence of a young or intermediate-age stellar population will also reduce the size of the break and we have already shown (§5.6.2) that around 30% of the AT20G-6dFGS radio sources lie in galaxies with ongoing star formation. As with the variability tests described in the §6.2.2, the HK break measurements therefore provide an upper limit to the fraction of AT20G-6dFGS galaxies in which the observed radio emission is strongly affected by beaming.
Figure 12 shows a WISE two-colour plot for the compact flat-spectrum sources for which we were able to measure the contrast across the HK break. Filled squares show the galaxies with a low-contrast break, which could potentially host a low-luminosity BL Lac nucleus.
As can be seen from Figure 12 the WISE m colours of the ‘low-contrast’ galaxies are significantly offset from those of the galaxies with a ‘normal’ HK break. Two of the ‘low-contrast’ galaxies, J091300-210320 and J151741-242220, have and lie close to the WISE blazar line of Massaro et al. (2012). The remaining 12 ‘low-contrast’ galaxies have a mean colour of 0.270.04 mag., compared to a mean of 0.100.02 mag for the 31 galaxies with a normal HK break. This shift in WISE colour is consistent with what might be expected if the ‘low-contrast’ galaxies host a weak (beamed) BL Lac nucleus.
6.2.4 How many of the flat-spectrum AT20G-6dFGS sources are affected by relativistic beaming?
The variability analysis in §6.2.2 and the optical HK break measurements presented in §6.2.3 both imply that no more than 30–35% of the flat-spectrum sources in the AT20G-6dFGS sample are affected by relativistic beaming. We showed in §6.2.1 that the minimum beamed fraction is around 6%, so the overall fraction of relativistically-beamed sources within the flat-spectrum population is within the range 6–35%. More detailed VLBI and variability studies are needed to refine this further. Based on the evidence available so far, however, we conclude that at least two-thirds of the flat-spectrum sources in the AT20G-6dFGS sample are likely to be genuinely compact radio galaxies rather than low-power BL Lac objects.
6.3 WISE colours and radio morphology
Figure 13 shows a WISE colour-colour plot similar to that in Figures 9 and 11, but now split by radio morphology into the FR-0, FR-1 and FR-2 classes defined in Table 9.
This plot shows a remarkable split in the mid-infrared colours of FR-1 and FR2 hosts, at mag. For the 59 FR-1 and FR-2 galaxies with reliable WISE photometry available:
-
•
93% (41/44) of the FR-1 hosts have mag,
-
•
93% (14/15) of the FR-2 hosts have mag).
In other words, there is a near-complete dichotomy between the host galaxies of our FR-1 and FR-2 radio sources, with FR-1 sources being found almost exclusively in WISE ‘early-type’ galaxies and FR-2 sources in WISE ‘late-type’ galaxies.
This provides strong evidence that the host galaxies of FR-1 and FR-2 radio sources are drawn from different galaxy populations. This is further supported by our earlier finding (§6.1.1 and Table 9) that the host galaxies of FR-1 radio sources are typically more massive than the FR-2 hosts.
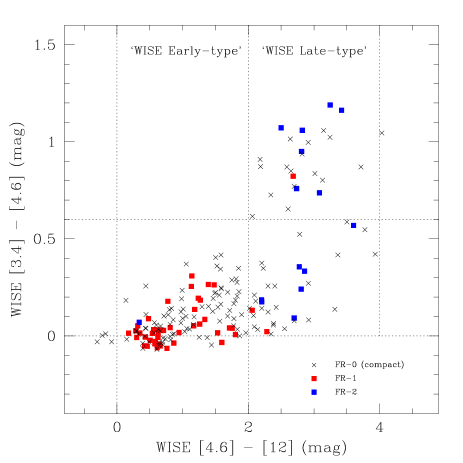
6.4 An overall picture of the local radio-source population
We now attempt to interpret the results presented so far in terms of an overall picture of the local radio-source population at 20 GHz.
We first assume that the distinction between high-excitation radio galaxies (HERGs), which have a radiatively-efficient accretion disk surrounding the black hole, and low-excitation galaxies (LERGs), in which accretion is radiatively inefficient, is an important one.
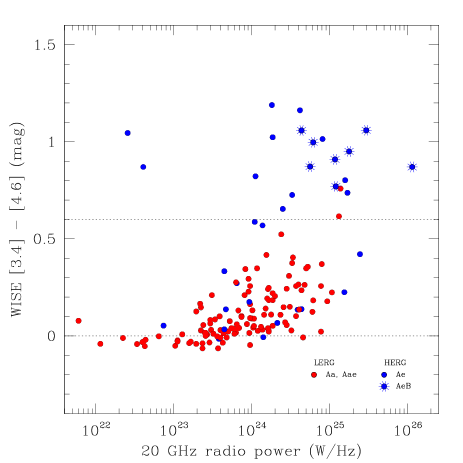
Figure 14 provides some support for this. As noted by Stern et al. (2012), the WISE m colour allows us to distinguish the power-law spectrum of a radiatively-efficient AGN from the blackbody stellar spectrum of a normal galaxy (which peaks near m) in a way which is largely immune from the effects of dust extinction. Almost all the LERGs in our sample lie below the line at mag. which separates normal galaxies from radiatively-efficient AGN (Wright et al. 2010), while most of the HERGs lie above this line. The clear separation of the blue and red points in Figure 14 implies that the spectroscopic classification discussed in §2.3 has allowed us to separate the two classes in a reliable way.
Figure 14 also shows that for low-excitation objects with 20 GHz radio powers above about W Hz-1, the median WISE m colour moves to higher values as the 20 GHz radio power increases. Since there is no correlation between MK and colour for the AT20G-6dFGS galaxies, this implies that we may be seeing the weak signature of a radiative AGN in the more powerful LERGs in our sample.
We can now split our sample into low-excitation and high-excitation populations, as summarized in Table 12.
| Class | N | Host galaxies | Radio spectral |
|---|---|---|---|
| index | |||
| Low-excitation populations | |||
| FR-0, LERG | 78 | WISE early-type and late-type | 67% flat, 33% steep |
| FR-1, LERG | 40 | Mainly WISE early-type | Steep |
| FR-2, LERG | 5 | Mainly WISE late-type | Steep |
| High-excitation populations | |||
| FR-0, HERG | 26 | Mainly WISE late-type | 50% flat, 50% steep |
| FR-2, HERG | 9 | WISE late-type | Steep |
The low-excitation systems (LERGs) in Table 12 span the full range of radio morphologies (FR-0, FR-1 and FR-2). The compact (FR-0) sources are seen across a wide range of host galaxy morphology, spanning both WISE ‘early-type’ and WISE ‘late-type’ galaxies. However, the radio sources which show extended radio emission at 1 GHz (which we assume are the longer-lived counterparts of some of the FR-0 objects) are generally seen as FR-1 radio galaxies if their host is a ‘WISE early-type’ galaxy and (low-excitation) FR-2 radio galaxies if their host is a ‘WISE late-type’ galaxy.
This strongly suggests that some factor related to the host-galaxy morphology or large-scale environment, rather than the accretion rate alone, determines whether a young radio source undergoing radiatively-inefficient accretion evolves into an extended FR-1 radio galaxy or an FR-2 system.
The high-excitation systems (HERGs) in Table 12 are a minority population in the AT20G-6dFGS sample, and their interpretation appears more straightforward. Here we see only compact FR-0 and extended FR-2 systems, suggesting that compact radio sources with radiatively-efficient accretion disks are likely to evolve into FR-2 radio galaxies rather than FR-1 systems.
6.5 Two radio-galaxy populations?
The concept of a dual radio-source population in which the two populations undergo different cosmic evolution is a long-standing one, and is essential to explain the observed radio source counts (Longair 1966). Several alternative models have been proposed for these two populations, as discussed in a recent review by De Zotti et al. (2010).
Dunlop & Peacock (1990) developed a model in which radio luminosity was the key parameter, with luminous radio sources undergoing rapid cosmic evolution while sources below some critical radio luminosity evolve more slowly or not at all. Wall (1980) identified the two populations with FR-1 and FR-2 radio galaxies, a model which was later extended by Jackson & Wall (1999) to include flat-spectrum sources as the beamed counterparts of the steep-spectrum FR-1 and FR-2 sources. Willott et al. (2001) used emission-line strength rather than the FR-1/2 classification to define the two populations. All these models were developed at a time when the local radio-source population was still poorly studied and the local radio luminosity function poorly determined, making it difficult to carry out a detailed comparison with the data. De Zotti et al. (2010) note that the possible dichotomies between evolutionary properties of low- versus high-luminosity and of flat- versus steep- spectrum AGN-powered radio sources remain an unresolved question.
More recently, and using a much larger data set, Best & Heckman (2012) have proposed a picture in which HERGs and LERGs constitute the two radio-source populations, with the observed redshift evolution of the radio luminosity function being driven at least partly by changes in the relative contribution of these two populations. In this picture, the key discriminant is the accretion rate onto the central black hole, with HERGs typically having accretion rates of 1–10 per cent of the Eddington rate and LERGs generally accreting at a rate below one per cent Eddington. These authors find that HERGs and LERGs show different rates of cosmic evolution at a fixed radio luminosity, with HERGs evolving strongly with redshift while LERGs show weak or no evolution. They also identify LERGs with galaxies undergoing ‘radio-mode feedback’, which acts to suppress further star formation (Croton et al. 2006), and HERGs with ‘quasar-mode’ systems fuelled by the infall of cold gas, which may still have ongoing star formation.
Our results are in broad agreement with the Best & Heckman (2012) picture. We find a clear distinction between the host galaxies of FR-1 and FR-2 galaxies in our sample, with the FR-1 objects lying almost exclusively in ‘WISE early-type’ galaxies and the FR-2 objects in ‘WISE late-type’ galaxies. This implies that the host galaxy and its surrounding environment play an important role in the determining the overall properties of an individual radio galaxy, as has already been recognised by others (Heckman et al. 1986; Baum et al. 1995; Saripalli 2012; Ramos Almeida et al. 2012; Best & Heckman 2012). We also see a fairly clear distinction between the optical spectra of the two classes, with 98% of the FR-1 radio galaxies in our sample having LERG spectra while the majority (64%) of our FR-2 radio galaxies are HERGs.
As in earlier studies, however, we see a substantial population of FR-2 radio galaxies with LERG optical spectra. As Table 12 shows, the radio galaxies in our sample fall into five (rather than two or three) distinct sub-populations once we take into account the host-galaxy type, radio morphology and observed optical spectrum/accretion mode. If we also take into account that (as discussed in §6.2) the flat-spectrum FR-0 sources include a small subset of beamed objects, then the number of potential sub-populations is further increased.
If the Best & Heckman (2012) model is correct, then it should be possible to fit all these sub-populations into a dual-population model with one rapidly-evolving and one slowly-evolving (or non-evolving) radio-source population. To do this, we would need to know how each of the sub-populations in Table 12 evolves with redshift. Such a test is clearly beyond the scope of the current paper, but would be interesting to carry out with a larger sample spanning a wider range in redshift.
7 Summary and future work
We have carried out the first detailed study of the high-frequency radio-source population in the local universe. By selecting our sample at 20 GHz, rather than at 1.4 GHz as most other recent studies have done, we select galaxies based on the recent radio emission from their central regions rather than the longer-lived extended emission from their jets and lobes (which reflects the activity of the central black hole on longer timescales of up to 10 years).
We now summarize the main results from this study, and highlight a number of areas
where follow-up work would be particularly useful. Some follow-up work is already in
progress, in particular a study of associated 21 cm HI absorption in compact sources from
the AT20G-6dFGS sample (Allison et al. 2012).
(i) Compact ‘FR-0’ radio galaxies are the dominant source population in the AT20G-6dFGS galaxy sample. These compact FR-0 sources are a heterogeneous population in terms of both host-galaxy morphology (75% in early-type galaxies, 25% in star-forming galaxies) and optical spectra (75% LERG; 25% HERG).
Their observed properties are consistent with them being a mixture of several kinds of objects. Some of the weaker flat-spectrum sources in our sample, like NGC 1052 and NGC 4594 (which have 20 GHz radio power below 1023 W Hz-1), are known to be less than a few parsecs in size (e.g. Slee et al. 1994; Sadler et al. 1995) and strongly affected by absorption. These low-luminosity sources could plausibly be maintained over much of the life of the host galaxy, and need not necessarily be young. The FR-0 class is also likely to contain young Compact Steep-Spectrum (CSS) and Gigahertz-Peaked Spectrum (GPS) radio sources, as well as a minority population of beamed radio sources.
Since the FR-0 objects make up around 70-75% of the AT20G-6dFGS sources at all radio powers between about 1022 and 1026 W Hz-1 it seems unlikely that all of them can grow into long-lived FR-1 or FR-2 radio galaxies. Instead, it seems likely that many of the FR-0 sources have short duty cycles, so that they switch on and off regularly but are never ‘on’ for long enough to drive large-scale jets and lobes (e.g. Conway 2002).
A more detailed study of these objects would be very interesting, since they are likely to contain the largest and most complete sample of candidate CSS and GPS radio sources in the local universe.
Such a study would ideally include detailed measurements of the radio spectrum
over at least the range 1–20 GHz, to determine the spectral shape and peak frequency;
detailed 1.4 GHz imaging to search for low surface-brightness jets and lobes
which may lie below the limits of current large-area surveys; and high-resolution
VLBI imaging to examine the parsec-scale source structure and look for evidence of
long-term expansion or motion.
While it appears that no more than 30–35% of the compact flat-spectrum sources
in our sample are brightened by relativistic beaming, it would clearly be valuable
to quantify this more accurately.
(ii) We find a roughly-equal mixture of flat-spectrum and steep-spectrum
radio galaxies in our sample.
The classical FR-1 and FR-2 radio galaxies in our sample have steep ()
radio spectral indices due to the extended low-frequency emission from
their jets and lobes. The compact (FR-0)
sources include both flat-spectrum () and steep-spectrum sources,
and we see no correlation between radio spectral index and radio luminosity or
host-galaxy morphology. We therefore conclude that flat-spectrum and steep-spectrum
sources in our sample are not drawn from different parent-galaxy populations,
but instead are likely to represent different evolutionary stages of the overall radio-galaxy
population.
(iii) The FR-1 and FR-2 radio sources in our sample lie in different kinds of host galaxies.
Mid-infrared photometry from WISE (Wright et al. 2010; Donoso et al. 2012)
shows that the host galaxies of the FR-1 and FR-2 galaxies in our sample are very different,
with the FR-1 sources found almost exclusively in early-type galaxies and the FR-2 sources in late-type
galaxies with dust and/or ongoing star formation.
At 20 GHz, we also find that FR-2 radio sources are more powerful (typically by
almost an order of magnitude in 20 GHz radio luminosity) than the FR-1 radio sources
in galaxies of similar stellar mass. The dividing line seen by Ledlow & Owen
(1996) at 1.4 GHz also divides the FR-1 and FR-2 populations reasonably well
at 20 GHz if shifted appropriately in radio spectral index and (R-K) colour.
(iv) Galaxies with optical emission lines are more common in our 20 GHz-selected
sample than in a similar radio-galaxy sample selected at 1.4 GHz.
HERG sources with strong optical emission lines make up of the
AT20G-6dFGS sample, a significantly higher fraction than the 10-13%
seen in the lower-frequency 6dFGS-NVSS (Mauch & Sadler 2007) sample.
The HERG fraction is similar for flat-spectrum and steep-spectrum
sources in the AT20G-6dFGS sample,
but within the LERG population, weak optical emission-lines
(class Aae) are much more common in galaxies which host flat-spectrum radio sources.
The reason for the observed correlation between emission-line fraction and radio
spectral index is not yet clear, and a more detailed study of the interstellar
medium in these sources is needed to investigate whether the difference is
mainly due to shock ionization of circumnuclear gas (Dopita et al. 1997),
free-free absorption in the most compact sources (Kameno et al. 2005)
or some other mechanism.
(v) Around 30% of the AT20G-6dFGS radio galaxies are late-type, dusty or star-forming galaxies.
Although most of the radio-loud AGN in the AT20G-6dFGS sample are are hosted by massive early-type
galaxies, both the catalogued optical morphology (where available) and the WISE infrared colours
imply that of the host galaxies are spirals or
other dusty, late-type galaxies with some ongoing star-formation. This is very similar to the
fraction of powerful 3CRR and 2Jy radio galaxies which were found by Dicken et al. (2012)
to show ongoing star formation, based on the detection of infrared polycyclic aromatic hydrocarbon (PAH)
spectral features.
Finally, we note that the increased continuum sensitivity now provided routinely by new wide-band correlators on large radio interferometers, including the Compact Array Broadband Backend correlator (CABB; Wilson et al. 2011) on the Australia Telescope Compact Array and the Wideband Interferometric Digital ARchitecture (WIDAR) correlator on the Jansky Very Large Array will make it far easier to carry out high-frequency and multi-frequency radio studies of large galaxy samples in the future. One goal of this paper is to give some idea of what these studies might discover, and how they might help to improve our understanding of the complex physical processes which shape the formation and evolution of radio galaxies.
8 Acknowledgements
We thank our colleagues in the AT20G and 6dFGS survey teams, who carried
out the surveys which underpin much of the work presented here.
We are also grateful to Tom Jarrett for several useful discussions on the WISE infrared data.
We acknowledge financial support from the Australian Research Council through
the award of an ARC Australian Professorial Fellowship to EMS.
This research has made use of the NASA/IPAC Extragalactic Database (NED) which
is operated by the Jet Propulsion Laboratory, California Institute of Technology,
under contract with the National Aeronautics and Space Administration.
References
- [1] Abdo A.A. et al., 2010, ApJ, 709, L152
- [2] Allison, J. R., Curran, S. J., Emonts, B. H. C., Gereb, K., Mahony, E. K., Reeves, S., Sadler, E. M., Tanna, A., Whiting, M. T., Zwaan, M. A., 2012, MNRAS 423, 2601
- [3] Allison, J. R., Curran, S. J., Sadler, E. M., Reeves, S. N., 2013, MNRAS 430, 157
- [4] Arp, H., 1966, ApJS, 14, 1
- [5] Assef, R. J. et al., 2010, ApJ, 713, 970
- [6] Auriemma C., Perola G. C., Ekers R. D., Fanti R., Lari C., Jaffe W.J., Ulrich M.-H., 1977, A&A, 57, 41
- [7] Baldi, R. D., Capetti, A., 2009, A&A, 508, 603
- [8] Bauer, F.E., Condon, J.J., Thuan, T.X., Broderick, J.J., 2000, ApJS, 129, 547
- [9] Baum S.A., Heckman T., Bridle, A., van Breugel W., Miley G., 1988, ApJS, 68, 643
- [10] Baum, S. A., Zirbel, E. L., O’Dea, C. P., 1995, ApJ, 451, 88
- [11] Bell, M. E. et al., 2011, MNRAS, 411, 402
- [12] Bertelli, G., Chiosi, C., Bertola, F., 1989, ApJ, 339, 889
- [13] Bertola, F., Bettoni, D., Danziger, J., Sadler, E., Sparke, L., de Zeeuw, T., 1991, ApJ, 373, 369
- [14] Best P.N., Kauffmann G., Heckman T.M., Ivezic Z., 2005a, MNRAS, 362, 9
- [15] Best P.N., Kauffmann G.. Heckman, T.M., Brinchmann, J., Charlot, S.. Ivezic, Z., White, S.D.M., 2005b, MNRAS, 362, 25
- [16] Best, P. N., Heckman, T. M., 2012, MNRAS, 421, 1569
- [17] Birkinshaw, M., Davies, R. L., 1985, ApJ, 291, 32
- [18] Bock, D.C-J., Large, M.I., Sadler, E.M. 1999, AJ, 117, 1593
- [19] Bonaldi, A., Bonavera, L., Massardi, M., De Zotti, G., 2013, MNRAS, 428, 1845
- [20] Buchanan C.L., McGregor P.J., Bicknell G.V., Dopita M.A., 2006, AJ, 132, 27
- [21] Burgess A.M., Hunstead R.W., 2006, AJ, 131, 100
- [22] Burke-Spolaor, S., Ekers, R. D., Massardi, M., Murphy, T., Partridge, B., Ricci, R., Sadler, E. M., 2009, MNRAS, 395, 504
- [23] Burns J.O., Feigelson E.D., Schreier E.J.; 1983, ApJ, 273, 128
- [24] Cara, M., Lister, M.L., 2008, ApJ, 674, 111
- [25] Carini, M.T, Miler, H.R., Noble, J.C., Sadun, A.C., 1991, AJ, 101, 1196
- [26] Cappellari, M., Verolme, E. K., van der Marel, R. P., Verdoes Kleijn, G. A., Illingworth, G. D., Franx, M., Carollo, C. M., de Zeeuw, P. T., 2002, ApJ, 578, 787
- [27] Carter D., Efstathiou G., Ellis R.S., Inglis I., Godwin J., 1981, MNRAS, 195, 15P
- [28] Chen, X., Rachen, J. P., L pez-Caniego, M., Dickinson, C., Pearson, T. J., Fuhrmann, L., Krichbaum, T. P., Partridge, B., 2013, A&A, 553, 107
- [29] Chhetri, R., Ekers, R. D., Mahony, E. K., Jones, P. A., Massardi, M., Ricci, R., Sadler, E. M., 2012, MNRAS, 422, 2274
- [30] Christlein, D., Zabludoff, A.I., 2003, ApJ, 591, 764
- [31] Cid Fernandes, R., Stasinska, G., Mateus, A., Vale Asari, N., 2011, MNRAS, 413, 1687
- [32] Condon J. J., 1989, ApJ, 338, 13
- [33] Condon, J. J., Cotton, W. D., Greisen, E. W., Yin, Q. F., Perley, R. A., Taylor, G. B., Broderick, J. J., 1998, AJ, 115, 1693
- [34] Condon J. J., Cotton W. D., Broderick J. J., 2002, AJ, 124, 675
- [35] Conway, J. E., 2002, New Astronomy Reviews, 46, 263
- [36] Crawford, C.S., Fabian, A.C., 1994, MNRAS, 266, 669
- [37] Croton, D. et al., 2006, MNRAS, 365, 11
- [38] Danziger I. J., Fosbury R. A. E., Boksenberg A., Goss W. M., Bland J., 1984, MNRAS, 208, 589
- [39] De Breuck, C., van Breugel, W., Stanford, S. A., Röttgering, H., Miley, G., Stern, D., 2002, AJ, 123, 637
- [40] de Vaucouleurs, G., de Vaucouleurs, A., Corwin, H. G., Jr., Buta, R. J., Paturel, G., Fouque;, P., 1991, Third Reference Catalogue of Bright Galaxies (RC3). Springer, New York, NY (USA),
- [41] De Zotti G., Ricci R., Mesa D., Silva L., Mazzotta P., Toffolatti L., Gonzalez–Nuevo J., 2005, A&A. 431, 893
- [42] De Zotti G., Massardi M., Negrello M., Wall J., 2010, A&ARev, 18, 1
- [43] Dicken, D., Tadhunter, C., Axon, D., Morganti, R., Robinson, A., Kouwenhoven, M. B. N., Spoon, H., Kharb, P., Inskip, K. J., Holt, J., Ramos Almeida, C., Nesvadba, N. P. H., 2012, ApJ, 745, 172
- [44] di Serego-Alighieri, S., Danziger, I. J., Morganti, R., Tadhunter, C. N., 1994, MNRAS, 269, 998
- [45] Donoso, E. et al., 2012, ApJ. 748, 80
- [46] Dopita, M.A., Koratkar, A.P., Allen, M.G., Tsvetanov, Z.I., Ford, H.C., Bicknell, G.V., Sutherland, R.S., 1997. ApJ, 490, 202
- [47] Drake, C. L., McGregor, P. J., Dopita, M. A., van Breugel, W. J. M., 2003, AJ, 126, 2237
- [48] Drake, C. L., McGregor, P. J., Dopita, M. A., 2004, AJ, 128, 955
- [49] Dunlop, J. S., Peacock, J. A., 1990, MNRAS, 247, 19
- [50] Ekers, R. D., 1969, Aust. J. Phys. Suppl., 6, 3
- [51] Ekers, R. D., Fanti, R., Miley, G. K., 1983, A&A, 120, 297
- [52] Ekers, R. D., Goss, W. M., Kotanyi, C. G., Skellern, D. J., 1978, A&A, 69, L21
- [53] Eracleous M., Halpern J.P., 1994, ApJS, 90, 1
- [54] Fanaroff, B.L., Riley, J.M., 1974, MNRAS, 167, 31
- [55] Fanti, R., Fanti, C., Schilizzi, R.T., Spencer, R.E., Nan R., Parma, P., van Breugel, W.J.M., Venturi, T., 1990, A&A, 231, 333
- [56] Franx, M., Illingworth, G. D., 1988, ApJ, 327, L55
- [57] Gardner F.F., Whiteoak J.B., Norris R.P., Diamond P.J., 1992, MNRAS, 258, 296
- [58] Ghisellini, G., 2011, American Institute of Physics Conference Series, 1381, 180
- [59] Gregorini, L., de Ruiter, H. R., Parma, P., Sadler, E. M., Vettolani, G., Ekers, R. D., 1994, A&AS, 106, 1
- [60] Gregory, P. C., Vavasour, J. D., Scott, W. K., Condon, J. J., 1994, ApJS, 90, 173
- [61] Grimberg B. I., Sadler E. M., Simkin S. M., 1999, ApJ, 521, 121
- [62] Hagiwara Y., Kohno K., Kawabe R., Nakai N., 1997, PASJ, 49, 171
- [63] Hancock, P. J., 2009, Astronomische Nachrichten, 330, 180
- [64] Hancock, P. J., Sadler, E. M., Mahony, E. K., Ricci, R., 2010, MNRAS, 408, 1187
- [65] Hardcastle, M. J., Alexander, P., Pooley, G. G., Riley, J. M., 1998, MNRAS, 296, 445
- [66] Hardcastle, M. J., Alexander, P., Pooley, G. G., Riley, J. M., 1999, MNRAS, 304, 135
- [67] Hardcastle, M. J., 2004, A&A, 414, 927
- [68] Hardcastle, M. J., Evans, D. A., Croston, J. H., 2007, MNRAS, 376, 1849
- [69] Hardcastle, M. J. et al., 2013, MNRAS, 429, 2407
- [70] Heckman, T. M., 1980, A&A, 87, 152
- [71] Heckman, T. M., Smith, E. P., Baum, S. A., van Breugel, W. J. M., Miley, G.K., Illingworth, G. D., Bothun, G. D., Balick, B., 1986, ApJ, 311, 526
- [72] Hota, A. et al., 2011, MNRAS, 417, L36
- [73] Hovatta, T., Tornikoski, M., Lainela, M., Lehto, H. J., Valtaoja, E., Torniainen, I., Aller, M. F., Aller, H. D., 2007, A&A, 469, 899
- [74] Ishwara-Chandra, C. H., Saikia, D. J., 1999, MNRAS, 309, 100
- [75] Jackson, C.A., Wall, J.V., 1999, MNRAS, 304, 160
- [76] Jackson, C. A., Wall, J. V., Shaver, P. A., Kellermann, K. I., Hook, I. M., Hawkins, M. R. S., 2002, A&A, 386, 97
- [77] Jarrett, T.H. et al., 2000, AJ, 120, 298
- [78] Johnston H. M., Hunstead R. W., Cotter G., Sadler E. M., 2005, MNRAS, 356, 515
- [79] Jones, D.H. et al., 2004, MNRAS, 355, 747
- [80] Jones, D.H. et al., 2009, MNRAS, 399, 683
- [81] Jones, P. A., McAdam, W. B., 1992, ApJS, 80, 137
- [82] Kameno, S., Sawada-Satoh, S., Inoue, M., Shen, Z.-Q., Wajima, K., 2001, PASJ, 53, 169
- [83] Keel, W. C., White, R. E., Owen, F. N., Ledlow, M. J., 2006, AJ, 132, 2233
- [84] Kewley, L. J., Groves, B., Kauffmann, G., Heckman, T., 2006, MMRAS,372, 961
- [85] Killeen, N.E.B., Bicknell, G.V., Ekers, R.D., 1986, ApJ, 302, 306
- [86] Kimball, A. E., Ivezic, Z., 2008, AJ, 136, 684
- [87] Kollgaard, R. I., Feigelson, E. D., Laurent-Muehleisen, S. A., Spinrad, H., Dey, A., Brinkmann, W., ApJ, 449, 61
- [88] Large, M. I., Mills, B. Y., Little, A. G., Crawford, D. F., Sutton, J. M., 1981, MNRAS, 194, 693
- [89] Lauberts, A., 1982, ESO/Uppsala survey of the ESO(B) atlas. European Southern Observatory, Garching
- [90] Ledlow M.J., Owen F.N., 1996, AJ, 112, 9
- [91] Ledlow M.J., Owen F.N., Keel W.C., 1998, ApJ, 495, 227
- [92] Ledlow M.J., Owen F.N., Yun M.S., Hill J.M., 2001, ApJ, 552, 120
- [93] Lenc, E., Tingay, S.J., 2006, AJ, 132, 1333
- [94] Lilly, S. J., Longair, M. S., 1984, MNRAS, 211, 833
- [95] Lilly, S. J., Prestage, R. M., 1987, MNRAS, 225, 531
- [96] Longair, M.S. 1966, MNRAS, 133, 421
- [97] Machacek, M. E., O’Sullivan, E., Randall, S. W., Jones, C., Forman, W. R., 2010, ApJ, 711, 1316
- [98] Mahony, E. K. et al., 2011, MNRAS, 417, 2651
- [99] Marcha, M.J.M., Browne, I..W.A., Jethava, N., Anton, S., 2005, MNRAS 361, 469
- [100] Marcha, M.J.M., Caccianiga, A. 2013, MNRAS, 430, 2464
- [101] Marshall, H. L. et al., 2005, ApJS, 156, 13
- [102] Massardi, M. et al., 2008, MNRAS, 384, 775
- [103] Massardi, M. et al., 2011a, MNRAS, 412, 318
- [104] Massardi, M. et al., 2011b, MNRAS, 415, 1597
- [105] Massaro, E., Giommi, P., Leto, C., Marchegiani, P., Maselli, A., Perri, M., Piranomonte, S., Sclavi, S., 2009, A&A, 495, 691
- [106] Massaro, F., D’Abrusco, R., Tosti, G., Ajello, M., Gasparrini, D., Grindlay, J.E., Smith, H.A., 2012, ApJ 750, 138
- [107] Mauch T., Murphy T., Buttery H.J., Curran J., Hunstead R.W., Piestrzynski B., Robertson J.G., Sadler E.M., 2003, MNRAS, 342, 1117
- [108] Mauch T., Sadler E.M., 2007, MNRAS 375, 931
- [109] McAdam, W. B., White, G. L., Bunton, J. D., 1988, MNRAS, 235, 425
- [110] McConnell, D., Sadler, E. M., Murphy, T., Ekers, R.D., 2012, MNRAS, 422, 1527
- [111] Morganti R., Killeen N.E.B., Tadhunter C.N., 1993, MNRAS 263, 1023
- [112] Morganti R., Oosterloo T., Tadhunter C. N., Aiudi R., Jones P., Villar-Martin M., 1999, A&AS, 140, 355
- [113] Morganti, R., Holt, J., Tadhunter, C., Ramos Almeida, C., Dicken, D., Inskip, K., Oosterloo, T., Tzioumis, T., 2011, A&A, 535, 97
- [114] Morganti, R., Frieswijk, W., Oonk, R. J. B., Oosterloo, T., Tadhunter, C., 2013, A&A, 552, L4
- [115] Murphy, T. et al., 2010, MNRAS, 402, 2403
- [116] Nieppola, E., Tornikoski, M., Valtaoja, E., 2006, A&A 445, 441
- [117] Norris, R. P., Allen, D. A., Roche, P. F., 1988, MNRAS, 234, 773
- [118] O’Dea, C.P., 1998, PASP, 110, 493
- [119] O’Dea, C.P., Owen, F.N., 1985, AJ, 90, 954
- [120] Oosterloo, T. A., Morganti, R., Sadler, E. M., van der Hulst, T., Serra, P., 2007, A&A, 465, 787
- [121] Owen, F. N., Laing, R. A., 1989, MNRAS, 238, 357
- [122] Owen, F. N., Ledlow, M. J., 1997, ApJS, 108, 41
- [123] Padovani, P., Urry, C.M., 1992, ApJ, 387, 449
- [124] Perley R.A., Roeser H.-J., Meisenheimer K., 1997, A&A. 328, 12
- [125] Phillips, M. M., Jenkins, C. R., Dopita, M. A., Sadler, E. M., Binette, L., 1986, AJ, 91, 1062
- [126] Pihlström Y. M., Conway J. E., Booth R. S., Diamond P. J., Koribalski B. S., 2000, A&A, 357, 7
- [127] Raimann, D., Storchi-Bergmann, T., Quintana, H., Hunstead, R., Wisotzki, L., 2005, MNRAS, 364, 1239
- [128] Ramos Almeida, C. et al., 2012, MNRAS, 419, 687
- [129] Ricci R. et al., 2004a, MNRAS, 354, 305
- [130] Ricci R., Prandoni I., Gruppioni C., Sault R.J., De Zotti G., 2004b, A&A, 415, 549
- [131] Ricci, R., Prandoni, I., Gruppioni, C., Sault, R. J., de Zotti, G., 2006, A&A, 445, 465
- [132] Roberts, M.D. et al., 1998, A&A, 337, 25
- [133] Sadler E.M., Slee, O.B., Reynolds, J.E., Roy, A.L., 1995, MNRAS, 276, 1373
- [134] Sadler, E. M., McIntyre, V. J., Jackson, C. A., Cannon, R. D., 1999, PASA, 16, 247
- [135] Sadler E.M. et al. 2002, MNRAS, 329, 227
- [136] Sadler, E. M. et al., 2006, MNRAS, 371, 898
- [137] Saripalli, L., 2012, AJ, 144, 85
- [138] Serra, P., Oosterloo, T. A., 2010, MNRAS, 401, L29
- [139] Schmidt, M. 1968, ApJ, 151, 393
- [140] Slee, O. B., Sadler, E. M., Reynolds, J. E., Ekers, R. D., 1994, MNRAS, 269, 928
- [141] Smith, R.M., Bicknell, G.V., 1986, ApJ, 308, 36
- [142] Snellen, I.A.G. et al. 2000, MNRAS, 319, 445
- [143] Simpson C., Clements D.L., Rawlings S., Ward M., 1993, MNRAS, 262, 889
- [144] Stanghellini, C., O’Dea, C. P., Baum, S. A., Dallacasa, D., Fanti, R., Fanti, C., 1997, A&A, 325, 943
- [145] Stern, D. et al., 2012, ApJ, 753, 30
- [146] Subrahmanyan R., Saripalli L., Hunstead R.W., 1996, MNRAS, 279, 257
- [147] Tadhunter C. N., Morganti R., di Serego-Alighieri S., Fosbury R. A. E., Danziger I. J., 1993, MNRAS, 263, 999
- [148] Taylor, G. B., Sanders, J. S., Fabian, A. C., Allen, S. W., 2006, MNRAS, 365, 705
- [149] Tingay S.J., 1997, A&A, 327, 550
- [150] Tingay, S. J., Edwards, P. G., Tzioumis, A. K., 2003, MNRAS, 346, 327
- [151] Tingay S.J., 2004, AJ, 127, 10
- [152] Tzioumis, A. et al., 2002, A&A 392, 841
- [153] Ulvestad J.S., Antonucci R.J., 1997, ApJ, 488, 621
- [154] Urry, C.M., Padovani,P., 1995, PASP, 107, 803
- [155] Vermeulen, R. C., Ros, E., Kellermann, K. I., Cohen, M. H., Zensus, J. A., van Langevelde, H. J., 2003, PASA, 20, 65
- [156] Veron-Cetty, M. P., Veron, P., 1988, A&A, 204, 28
- [157] Veron-Cetty, M. P., Veron, P., 2001, A&A, 375, 791
- [158] Veron-Cetty, M.-P., Woltjer, L., Ekers, R. D., Staveley-Smith, L., 1995, A&A, 297, L79
- [159] Wall, J. V., 1980, Royal Soc. Phil. Trans. A, 296, 367
- [160] Willott, C.J., Rawlings, S., Jarvis, M.J., Blundell, K.M., MNRAS, 2003, 339, 173
- [161] Wilman, R.J. et al., 2008, MNRAS, 388, 1355
- [162] Wilson, W. E. et al., 2011, MNRAS, 416, 832
- [163] Wright, E. L. et al., 2010, AJ, 140, 1868
- [164] Yan, L. et al., 2013, AJ, 145, 55
- [165] Zirbel, E.L., Baum, S.A., 1995, A&A, 448, 521
Appendix A Notes on individual sources
J000311-544516 (PKS 0000-550)
The radio source is resolved into a 1 arcmin double at 20 GHz (see Figure 15),
and the catalogued AT20G position corresponds to the southern hotspot.
No core is seen in the 20 GHz image, though a faint core is visible at
5 and 8 GHz. The source is only slightly resolved in the lower-frequency SUMSS
image, with a largest angular size of 50 arcsec.
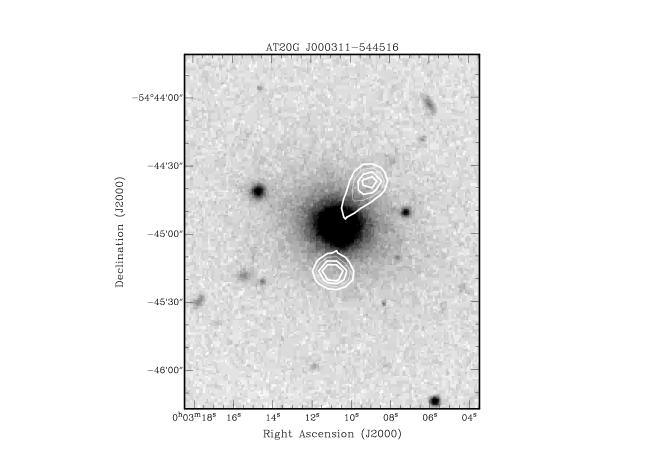
J000413-525458 (PKS 0001-531)
This resolved 20 GHz source is the core of a wide (6 arcmin) triple
source at low frequency, and the 843 MHz flux density listed in Table 3
is the sum of three SUMSS components. The AT20G images show a single source
with an extension to the north-west in the direction of the northern low–frequency radio lobe.
We tentatively classify this as an FR-1 radio galaxy based on the SUMSS image.
J001605-234352 (PKS 0013-240, ESO 473-G07)
This AT20G source is associated with the nucleus of a spiral galaxy.
Slee et al. (1994) detected a parsec–scale radio core with an 8.4 GHz
flux density of 60 mJy, suggesting that most of the observed 20 GHz
emission comes from a central AGN. Allison et al. (2012) detected
the 21cm HI line in absorption against the central continuum source.
J002736-540907
The optical spectrum shows only weak absorption lines, suggesting this is
a possible BL Lac object.
J002901-011341 (PKS 0026-014)
The 2dFGRS spectrum of this galaxy (TGS 819Z353) shows weak optical emission lines
on a strong stellar continuum (spectral type Aae).
J003704-010907 (3C 15, PKS 0034-01)
The AT20G source is the core of a well-studied FR-2 radio galaxy in the
2 Jy sample of Morganti et al. (1993).
The fractional linear polarization of 3.7% measured at 20 GHz is close
to the NVSS value of 4.1% at 1.4 GHz.
J004613-420700 and J004622-420842 (PKS 0043-42)
A well-studied FR-2 radio galaxy roughly 3 arcmin in angular size.
The hotspots are detected as two separate AT20G sources at 20 GHz
and are strongly polarized, with fractional linear polarizations of 7.4% and 17.9%
for the northern and southern hotspots respectively. The galaxy nucleus
is undetected at 20 GHz, implying a core flux density below 10-15 mJy.
There is no 6dFGS spectrum, but Morganti et al. (1999)
note that an optical spectrum shows only weak, low-ionization emission lines and
a stellar continuum typical of early-type galaxies. They remark that this
is an example of a powerful FR-2 radio galaxy with significantly
weaker emission lines that expected from the radio power–emission line
luminosity correlation. We adopt the redshift of published by
di Serego Alighieri et al. (1994).
J004733-251717 (NGC 253)
A well-studied nearby spiral galaxy in the Sculptor group. The galaxy hosts a
nuclear starburst as well as more extended star formation (Ulvestad & Antonucci 1997),
and has been detected as a gamma-ray source by the Fermi satellite (Abdo et al. 2010).
The radio source is extended in the AT20G image, and the listed AT20G flux density is
a lower limit to the total value. The flux density measured by WMAP at 23 GHz is 1.3 Jy.
NGC 253 is the closest galaxy (and lowest-luminosity 20 GHz source) detected in the AT20G survey.
Since no VLBI core component is detected (Sadler et al. 1995; Tingay 2004),
the observed 20 GHz emission probably arises from a compact nuclear starburst
rather than an AGN.
J005734-012328 (PKS 0055-01)
The AT20G source corresponds to the core of an FR-1 radio galaxy which
belongs to the 2 Jy sample of Morganti et al. (1993).
J012600-012041 (NGC 547)
The AT20G point source is associated with NGC 547, which lies in the cluster
Abell 194 and has a close companion galaxy NGC 545.
The low-frequency emission is 10 arcmin in extent
and is resolved into several components in NVSS. The 1.4 GHz
flux density listed in Table 3 is from Condon, Cotton & Broderick (2002).
Although this source is listed as a FR-2 radio galaxy in the 2 Jy sample of
Morganti et al. (1993), based on the original classification by O’Dea & Owen (1985),
more recent radio images suggest it should be reclassified as an FR-1 (Jackson
et al. 2002).
J013357-362935 (NGC 612)
This is a well-studied FR-2 radio galaxy in the 2 Jy sample of Morganti et al.
(1993). Ekers et al. (1978) noted that the host galaxy has a well-defined
disk, and this was the first-known example of a powerful radio galaxy in disk
galaxy. The 20 GHz radio emission extends over at least 6 arcmin,
as shown in the mosaic image made by Burke–Spolaor et al. (2009).
The 20 GHz flux density listed in Table 3 is also from Burke–Spolaor
et al. (2009), and is a lower limit to the total value since the source is
larger than the field imaged by these authors.
J021645-474908 (ESO 198-G01, PKS0̇214-48)
This is a resolved triple source at 20 GHz, with a total extent of 1.5 arcmin.
The catalogued AT20G position corresponds to the core. This object is classified as an FR-1
radio galaxy in the MS4 sample of Burgess & Hunstead (2006).
J023137-204021 (PKS 0229-208)
This AT20G source is the core of the radio galaxy PKS 0229-208, which
is an extended source (around 3 arcmin in extent) at low frequencies.
The NVSS flux density listed in Table 3 is for the central component
(as also listed by Mauch & Sadler 2007), and the extended emission at
1.4 GHz is split into at least six overlapping components in the NVSS
catalogue. We tentatively classify this as an FR-1 radio galaxy on the
basis of the NVSS image.
J024104-081520 (NGC 1052)
This is a nearby and well-studied elliptical galaxy with a double-sided VLBI radio jet
(Kameno et al. 2001). Tingay et al. (2003) identify NGC 1052 as a GPS radio source.
J024240-000046 (NGC 1068, PKS 0240-00)
NGC 1068 is a nearby spiral galaxy with a well-studied active nucleus.
The central radio source is resolved at 20 GHz.
J031552-190644 (PMN J0315-1906)
This galaxy has been studied in detail by Ledlow et al. (1998; 2001),
who identify it as a rare example of an FR-1 radio source in a spiral host
galaxy. Their 1.4 GHz VLA image shows a faint jet extending south-west from
the nucleus, and they also detect HI in absorption against the bright radio
core. Only the core component is seen in the AT20G image. Keel et al. (2006)
present HST and Chandra images of the host galaxy, noting that it has a
very luminous bulge. The WISE infrared colours ( mag;
mag) imply that this is a late-type galaxy which
probably hosts a radiatively-efficient accretion disk.
J034630-342246 (PKS 0344-34) This AT20G source is the core of a radio galaxy in the MS4 catalogue of Burgess & Hunstead (2006). The source has extended low-frequency emission, and is a 5 arcmin double in the 843 MHz SUMSS image. We classify this as an FR-2 radio galaxy on the basis of the low-frequency NVSS and SUMSS images. Raimann et al. (2005) note that the optical spectrum of this galaxy shows strong, narrow emission lines (class Ae).
J035145-274311 (PKS 0349-27)
The listed AT20G source is the northern hotspot of an FR-2 radio
galaxy (Morganti et al. 1993), and has a fractional polarization
of 24.8% at 20 GHz. The core and southern hotspot were not detected
in the AT20G survey. The galaxy has an extended optical emission-line
region with a disturbed velocity structure which may result from a
recent collision or merger (Danziger et al. 1984, Grimberg et al. 1999).
J035257-683117 (PKS 0352-686)
This source is core-dominated, and only slightly resolved in the 20 GHz image.
It is unresolved in the lower-frequency SUMSS image.
J042908-534940 (IC 2082, PKS 0427-53)
The AT20G source is the core of a head-tail or wide-angle tail FR-1 radio galaxy
(Ekers 1969; McAdam et al. 1988)
associated with a dumbbell galaxy (Carter et al. 1981) at the centre of a cluster.
This galaxy is also in the 2 Jy (Morganti et al. 1993) and MS4 (Burgess et al. 2006)
radio samples, and Raimann et al. (2005) note that its optical spectrum shows weak
optical emission lines (class Aae).
J043022-613201 (PKS 0429-61)
The AT20G source is centred on the 6dFGS galaxy, but is significantly offset from
the extended lower-frequency emission seen in the SUMSS image.
The galaxy is classified as FR-1 by Burgess & Hunstead (2006).
J045523-203409 (NGC 1692) This is a compact (30 arcsec) double at 20 GHz, with the emission probably arising from a pair of hotspots rather than a core. Tadhunter et al. (1993) note that no optical emission lines are detected in this galaxy and the continuum appears typical of early-type galaxies.
J050453-101451 (Arp 187, PKS 0502-10)
The radio source is associated with a disturbed or interacting galaxy listed in
the Arp (1966) Atlas of Peculiar Galaxies. Although the 20 GHz emission is flagged
as extended in the AT20G catalogue, it is unresolved by NVSS at 1.4 GHz.
J051949-454643, J051926-454554 and J052006-454745 (Pictor A, PKS 0518-45)
A well-studied FR-2 radio galaxy, imaged in detail at the VLA by Perley, Roeser & Meisenheimer
(1997). Three separately-catalogued AT20G sources correspond to the core and two hotspots.
The 20 GHz flux density listed in Tab;e 3 is from Burke-Spolaor et al. (2009).
The optical spectrum (Eracleous & Halpern 1994) shows strong, broad emission lines.
J054754-195805 (PKS 0545-199)
The AT20G source is resolved at 20 GHz, and the 1.4 GHz emission is also
extended. Zirbel & Baum (1995) identify this an FR-1 radio galaxy.
J055049-314428 (ESO 424-G27, PKS 0548-317)
This is a compact (30″separation) double in the AT20G image. The catalogued
AT20G position corresponds to one of two hotspots, rather than the core, and both hotspots
lie just beyond the optical galaxy. The lower-frequency NVSS source is only slightly
extended, with an angular size of about 20 arcsec in the NVSS catalogue.
J062143-524132 (PKS 0620-52)
This source is core-dominated but slightly resolved at 20 GHz. The low-frequency
emission seen in the SUMSS image is characteristic of a wide-angle tail (WAT)
source, and the galaxy is classified as an FR-1 by Morganti et al. (1993).
J062620-534151 (ESO 161-IG07, PKS 0625-53)
This AT20G source is a resolved double at 20 GHz, and is classified as an FR-1
radio galaxy in the 2 Jy (Morganti et al. 1993) and MS4 (Burgess et al. 2006)
samples. The optical ID is a dumbbell galaxy
at the centre of a cluster (Lilly & Prestage 1987; Gregorini et al. 1994).
The catalogued AT20G position is offset by about 15 arcsec from the optical
galaxy, and probably corresponds to the southern hotspot of a compact double, rather than the core.
J062648-543214 (PKS 0625-545)
This is a resolved triple source at 20 GHz, about 1.5 arcmin in extent.
The AT20G catalogue position corresponds to the northern hotspot,
but the core is also detected at 20 GHz.
J062706-352916 (PKS 0625-35)
This is the central galaxy of the cluster Abell 3392, and is
classified as an FR-1 radio galaxy by Morganti et al. (1993).
J063631-202857 and J063633-204239 (PKS 0634-20)
These two AT20G sources correspond to hotspots of a very extended (15 arcmin in
angular size) FR-2 radio galaxy. No core component is detected in the AT20G survey,
The host galaxy is well-studied at both optical and radio wavelengths, and a detailed
1.4 GHz image was made at the VLA by Baum et al. (1988). This object is classified
by Ishwara-Chandra & Saikia (1999) as a Giant Radio Galaxy, with the overall projected
size of the radio emission exceeding 1 Mpc.
J065153-602158 (PKS 0651-60)
The catalogued AT20G position appears to correspond to the northern hotspot of a 1 arcmin
double at 20 GHz. A second, fainter 20 GHz source is seen at the position of the optical galaxy.
The lower-frequency SUMSS emission extends over several arcmin, and we tentatively classify
this as an FR-1 radio galaxy based on the low-frequency morphology.
J065359-415144 (PKS 0652-417)
The 6dFGS DR3 catalogue lists the redshift of this galaxy as =0.00, based on (foreground)
Galactic nebular emission lines. We have remeasured the correct redshift as =0.0908, based
on the position of the Ca H and K absorption lines in the 6dFGS spectrum.
We tentatively classify this as an FR-1 radio galaxy on the basis of the
843 MHz SUMSS image, which shows extended jet-like emission.
J070240-284149 (NGC 2325)
This is a nearby and well-studied elliptical galaxy with a dust lane (Veron-Cetty & Veron 1988).
J070459-490459 (ESO 207-G19)
The SUMSS image shows extended low-frequency emission, from which we classify this as
an FR-1 radio galaxy.
J070914-360121 (PKS 0707-35)
The AT20G source is the core of a radio galaxy which has an extended ‘double-double’ structure
at low frequencies. The low-frequency emission has an FR-2 morphology extending over
about 8 arcmin on the sky. The source has been studied in detail by Subrahmanyan et al. (1996),
and is in the Ishwara-Chandra & Saikia (1999) sample of giant radio sources with
a projected size larger than 1 Mpc.
J080537-005819 (PKS 0803-00, 3C 193)
The 20 GHz emission extends over about 20-30 arcsec. The 1.4 GHz VLA image
made by Owen & Ledlow (1997) shows that this is a wide-angle tail (WAT) galaxy
in the cluster Abell 623. We classify this as an FR-1 radio galaxy based on the
1.4 GHz image.
J080852-102832 (PKS 0806-10, 3C195)
The catalogued AT20G source is the southern hotspot of an FR-2 radio galaxy
about 2.5 arcmin in extent (Morganti et al. 1993). The core and northern
hotspot were not detected in the AT20G survey. This galaxy is in the “radio-excess
IRAS galaxy” sample of Buchanan et al. (2006), who note that the optical spectrum shows
strong, narrow emission lines.
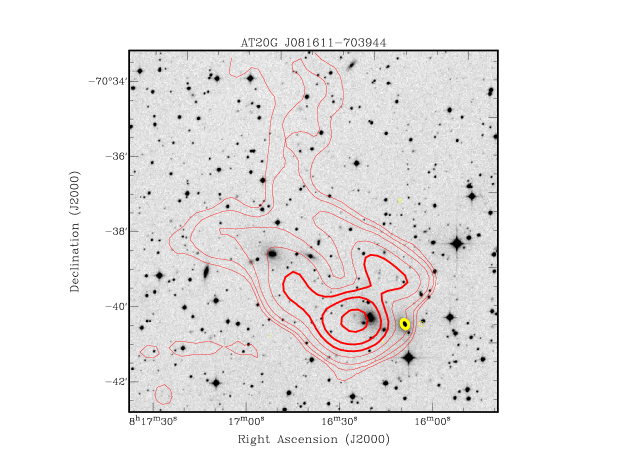
J081611-703944 (ESO 060-IG02, PKS 0816-705)
The AT20G source is centred on the 6dFGS galaxy g0816118-703945 at z=0.0333,
but is significantly offset from the centroid of the low-frequency
emission (see Figure16).
J084452-100059 (PMN J0844-1001) This galaxy has extended low-frequency emission in the 1.4 GHz NVSS image, and we tentatively classify it as an FR-1 radio galaxy.
J090802-095937 (PMN J0908-1000 )
This galaxy is listed as a BL Lac object by Nieppola et al. (2006),
and was also detected as a ROSAT X-ray source (Bauer et al. 2000).
The galaxy lies in an Abell cluster, and the NVSS image shows extended,
complex low-frequency emission. O’Dea & Owen (1985) classify this as a
narrow-angle tail radio source based on a higher-resolution 1.4 GHz
VLA image. We have classified it as an FR-1 radio galaxy based on
the extended low-frequency emission seen in the NVSS image.
J090825-093332 (PMN J0908-0933)
The 6dFGS spectrum looks almost featureless and is classified as poor-quality.
The listed redshift is taken from Christlein & Zabludoff (2003).
We tentatively classify this as an FR-1 radio galaxy based on the
morphology of the low-frequency emission seen in the NVSS image.
J091300-210320 (MRC 0910-208)
The 6dFGS spectrum shows weak absorption lines, and the galaxy is classified
as a possible BL Lac object by Massaro et al. (2009).
J091805-120532 (PKS 0915-11, 3C 218, Hydra A)
This is a well-studied FR-1 radio galaxy in the Hydra cluster,
and belongs to the 2-Jy sample of Morganti et al. (1993).
The AT20G source is a compact double, probably corresponding
to two inner hotspots rather than a core and jet.
J094110-120451 (MRC 0938-118)
The AT20G image shows a resolved triple source, about 2 arcmin in extent.
The catalogued AT20G position corresponds to the northern hotspot, but the
core is also detected. This source is a resolved double in the 1.4 GHz NVSS image,
and the 1.4 GHz flux density listed in Table 3 is the sum of the two NVSS components.
We tentatively classify this as an FR-2 radio galaxy on the basis of the NVSS morphology.
J094409-015116 (PMN J0944-0151)
Buchanan et al. (2006) include this object in their sample of “radio–excess IRAS galaxies”.
Their optical spectrum shows strong, narrow emission lines superimposed on a stellar continuum
with Balmer absorption features typical of post-starburst systems.
J105533-283134 (PKS 1053-282)
This source appears to have a complex, diffuse structure at 20 GHz, which is poorly imaged by
the AT20G snapshot observation. The source is less than 30 arcsec in extent in the
1.4 GHz NVSS image. Slee et al. (1994) detected a parsec-scale radio core with an
inverted radio spectrum at 2–8 GHz.
J110957-373220 (NGC 3557)
This is a well-studied nearby elliptical galaxy which hosts a FR-1 radio source
(Birkinshaw & Davies 1985).
J112119-001316 (PKS 1118+000)
The low-frequency NVSS emission is extended and offset from the AT20G emission,
and the higher-resolution FIRST image shows that this is a wide-angle tail
(WAT) radio galaxy with a bright core and complex extended structure at 1.4 GHz.
J113305-040046 (PKS 1130-037)
This AT20G source is the core of a radio galaxy which is extended at low frequencies
and spans almost 10 arcmin on the sky in the NVSS image. We tentatively classify this
as an FR-1 radio galaxy based on the 1.4 GHz NVSS image.
J122343-423532 (PKS 1221-42)
The redshift of z=0.0266 listed in the 6dFGS catalogue is incorrect and the correct redshift
is z=0.1706 (Simpson et al. 1993). The host galaxy and its stellar population have
been studied in detail by Johnston et al. (2005), who note that this is a young compact
steep-spectrum (CSS) radio source with double lobes located well within the optical galaxy.
J123959-113721 (NGC 4594)
This is a well-studied nearby spiral (the ‘Sombrero Galaxy’). Sadler et al. (1995)
found that at 8.4 GHz, the central radio source was smaller than 0.03 arcsec
(i.e. parsec) in angular size.
J124849-411840 (NGC 4696 = PKS 1245-41)
This is the central galaxy of the Centaurus cluster, recently studied in detail by
Taylor et al. (2006). The radio emission is resolved at 20 GHz, but not in the
lower-frequency SUMSS image.
J125438-123255 (NGC 4783 = PKS 1251-12, 3C 278)
This is an extended AT20G source associated with an FR-1 radio galaxy (Morganti et al. 1993).
The optical ID is one of a close pair of elliptical galaxies, NGC 4782 and 4783.
Baum et al. (1988) identify NGC 4782 as the optical ID, but both the AT20G
catalogue position and the core position measured by Ricci et al. (2006) are
closer to NGC 4783, so we tentatively identify this galaxy as the optical counterpart
of the AT20G source.
J130100-322628 (ESO 443-G24 = PKS 1258-321)
This object has extended emission at 1.4 GHz in the NVSS image, and is classified as a low-power
FR-1 radio galaxy by Marshall et al. (2005).
J130527-492804 (NGC 4945)
This is a nearby, well-studied spiral galaxy with an active nucleus.
J130841-242259 (IRAS 13059-2407)
This edge-on disk galaxy (tentatively classified as an Sc spiral in
the NASA Extragalactic Database) has the lowest infrared K-band
luminosity of the 202 galaxies in our AT20G-6dFGS sample.
It is also classified as a ‘radio-excess IRAS galaxy’ by
Drake et al. (2003). Allison et al. (2012; 2013) recently detected
associated 21 cm HI absorption against the central radio source.
J131124-442240 (PKS 1308-441)
The 843 MHz SUMSS image shows low-frequency emission extending over
more than 15 arcmin on the sky. Tingay (1997) notes that this is
a giant radio galaxy with a morphology intermediate
between FR-1 and FR-2. We tentatively classify it as FR-1 on the
basis of the SUMSS image.
J131931-123925 (NGC 5077)
This elliptical galaxy has an extended disk of ionised gas along its minor axis which
has been studied in detail by Bertola et al. (1991), who note that this galaxy also
contains a substantial amount of neutral hydrogen (see also Serra & Oosterloo 2010).
J131949-272437 (NGC 5078)
This is a nearby spiral galaxy with a prominent dust lane.
J132112-434216 (NGC 5090)
The catalogued AT20G source is the core of an FR-1 galaxy with very extended
low-frequency radio emission (Morganti et al. 1993). NGC 5090 has a close
(probably interacting) spiral companion, NGC 5091 (Smith & Bicknell 1986).
J132527-430108 (NGC 5128, Centaurus A)
The AT20G source is the core of the well-studied nearby radio galaxy NGC 5128.
The radio luminosity used in this paper was calculated using the total 20 GHz flux
density of 28.350 Jy listed in the AT20G catalogue (Murphy et al. 2010).
Israel et al. (2008) measured a higher flux density of 11213 Jy at 23 GHz
using WMAP images which include the emission from the outer radio lobes.
J133639-335756 (IC 4296)
The catalogued AT20G source is the core of a well-studied FR-1 radio galaxy
which has very extended emission at low frequencies (Killeen et al. 1986).
The listed 1.4 GHz flux density is the sum of four NVSS components, and
the 843 MHz flux density is from Jones & McAdam (1992).
J134624-375816 (ESO 325-G16, PKS 1343-377)
This AT20G source has complex, highly extended low-frequency emission,
and appears to be the core of a head-tail radio galaxy
in the cluster Abell 3570.
J141949-192825 (PKS 1417-19) The 20 GHz emission is centred on the 6dFGS galaxy, while the lower-frequency NVSS source has a centroid significantly offset from the optical position.
J145509-365508 (PKS 1452-367)
The galaxy has extended low-frequency emission on scales of 3–4 arcmin
in the SUMSS and NVSS images, and we tentatively classify it as an FR-1
radio galaxy based on the low-frequency morphology.
J145924-16413 (NGC 5793)
This AT20G source is the core of a spiral galaxy. Gardner et al. (1992) detected
a VLBI core less than 0.03 arcsec in size, with HI seen in absorption against the
core. Hagiwara et al. (1997) detected an H2O megamaser in NGC 5793.
The HI absorption system has been studied in detail with the VLBA by
Pihlström, et al. (2000).
J151741-242220 (AP Lib)
This well-studied BL Lac object is the most luminous AT20G source in the
local () universe, and is known to be variable at optical as well
as radio wavelengths (Carini et al. 1991).
J164416-771548 (PKS 1637-77)
The cataloged AT20G source is the core of an FR-2 radio galaxy with low-frequency
radio emission extending over at least 4-5 arcmin in the SUMSS image.
There is no 6dFGS spectrum, but Tadhunter et al. (1993) note that the optical
spectrum shows strong emission lines.
J172019-005851 and J172034-005824 (PKS 1717-00, 3C253)
Two hotspots of this FR-2 radio galaxy are detected as separate AT20G sources
3.6 arcmin apart. The galaxy core was not detected in the AT20G survey.
J172341-650036 (NGC 6328)
This well-studied galaxy is a strong, compact radio source at 20 GHz, and has
been identified by Tingay (1997) as one of the closest GPS radio galaxies.
The galaxy shows faint spiral structure in the optical and has been detected
in HI by Veron-Cetty et al. (1995), who suggest that this object is the result
of a recent merger involving a gas-rich spiral galaxy.
J173722-563630 and J173742-563246 (PKS 1733-56)
FR-2 radio galaxy with the two hotspots detected as separate AT20G
sources 4.7 arcmin apart. The galaxy core was not detected in the AT20G
survey.
J180207-471930 (MRC 1758-473)
This galaxy has extended radio emission in the 843 MHz
SUMSS image, and we tentatively classify it as an FR-1 radio galaxy.
J180712-701234 (PKS 1801-702)
This source is a compact double at 20 GHz, with the two components separated by
about 20 arcsec. It appears to be unresolved in the lower-frequency SUMSS image.
J180957-455241 (PKS 1806-458)
Kollgaard et al. (1995) found that this source had a GHz-peaked spectrum with a maximum around 4 GHz,
and remarked that it was much brighter than the vast majority of other GHz-peaked
sources and should be studied further.
More recently Massardi et al. (2011b) made multi-frequency observations at several epochs,
which showed the radio spectrum peaking above 10 GHz. The high radio luminosity of this
source, together with the presence of broad emission lines in the optical spectrum, suggest that
(as discussed in§6.2.1 above) this is probably a blazar seen in a flaring state rather than
a genuine GPS radio galaxy.
J181857-550815 (PMN J1818-5508)
This 20 GHz source is the core of a radio galaxy which is a resolved double in
the 843 MHz SUMSS image. We tentatively classify this as an FR-1 radio galaxy.
J181934-634548 (PKS 1814-63)
This is a very strong compact source which is a member of the Morganti
et al. (1993) 2 Jy sample and has classified as a CSS radio source by
Tzioumis et al. (2002). The galaxy has been studied in detail by Morganti
et al. (2011), who note that it is a rare example of a powerful radio
AGN hosted by a disk galaxy. In the optical, there is a very bright
foreground star whose light contaminates the 6dFGS spectrum.
J184314-483622 (PKS 1839-48)
The AT20G source is the core of an FR-1 radio galaxy in the 2 Jy
sample of Morganti et al. (1993).
J191457-255202 (PMN J1914-2552)
The NVSS image shows diffuse emission extending up to 5 arcmin
to the west of the galaxy core, suggesting that this may be a
head-tail radio source in a cluster.
J192817-293145 (ESO 460-G04, MRC 1925-296)
The NVSS image shows extended low-frequency emission, with a morphology
suggesting that this is a wide-angle tail (WAT) radio galaxy in a cluster.
J195817-550923 (PKS 1954-55)
This source is a resolved double in the AT20G image at 20 GHz, with the
components separated by about 1 arcmin. A detailed ATCA image made by
Morganti et al. (1999) at 8 GHz shows a core together with complex,
extended jet structures which are not well imaged by the limited uv coverage
of the ATCA snapshot observations. This is one of the most highly-polarized sources
in the AT20G catalogue, with a fractional linear polarisation of 43.5% at 20 GHz
(Murphy et al. 2010).
J200954-482246 (NGC 6868)
This is a well-studied dust-lane elliptical galaxy in a group. A detailed X-ray study has
been carried out by Machacek et al. (2010).
J203444-354857 (ESO 400-IG40)
The AT20G source is associated with the northern member of
a close pair of galaxies in the cluster Abell 3695.
J204552-510627 (ESO 234-G68)
The SUMSS image shows very extended low-frequency radio emission, from which
we tentatively classify this object as an FR-1 radio galaxy.
J205202-570407 (IC 5063)
This is a well-known dust-lane S0 galaxy recently studied in detail by Morganti et al. (2013).
J205306-162007 (IC 1335, PKS 2050-16)
The NVSS image shows extended low-frequency radio emission with a
total angular total extent of at least 10 arcmin. We tentatively classify this
object as an FR-1 radio galaxy based on the NVSS morphology.
J205603-195646 (PKS 2053-20)
This source is a compact double, about 0.5 arcmin in extent, at 20 GHz.
The two components appear to be hotspots, and no core is detected.
The catalogued AT20G position corresponds to the southern hotspot.
The source is barely resolved in the lower-frequency NVSS image.
J205754-662919 (ESO 106-IG15)
The SUMSS image shows low-frequency radio emission extending over
at least 5 arcmin on the sky, from which we tentatively classify
this object as an FR-1 radio galaxy.
J212222-560014 (PMN J2122-5600)
The AT20G source is offset by more than 40 arcsec from the
centroid of the extended low-frequency emission seen in the SUMSS
image. This offset, together with the morphology of the low-frequency
emission, suggests this is probably a head-tail radio source
in a cluster. As noted in §3.4.1 of this paper, Hancock
et al. (2010) find that the compact AT20G source has a radio
spectrum peaking above 40 GHz, suggesting that this may be
a rare example of a recently-restarted radio galaxy.
J213133-383703 (NGC 7075)
This galaxy has extended low-frequency emission in the NVSS and
SUMSS images, and is tentatively classified as an FR-1 radio
galaxy on the basis of the low-frequency morphology.
J213741-143241 (PKS 2135-13)
The catalogued AT20G source is a hotspot of the well-studied FR-2 radio galaxy
PKS 2135-13 (see Table 1).
The core is also detected at 20 GHz, and the 6dFGS spectrum shows strong,
broad optical emission lines.
J214824-571351 (PMN J2148-5714)
This source has extended, asymmetric radio emission at 843 MHz,
and may be a head-tail radio source in a cluster.
J215129-552013 (PKS 2148-555)
The catalogued AT20G source is the core of an extended FR-1 radio
galaxy, with low-frequency emission extending over at least 12 arcmin
in the 843 MHz SUMSS image. The AT20G 20 GHz image shows extended emission
to the south-west of the core, possibly originating in a jet. Raimann et al. (2005) note that the host galaxy has an absorption-line (Aa) optical spectrum.
J215706-694123 (ESO 075-G041, PKS 2153-69)
This is a very bright (37 Jy) double source in SUMSS, and is classified
as an FR-2 radio galaxy by Morganti et al. (1993). As noted by Ricci et al.
(2004), both the core and a fainter southern hotspot are seen in the
AT20G 20 GHz image.
J220113-374654 (PKS 2158-30)
The catalogued AT20G source is a hotspot of the FR-2 radio galaxy PKS 2158-30
(see Table 1). The core is not detected in the AT20G image.
J220916-471000 (NGC 7213)
This is a bright, nearby early-type spiral galaxy which has recently been
studied in detail at both radio and X-ray wavelengths by Bell et al. (2011).
J224559-173724 (PKS 2243-179)
Although not flagged as extended in the AT20G catalogue, this source appears extended or
double in the 20 GHz image.
J225710-362744 (IC 1459)
This is a nearby and well-studied giant elliptical galaxy which has been identified
by Tingay et al. (2003) as one of the closest GPS radio galaxies. Oosterloo et al. (2007)
note that IC 1459 lies in a gas-rich galaxy group and has HI tidal tails extending over
at least 200 kpc on the sky. Franx & Illingworth (1988) discovered a fast counter-rotating
stellar core in IC 1459, and Cappellari et al. (2002) have studied the kinematics of this
galaxy in detail.
J231905-420648 (PKS 2316-423)
This galaxy is a bright X-ray source (Crawford & Fabian 1994), and was
identified as a radio-selected BL Lac object by Roberts et al.
(1998). The SUMSS image shows extended low-frequency emission
with a complex structure.
J231915-533159 (PKS 2316-538)
This galaxy has extended low-frequency emission in the
SUMSS image, and is tentatively classified as an FR-1 radio
galaxy on the basis of the low-frequency morphology.
J234205-160840 (PKS 2339-164)
The NVSS image shows complex, extended emission at low-frequency,
and the NVSS morphology suggests that this is a wide-angle tail
radio galaxy in a cluster.
J235156-010909 (PKS 2349-01)
The AT20G source is a resolved double roughly 15-20 arcsec in extent.
The low-frequency emission is barely resolved in NVSS, but the
higher-resolution FIRST image at 1.4 GHz shows a compact double
with similar morphology to the AT20G image.