Eliminating cracking during drying
Abstract
When colloidal suspensions dry, stresses build up and cracks often occur - a phenomenon undesirable for important industries such as paint and ceramics. We demonstrate an effective method which can completely eliminate cracking during drying: by adding emulsion droplets into colloidal suspensions, we can systematically decrease the amount of cracking, and eliminate it completely above a critical droplet concentration. Since the emulsion droplets eventually also evaporate, our technique achieves an effective function while making little changes to the component of final product, and may therefore serve as a promising approach for cracking elimination. Furthermore, adding droplets also varies the speed of air invasion and provides a powerful method to adjust drying rate. With the effective control over cracking and drying rate, our study may find important applications in many drying and cracking related industrial processes.
1 Introduction
Drying of colloidal suspensions is closely related to many important industrial processes, such as the drying of paints, cosmetic products, and ceramic powders 10 . During drying, the “coffee-ring flow” drives particles to fast-evaporating regions, forming close packed networks 1 ; deegan2 . Further evaporation produces tiny liquid-air menisci between particles, resulting in large capillary pressures that produce significant internal stresses 2 ; dufresne2 ; 3 . Once the stress exceeds material strength, cracking naturally occurs 4 . Cracking is problematic for many applications and thus its elimination is highly desirable. While the occurrence, propagation, and patterns of cracking have been extensively studied 2 ; dufresne2 ; 3 ; 4 ; 5 ; 6 ; 7 ; 8 ; 9 , the fundamental mechanism of its formation remains open to debate. It has been illustrated that the capillary pressure from air-liquid interface is the source of internal stresses which cause cracking 2 ; dufresne2 ; 3 . Equally important is the elastic modulus of individual particles, which determines how particles respond to these stresses Martinez ; Singh ; Singh2 . Therefore, manipulating the internal structure, reducing stress and changing particle modulus may achieve cracking reduction. For example, it was found that combining multiple thin layers into a thick one can effectively eliminate cracking Lee . Another efficient approach is to add soft particles into system, which reduces the effective modulus and internal stress Singh2 . Despite this important finding, however, adding soft particles can also bring disadvantages: these particles may require complex synthesis and increase the cost; and their addition may modify the component of final product. Therefore, an effective approach with an easy-to-produce additive material which makes little changes to the final product will be ideal.
In this study, we add “liquid-particles”, i.e., emulsion droplets, into the system, and achieve effective cracking elimination. Interestingly, as the droplet concentration increases, a sharp transition occurs in the cracking behavior, indicated by a dramatic reduction of cracks. After this transition, the system becomes crack free during drying, due to the decrease of the elastic modulus (); and the increasing importance of the loss modulus (). Moreover, since the emulsion droplets eventually also evaporate, our technique makes little modification to the component of final product, and therefore suggests liquid droplets as a promising additive material for cracking elimination. Using confocal microscopy, we also find that droplets can slow down air invasion and provide an effective control on the drying rate. With these practical effects, our study may find useful applications in drying and cracking related industrial processes.
2 Experiment
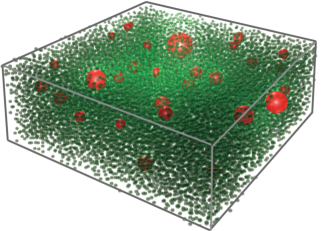
We suspend sterically-stabilized colloidal spheres of polymethylmethacrylate (PMMA) with diameter in decahydronaphthalene (DHN). We separately suspend a 1:1 (by volume) mixture of water and glycerol, stabilized by PGPR-90 surfactant, in DHN. We use a homogenizer to create a polydisperse emulsion, with droplets ranging from hundreds of nanometers to a few microns. We combine the suspensions of particles and of droplets at various ratios to create our particle-droplet mixtures. We select these particular components so that the refractive indices of the particles, droplets and background solvent are all sufficiently close that we can image the entire bulk with confocal microscopy. To distinguish the particles from the droplets, we use different dyes for each: particles are dyed with nitrobenzoxadiazole (NBD) and appear green; droplets are dyed with rhodamine-B and appear red (see Fig.1). We deposit of samples on a clean glass coverslip, and image from below with confocal microscopy (Leica SP5). Drying proceeds in two stages 2 : in stage one, as the solvent continues to evaporate, particles and droplets condense into a jammed structure; during stage two, a drying air front invades the jammed structure and displaces the solvent, which ultimately evaporates completely. Cracking typically occurs at the beginning of the second stage, during which internal stresses build up dramatically.
3 Results and discussion
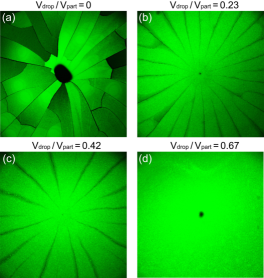
We demonstrate the cracking results of several samples, with increasing droplet concentrations, in Fig.2. Due to the continuous evaporation of solvent, the volume fractions of droplets and particles keep increasing and thus can not be taken as meaningful parameters. However, the volume ratio between droplets and particles, , remains a constant during measurement footnote . We therefore specify the samples with . Clearly, the cracking behavior varies systematically with . For the pure colloidal suspension, a large number of cracks distribute irregularly throughout the sample (Fig.2a, = ). When small amount of droplets are added, plenty of cracks still arise, but distribute more regularly along radial directions (Fig.2b, ). As more and more droplets are included, the amount of cracks decreases dramatically (Fig.2c, ), until they disappear completely (Fig.2d, ). Apparently, adding droplets effectively reduces the cracking formation, regularizes the cracking distribution, and eventually leads to a crack free system.
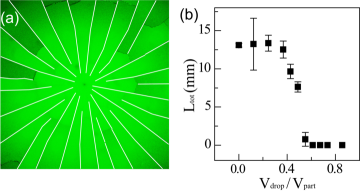
To quantify the degree of cracking, we measure the total length of all cracks within the field of view, as illustrated by the white lines in Fig.3a. We compare this total length, , for samples with different in Fig.3b. To make consistent comparisons, we always put our field of view at the center of each sample, and count the major cracks along radial directions only. Each is determined by the average of three experiments at the same , with error bars calculated from the standard deviation. Clearly, for samples with zero or small droplet amount, remains largely unvaried at a high level. However, above a critical ratio around , rapidly drops to zero, and remains at zero afterwards. These data indicate that the cracking reduction does not occur gradually; instead it undergoes a critical-like transition around a threshold value.
How to understand this critical transition? We investigate the samples’ fundamental mechanical property – the viscoelastic moduli – with respect to . Unlike pure solids or liquids, which respond to external stress with either elastic deformation or viscous dissipation; colloidal suspensions exhibit both elastic (or solid-like) and viscous (or liquid-like) responses. These responses are quantitatively described by the two viscoelastic moduli: the storage modulus, , and the loss modulus, . Their relative importance determines the amount of energy stored versus dissipated. We directly measure and for samples with different . Since in our experiment, cracks appear after the system being under stress for about , we use as the frequency lower bound. The upper bound is chosen as , which is the typical formation time of one individual crack.
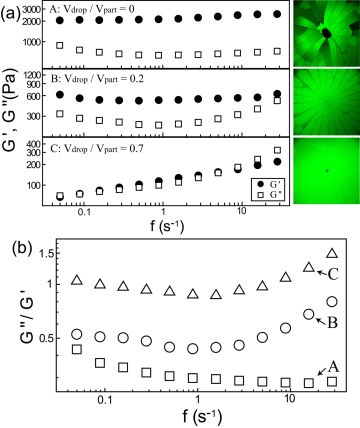
Three typical samples are measured: sample A without emulsion droplets (), sample B with small amount of droplets before the critical transition ( = ), and sample C with large amount of droplets after the transition (). All samples have similar volume fractions around . This volume fraction is approximately the same as the jammed structure right before air invades the system. Their viscoelastic moduli, and , are shown in Fig.4a. From sample A to C, and decrease with . The decrease of may reduce the internal stress in the system and cause cracking reduction, consistent with previous findings Singh2 .
Moreover, we also observe a systematic change in the relative importance between and : for sample A, is significantly higher than , indicating that under external stresses most energy will be elastically stored within the system. For sample B, still dominates but with a smaller difference, suggesting the increasing importance of . When enough droplets are added in sample C, and become to have similar magnitude and significant fraction of energy can dissipate through . We therefore plot the ratio, , at different in Fig.4b: as the droplet amount increases, grows from significantly smaller than one (sample A) to close to unity (sample C), indicating that more fraction of energy can dissipate through while less can be stored through . Therefore, our experiment indicates that the cracking reduction is related to both the decrease of and the increasing importance of , suggesting the significant roles of both factors.
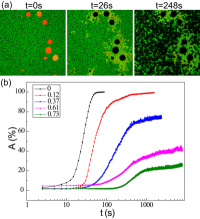
More interestingly, adding droplets into system has another effect: it can slow down the invasion speed of air and achieve powerful control on drying rate. The air invasion can be directly measured by confocal microscopy shown in Fig.5a: as air invades the system, more and more regions turn into black. This is due to the replacement of solvent by air, which destroys the refractive index match and makes the region appear black. To quantitatively describe the invasion speed, we continuously scan a fixed field of view () at the frame rate of frame/s, and measure the percentage of invaded area as a function of time, . We compare for samples with different in Fig.5b. Here the time zero is defined as the first frame at which air enters the field of view. Clearly, air invasion slows down dramatically with the increase of . For the sample without droplets, it only takes about for to reach the stable value of ; while for , it takes more than to reach the stable value of . To clarify whether the reduction of cracking is related to the slow down of air invasion, we compare the drying of the same samples both in open air and inside a chamber. For the latter situation, the air invasion speed decreases by more than eight times; while similar amount of cracks still arises. Therefore, in our system evaporation rate of solvent does not have a significant influence on cracking elimination, and the reduction is mainly due to the effect from droplets.
Why droplets can slow down the air invasion? To understand it, we investigate the invasion process at single-particle level. We prepare a droplet-particle mixture with particle diameter and droplet diameter , and inspect the detailed invasion process in Fig.5a. Once touched by air, the droplets collapse and their contents are pushed into surrounding pores (Fig.5a middle image), due to the large pressure imbalance previously discovered 11 . Interestingly, as air continues to enter the system, these contents can block the pathways of air and prevent nearby regions from being invaded. This phenomenon is clearly demonstrated in Fig.5a: the regions far away from the droplets get quickly invaded by air and turn into black; while the regions near the droplets remain bright and not invaded for a long period of time. Therefore, when enough droplets are added, significant fraction of pore space can be ‘protected’ by droplet contents which can slow down the air invasion considerably. We emphasize that the droplet contents eventually also evaporate, leaving only a little surfactant. Therefore adding droplets can achieve both cracking reduction and drying rate variation without significantly altering the final product.
The observation that the low-volatile droplet contents in pore space can dramatically slow down the air invasion naturally raises another possible explanation for our crack elimination: if the pore space is totally occupied by these contents, air can hardly enter and crack thus disappears. However, we point out two issues in this explanation: (1) the low-volatile contents eventually also evaporate and air sooner or later will enter the system, thus these contents should just delay instead of eliminate cracking; and (2) we perform new experiments with pure water as droplet contents and find similar crack elimination behaviors. Since water is even more volatile than the bulk solvent and thus does not slow down air invasion, this finding shows that the low-volatility of droplet contents is probably not the reason. Therefore these results suggest that the the change of moduli provides a more reasonable explanation for our cracking elimination.
4 Conclusion
In this study, we experimentally illustrate an effective approach for cracking elimination during drying: by adding emulsion droplets, the amount of cracks decreases systematically, until they are completely eliminated. Moreover, since the droplets eventually also evaporate, our approach makes little modification to the component of final product, and thus suggests liquid droplets as one potentially powerful candidate for cracking elimination. More explorations along this direction may bring effective and cheap cracking elimination methods. In addition, droplets can also slow down the air invasion and provide an effective control on the drying rate, which has practical importance in paint and cosmetics industries.
Acknowledgements.
This project is supported by the Hong Kong GRF Grant (Project No. CUHK404211).References
- (1) U.T. Gonzenbach, A.R. Studart, D. Steinlin, E. Tervoort, L.J. Gauckler, J. Am. Ceram. Soc. 90, 3407 (2007).
- (2) R.D. Deegan, O. Bakajin, T.F. Dupont, G. Huber, S.R. Nagel, T.A. Witten, Nature (London) 389, 827 (1997).
- (3) R.D. Deegan, O. Bakajin, T.F. Dupont, G. Huber, S.R. Nagel, T.A. Witten, Phys. Rev. E. 62, 756 (2000).
- (4) E.R. Dufresne, E.I. Corwin, N.A. Greenblatt, J. Ashmore, D.Y. Wang, A.D. Dinsmore, J.X. Cheng, X.S. Xie, J.W. Hutchinson, D.A. Weitz, Phys. Rev. Lett. 91, 224501 (2003).
- (5) E. R. Dufresne, D.J. Stark, N.A. Greenblatt, J.X. Cheng, J.W. Hutchinson, L. Mahadevan, D.A. Weitz, Langmuir 22, 7144 (2006).
- (6) L. Xu, S. Davies, A.B. Schofield, D.A. Weitz, Phys. Rev. Lett. 101, 094502 (2008).
- (7) C. Allain, L. Limat, Phys. Rev. Lett. 74, 2981 (1995).
- (8) T. Boeck, H.A. Bahr, S. Lampenscherf, U. Bahr, Phys. Rev. E. 59, 1408 (1999).
- (9) S. Kitsunezaki, Phys. Rev. E. 60, 6449 (1999).
- (10) A. Groisman, E. Kaplan, Europhys. Lett. 25, 415 (1994).
- (11) K.A. Shorlin, J.R. de Bruyn, M. Graham, S.W. Morris, Phys. Rev. E. 61, 6950 (2000).
- (12) S. Kitsunezaki, J. Phys. Soc. Jpn. 78, 064801 (2009).
- (13) C. J. Martinez, J. A. Lewis, Langmuir 18, 4689 (2002).
- (14) K. B. Singh, M. S. Tirumkudulu, Phys. Rev. Lett. 98, 218302 (2007).
- (15) K. B. Singh, G. Deoghare, M. S. Tirumkudulu, Langmuir 25, 751 (2009).
- (16) J. H. Prosser, T. Brugarolas, S. Lee, A. J. Nolte, D. Lee, Nano Lett. 12, 5287 (2012).
- (17) The evaporation rate of the droplets is much slower than the solvent therefore the droplet volume is approximately a constant during our measurement time.
- (18) L. Xu, A. Bergès, P.J. Lu, A.R. Studart, A.B. Schofield, H. Oki, S. Davies, D.A. Weitz, Phys. Rev. Lett. 104, 128303 (2010).