A Lower Growth Rate from Recent Redshift Space Distortion Measurements than Expected from Planck
Abstract
We perform a meta-study of recently published Redshift Space Distortion (RSD) measurements of the cosmological growth rate, . We analyse the latest results from the 6dFGS, BOSS, LRG, WiggleZ and VIPERS galaxy redshift surveys, and compare the measurements to expectations from Planck. In this Letter we point out that the RSD measurements are consistently lower than the values expected from Planck, and the relative scatter between the RSD measurements is lower than expected. A full resolution of this issue may require a more robust treatment of non-linear effects in RSD models, although the trend for a low agrees with recent constraints on and from Sunyaev-Zeldovich cluster counts identified in Planck.
Understanding the accelerated expansion of the universe is currently one of the most important questions in cosmology. Measurements of the distance-redshift relation with supernovae and Baryon Acoustic Oscillations (BAOs) are well described by General Relativity with a cosmological constant, and Cold Dark Matter – the CDM model. The discovery of the accelerated expansion has motivated a vast number of theories of modified gravity - comprehensively reviewed by Clifton et al. (2012). Any theory of gravity must reproduce the background expansion observed with tests of the distance-redshift relation. To test such theories, a number of galaxy surveys have measured the growth rate of cosmological density perturbations, where many modified gravity theories predict different growth rates to CDM. Specifically, the cosmological growth rate is defined as , where is the scale factor, and is the growth factor of the matter density contrast.
Most recent growth rate measurements come from inferring peculiar velocities from Redshift Space Distortions (RSDs) in a galaxy redshift survey, as proposed by Kaiser (1987). One of the first RSD surveys to use this anisotropy to measure the growth rate was the 2dFGRS (Peacock et al., 2001). The growth rate has since been measured with a range of other techniques and surveys, with the RSD technique in the VVDS survey (Guzzo et al., 2008), QSO clustering and Lyα clustering (Ross et al., 2007; da Ângela et al., 2008; Viel et al., 2004), and at in peculiar velocity surveys, (Davis et al., 2011; Hudson & Turnbull, 2012).
Since galaxies only form in the densest regions of the universe, a bias factor is used to relate perturbations in the matter density to perturbations in galaxy density , so that . Due to this bias, galaxies are only sensitive to the growth rate to within a factor of the density power spectrum normalisation. Consequently, early growth rate measurements reported values of the parameter , where . However, since the galaxy bias varies between populations of galaxies (with typical values between 1 and 3), values of from different surveys can be difficult to combine and compare to theories. More recently, growth rate measurements have therefore been reported in the combination of , (Percival & White, 2009) where is the matter power spectrum normalisation on scales of 8 Mpc. It is only values of from RSD surveys that we consider here, as summarised in Table 1, and not earlier values of .
| Survey | (Mpc) | Method | Model | Reference | ||
|---|---|---|---|---|---|---|
| 6dFGS | 0.067 | 30 | 0, 2, 4 | Scoccimarro (Scoccimarro, 2004) | Beutler et al. (2012) | |
| LRG200 | 0.25 | 200 | 0, 2, 4 | Kaiser (Kaiser, 1987)+damping | Samushia et al. (2012) | |
| 0.37 | ||||||
| LRG60 | 0.25 | 60 | 0, 2, 4 | Kaiser (Kaiser, 1987)+damping | ||
| 0.37 | ||||||
| BOSS | 0.30 | 200 | 0, 2 | Tojeiro et al. (2012) | ||
| ρ=-0.19 | 0.60 | |||||
| WiggleZ | 0.44 | 0, 2 | Jennings (Jennings et al., 2011) | Blake et al. (2012) | ||
| ρ=0.51 | 0.60 | 0.3 Mpc-1 | ||||
| ρ=0.56 | 0.73 | |||||
| VIPERS | 0.8 | 30 | 0, 2 | Kaiser (Kaiser, 1987)+damping | de la Torre et al. (2013) |
In Tojeiro et al. (2012), the growth rate from the BOSS survey was fitted at four correlated redshift values, although the publicly available covariance matrix is for three redshift measurements, to reduce correlations between the measurements. We find that even with three redshift bins, the block-diagonal covariance matrix is too highly correlated, and thus we do not include the highly correlated intermediate redshift measurement. We analyse the data with two different measurements from the LRG (Luminous Red Galaxy) survey (from the SDSS data release 7), with a maximum pair separation of 200 Mpc (LRG200) and also with a maximum pair separation of 60 Mpc (LRG60) – we do not analyse the data with both LRG200 and LRG60 simultaneously.
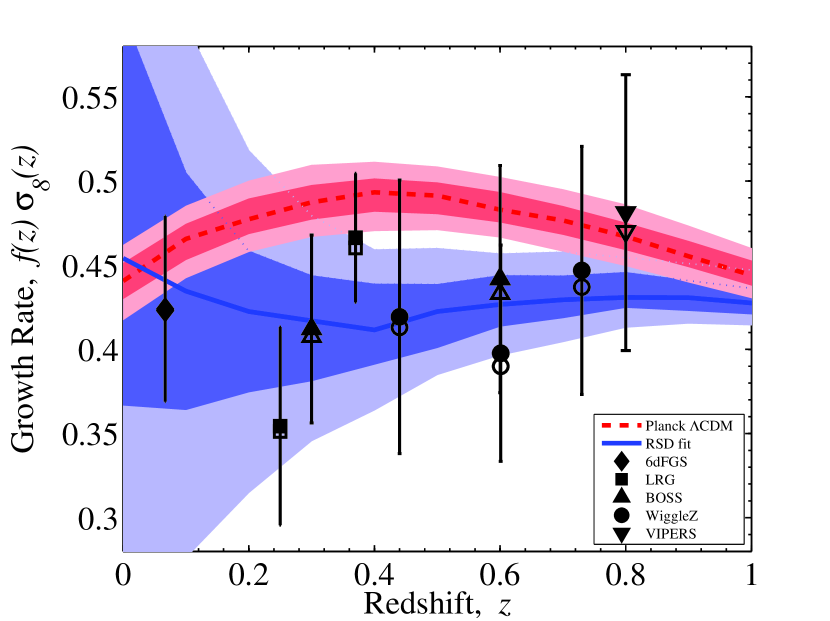
These galaxy surveys do not measure distances directly – in order to infer the distance from the measured redshift, a cosmological model must be assumed. As noted by Alcock & Paczynski (1979), if an incorrect cosmological model is assumed, an additional, artificial anisotropy can be imposed on the RSDs. For the surveys we consider here, a CDM cosmology based on Wilkinson Microwave Anisotropy Probe (WMAP) 7-year parameters (Larson et al., 2011) was assumed. Thus, in order to compare the measurements to predictions from Planck, we have to account for the additional anisotropy introduced by inferring distances from WMAP to Planck parameters. To approximate this Alcock-Paczynski (AP) effect, we thus re-scale to growth rate measurements and uncertainties by the ratio of in WMAP and Planck cosmologies, where is the Hubble parameter, and is the angular diameter distance. In Figure 1, we plot the original published values of as open markers, and the re-scaled values as filled markers.
To account for the range of growth rate models allowed by Planck parameters, we use CAMB (Lewis et al., 2000) to generate growth rate models for each step in (a thinned version) of the Planck parameter chain. To prepare the chain, we combine the eight base_planck_lowl_lowLike chains from the Planck Legacy Archive 111http://www.sciops.esa.int/index.php?project=planck&page=Planck_Legacy_Archive, to create a chain 78,373 steps long, which – for efficiency – we thin by a factor of 10 to 7,838 steps. These results are illustrated in Figure 1. The lighter red band represents the region which includes 95% of the growth rate models, and the darker red band illustrates the region which includes 68%. The dashed red line illustrates the best-fit. To fit the RSD data, we thin the 7,838 step chain by an additional factor of 10, and for each of these steps perform a Markov chain Monte Carlo fit to the RSD data (calculating the AP-effect for the parameters at every step in the chain). We then combine these chains to marginalise over the range of uncertainty allowed by Planck.
In order to fit the RSD data, we use parameters which – as far as possible – only affect the growth of perturbations, and not the well-constrained distance redshift relation or the Cosmic Microwave Background (CMB) anisotropies. Following Zuntz et al. (2012) we use a parameterised model for the gravitational slip, , given by
| (1) |
where and are potentials which describe time-like and space-like metric perturbations in the Newtonian gauge, respectively. For General Relativity, in the absence of anisotropic stress, these two potentials are equal, and so . At the redshifts probed by RSDs, we expect the anisotropic stress to be negligible, so non-zero values of may suggest physics beyond General Relativity. For the particular model we consider here, we specify the value of at redshift 0 and 1, we call these parameters and .
The model additionally includes an equivalent parameterisation for an effective Newton’s constant, although with only RSD data, the two sets of parameters are indistinguishable, and we consider only one set. These parameters do not affect the background expansion, and only affects CMB anisotropies via the Integrated Sachs-Wolfe (ISW) effect. In Table 2 we illustrate the results of our fits for and . In both the LRG60 and LRG200 data sets, is discrepant with the GR value of 0 at around the one standard deviation level, and is discrepant at over the two standard deviation level. The corresponding growth rate models are illustrated as before in Figure 1 in blue, with a solid line.
We note that the best fit to the RSD data would lead to a very high ISW signal in the CMB anisotropies. On simultaneously fitting to low- CMB constraints (from WMAP) and RSDs – and additionally fitting for an effective Newton’s constant – we find that the combined data is overwhelmingly dominated by the ISW constraint, only including the RSD data in the growth rate models at the 95% limit. Thus it does not currently appear possible to simultaneously fit RSDs and the ISW - the results we present here are for the fits to only the RSDs.
We consider the statistic for the fits, given by
| (2) |
where is a vector of observed values, is a vector of corresponding values from a model for , and is the covariance matrix for the data. We note that for both data sets, the is substantially less than the 7 degrees of freedom in the fit. We calculate the Probability To Exceed (PTE) this , under the assumption that the uncertainties are indeed correctly estimated. The very low PTE values suggest that either the uncertainties have been over estimated, or genuine scatter in the measurements is being systematically suppressed. While only additional observations will determine whether this trend is truly statistically significant, the results already in hand appear to suggest that either the quoted uncertainties have been overestimated, or the analysis is suppressing genuine scatter in the measurements.
| 1-PTE | ||||
|---|---|---|---|---|
| -2.941.94 | 0.320.13 | -0.72 | 1.34 | 0.99 |
| -2.071.88 | 0.280.10 | -0.70 | 3.31 | 0.86 |
We note that the PTE decreases with the LRG200 data set, since the LRG200 measurements have a larger scatter than the LRG60 measurements. This is likely due to the fact that most of the coherent clustering signal is due to correlations on scales less than 100 Mpc, so the additional correlations are effectively adding noise to the signal.
In most recent results, the uncertainties have been estimated from several hundred simulated realisations of the survey, from which the uncertainty (and the covariance between measurements, in the case of several redshift bins) can be deduced from the scatter in the realisations. Although it may appear that the uncertainties on the measurements have been overestimated, good agreement between the quoted values and Fisher forecasts (e.g., White et al., 2009) of the minimum intrinsic statistical uncertainties suggests that this is not the case, although Reid et al. (2012) note that the uncertainties in the BOSS growth rate measurements are around 40% larger than the Fisher matrix predictions.
Perhaps the stage of an RSD analysis most likely to introduce a systematic shift, and artificially reduce the scatter, may be in fitting a model to the two-dimensional two-point correlation function (or power spectrum). Parkinson et al. (2012) analysed simulated catalogues for the WiggleZ survey with a range of models for the RSD effect, and found that measurements of (which is directly sensitive to the growth rate) were highly dependent on the model used. In particular, the model of a HALOFIT (Smith et al., 2003) with a linear model for the redshift space distortion recovered a lower compared to the fiducial value on which the simulation was based.
The preference for a lower growth rate or appears to agree with recent results from Planck Collaboration et al. (2013), studying Sunyaev-Zeldovich (SZ) cluster counts, who find and . Collectively, these results may be suggesting that CDM does not fully model simultaneously the Cosmic Microwave Background and the Universe at . However, future work will require detailed work with simulated catalogues for a range of cosmological models (e.g., Jennings, 2012; Jennings et al., 2012) and an improved understanding of the relationship between the observed galaxies, the peculiar velocity field, and the underlying dark matter (e.g., Reyes et al., 2010; Sherwin et al., 2012), before we can more robustly use RSD measurements to study departures from CDM.
We thank the two anonymous referees for useful comments which have substantially improved this letter, Jonathan Patterson for help with parallelisation of the analysis code, Tessa Baker for help with the model parametrisation, Erminia Calabrese for help with the Planck parameters for the growth rate, Lado Samushia for help with the growth rate models, Rita Tojeiro for help with the BOSS data, Chris Blake for useful suggestions and help with the WiggleZ data and Pedro Ferreira for comments and discussions. This project was supported by an ERC Starting Grant StG2010-257080 and a Leverhulme visiting professorship for HKE. EM acknowledges support from the BIPAC and STFC. IKW acknowledges support from ERC grant 259505. Part of the research was carried out at the Jet Propulsion Laboratory, California Institute of Technology, under a contract with NASA.
References
- Alcock & Paczynski (1979) Alcock, C., & Paczynski, B. 1979, Nature (London), 281, 358
- Beutler et al. (2012) Beutler, F. et al. 2012, MNRAS, 423, 3430, 1204.4725
- Blake et al. (2012) Blake, C. et al. 2012, MNRAS, 425, 405, 1204.3674
- Clifton et al. (2012) Clifton, T., Ferreira, P. G., Padilla, A., & Skordis, C. 2012, Physics Reports, 513, 1, 1106.2476
- da Ângela et al. (2008) da Ângela, J. et al. 2008, MNRAS, 383, 565, arXiv:astro-ph/0612401
- Davis et al. (2011) Davis, M., Nusser, A., Masters, K. L., Springob, C., Huchra, J. P., & Lemson, G. 2011, MNRAS, 413, 2906, 1011.3114
- de la Torre et al. (2013) de la Torre, S. et al. 2013, ArXiv e-prints, 1303.2622
- Guzzo et al. (2008) Guzzo, L. et al. 2008, Nature (London), 451, 541, 0802.1944
- Hamilton (1992) Hamilton, A. J. S. 1992, APJL, 385, L5
- Hudson & Turnbull (2012) Hudson, M. J., & Turnbull, S. J. 2012, APJL, 751, L30, 1203.4814
- Jennings (2012) Jennings, E. 2012, MNRAS, L533, 1207.1439
- Jennings et al. (2012) Jennings, E., Baugh, C. M., Li, B., Zhao, G.-B., & Koyama, K. 2012, MNRAS, 425, 2128, 1205.2698
- Jennings et al. (2011) Jennings, E., Baugh, C. M., & Pascoli, S. 2011, MNRAS, 410, 2081, 1003.4282
- Kaiser (1987) Kaiser, N. 1987, MNRAS, 227, 1
- Larson et al. (2011) Larson, D. et al. 2011, APJS, 192, 16, 1001.4635
- Lewis et al. (2000) Lewis, A., Challinor, A., & Lasenby, A. 2000, Astrophys. J., 538, 473, astro-ph/9911177
- Parkinson et al. (2012) Parkinson, D. et al. 2012, ArXiv e-prints, 1210.2130
- Peacock et al. (2001) Peacock, J. A. et al. 2001, Nature, 410, 169, arXiv:astro-ph/0103143
- Percival & White (2009) Percival, W. J., & White, M. 2009, MNRAS, 393, 297, 0808.0003
- Planck Collaboration et al. (2013) Planck Collaboration et al. 2013, ArXiv e-prints, 1303.5080
- Reid et al. (2012) Reid, B. A. et al. 2012, MNRAS, 426, 2719, 1203.6641
- Reyes et al. (2010) Reyes, R., Mandelbaum, R., Seljak, U., Baldauf, T., Gunn, J. E., Lombriser, L., & Smith, R. E. 2010, Nature (London), 464, 256, 1003.2185
- Ross et al. (2007) Ross, N. et al. 2007, MNRAS, 381, 573
- Samushia et al. (2012) Samushia, L., Percival, W. J., & Raccanelli, A. 2012, MNRAS, 420, 2102, 1102.1014
- Scoccimarro (2004) Scoccimarro, R. 2004, Phys. Rev. D, 70, 083007, arXiv:astro-ph/0407214
- Sherwin et al. (2012) Sherwin, B. D. et al. 2012, Phys. Rev. D, 86, 083006, 1207.4543
- Smith et al. (2003) Smith, R. E. et al. 2003, MNRAS, 341, 1311, arXiv:astro-ph/0207664
- Tojeiro et al. (2012) Tojeiro, R. et al. 2012, MNRAS, 424, 2339, 1203.6565
- Viel et al. (2004) Viel, M., Haehnelt, M. G., & Springel, V. 2004, MNRAS, 354, 684, arXiv:astro-ph/0404600
- White et al. (2009) White, M., Song, Y.-S., & Percival, W. J. 2009, MNRAS, 397, 1348, 0810.1518
- Zuntz et al. (2012) Zuntz, J., Baker, T., Ferreira, P. G., & Skordis, C. 2012, JCAP, 6, 32, 1110.3830