Hot water in the inner 100 AU of the Class 0 protostar NGC1333 IRAS2A
Abstract
Evaporation of water ice above 100 K in the inner few 100 AU of low-mass embedded protostars (the so-called hot core) should produce quiescent water vapor abundances of relative to H2. Observational evidence so far points at abundances of only a few . However, these values are based on spherical models, which are known from interferometric studies to be inaccurate on the relevant spatial scales. Are hot cores really that much drier than expected, or are the low abundances an artifact of the inaccurate physical models? We present deep velocity-resolved Herschel-HIFI spectra of the – lines of HO and HO (1097 GHz, K) in the low-mass Class 0 protostar NGC1333 IRAS2A. A spherical radiative transfer model with a power-law density profile is unable to reproduce both the HIFI data and existing interferometric data on the HO – line (203 GHz, K). Instead, the HIFI spectra likely show optically thick emission from a hot core with a radius of about 100 AU. The mass of the hot core is estimated from the C18O –8 and 10–9 lines. We derive a lower limit to the hot water abundance of , consistent with the theoretical predictions of . The revised HDO/H2O abundance ratio is , an order of magnitude lower than previously estimated.
Subject headings:
stars: formation — stars: protostars — circumstellar matter — techniques: spectroscopic — astrochemistry1. Introduction
In the embedded stage of low-mass star formation, the central source is surrounded by a collapsing envelope that spans a wide range in densities and temperatures (André et al., 2000). The inner region, known as the hot core or hot corino ( K; Walmsley & Schilke, 1992; van Dishoeck & Blake, 1998; Ceccarelli, 2004), forms a crucial step in the flow of matter from the cold outer envelope toward the circumstellar disk (Visser et al., 2009). Thermal evaporation of water ice at about 100 K should produce a hot core water abundance of about (Ceccarelli et al., 1996; Rodgers & Charnley, 2003). Such abundances are indeed observed for high-mass protostars (van der Tak et al., 2006; Chavarría et al., 2010; Herpin et al., 2012), though not universally (Emprechtinger et al., 2013). Abundances reported for low-mass hot cores have so far not exceeded (Ceccarelli et al., 2000; Maret et al., 2002; Kristensen et al., 2010; Coutens et al., 2012). Are low-mass hot cores that much “drier” than expected?
Measuring the hot core water abundance in a protostar is not a trivial task, regardless of whether it is a low- or a high-mass source. Shocked gas tends to outshine the quiescent inner envelope (Melnick et al., 2000; Chavarría et al., 2010; Kristensen et al., 2010, 2012; Coutens et al., 2012; Emprechtinger et al., 2013), so one has to isolate the envelope emission from velocity-resolved spectra. Hot core abundances derived from spectrally unresolved data, such as from the Infrared Space Observatory (ISO; Ceccarelli et al., 2000; Maret et al., 2002), should therefore be treated with caution.
Another difficulty is the poorly known source structure on the spatial scales of the hot core: even if the column of quiescent hot water can be measured, there is no reliable column of hot H2 to compare against. Abundances of water and other molecules are typically computed by way of spherical envelope models with simple density profiles, constrained from single-dish dust continuum observations (Ceccarelli et al., 2000; van der Tak et al., 2000; Schöier et al., 2002; Maret et al., 2002; Coutens et al., 2012). Based on such a model, we previously derived a hot core abundance of for the Class 0 protostar NGC1333 IRAS2A (Kristensen et al., 2010; Liu et al., 2011). However, spherical models do not recover the density enhancements measured with continuum interferometry in the inner few 100 AU of various low-mass protostars (Jørgensen et al., 2004, 2005, 2007; Chiang et al., 2008). The low water abundances may thus merely be an artefact of the inaccuracy of the adopted source models on the spatial scales of the hot core.
Using interferometric observations of the – line of HO at 203 GHz ( K), Jørgensen & van Dishoeck (2010b) and Persson et al. (2012) measured hot water column densities for the three Class 0 protostars NGC1333 IRAS2A, 4A, and 4B. They also estimated H2 column densities from continuum interferometry on the same spatial scales to derive water abundances between a few and a few . However, these abundances are relative to the total amount of gas in the inner 100 AU, not relative to just the gas above 100 K. If a significant fraction of the material on these scales resides in an embedded disk or pseudo-disk, the bulk would be at lower temperatures and most water would be frozen out (Visser et al., 2009; Ilee et al., 2011).
In order to get additional constraints on the hot water in NGC1333 IRAS2A, we performed a 5.1-hr integration of the – lines of HO, HO, and HO at 1097 GHz with the Heterodyne Instrument for the Far-Infrared (HIFI; de Graauw et al., 2010) on the Herschel Space Observatory (Pilbratt et al., 2010).111Herschel is an ESA space observatory with science instruments provided by European-led Principal Investigator consortia and with important participation from NASA. This observation is part of the key program “Water in star-forming regions with Herschel” (WISH; van Dishoeck et al., 2011), which aims to study the physics and chemistry of water during star formation across a range of masses and evolutionary stages. HIFI has high enough spectral resolution to disentangle the quiescent and shocked gas, and the deep integration allows for a detection of HO.
This paper presents the observations (Sections 2 and 3) along with a detailed analysis (Section 4). We develop a scenario in which the observed emission originates in the same gas as the 203 GHz line, namely in a hot core with a radius of about 100 AU. Our definition of a “hot core” is fairly loose and includes all quiescent (i.e., non-shocked) material hotter than 100 K, regardless of whether it is part of the envelope or an embedded disk-like structure. A simple spherical model fails at reproducing both data sets simultaneously, so we perform a model-independent analysis to constrain the distribution of water within the hot core. Comparing the water column density against Herschel-HIFI C18O –8 and 10–9 data yields a lower limit on the water abundance of relative to H2. As concluded in Section 5, the hot core in IRAS2A does not appear to be as dry as previously estimated from pure spherical models.
2. Observations and Data Reduction
NGC1333 IRAS2A is a low-mass Class 0 protostar ( , K; Kristensen et al., 2012) located at a distance of 235 pc in Perseus at coordinates by (J2000; Hirota et al., 2008). Based on large-scale CO 3–2 maps, it is oriented close to edge on (Sandell et al., 1994). IRAS2A was observed on 2011 March 12 (obsid 1342215968) with HIFI on Herschel (Pilbratt et al., 2010; de Graauw et al., 2010) in double beam switch mode with a nod of . The primary targets were the – lines of ortho-HO and HO at 1097.365 and 1095.627 GHz in band 4 ( K). The full spectrum covers a range of 4 GHz in each sideband, including the – and – lines of HO and the 10–9 line of C18O (Table 1). The data were recorded in H and V polarization using both the wide-band spectrometer (WBS; 1.1 MHz resolution) and the high-resolution spectrometer (HRS; 0.5 MHz). The HIFI beam size at 1100 GHz is and the overall flux uncertainty is about 10% (Roelfsema et al., 2012).
The – line of HO was previously detected in IRAS2A after a 30-min integration (Kristensen et al., 2010). The current observation had a total exposure time of 5.1 hr in order to detect the HO line and to improve the decomposition of the various velocity components in the HO spectrum (Section 3). The longer integration time also puts a more sensitive upper limit on the HO line.
The data were reduced with HIPE v8.2.1 (Ott, 2010) and exported to CLASS222http://www.iram.fr/IRAMFR/GILDAS for analysis. The intensities were converted from antenna to main-beam temperature scale through a main-beam efficiency of 0.74 (Roelfsema et al., 2012). The H and V spectra were averaged after individual inspection. The final data reduction step was to subtract a linear baseline.
3. Results
| Species | Transition | Telescope/ | Observed | Model | Referencebb1: Kristensen et al. (2010); 2: this work; 3: Benz et al. (in prep.); 4: Persson et al. (2012); 5: F. Wyrowski (priv. comm.); 6: Yıldız et al. (2010) | ||||
|---|---|---|---|---|---|---|---|---|---|
| Instrument | (GHz) | (K) | s-1 | (arcsec) | Intensity | Intensity | |||
| p-HO | – | HIFI | 987.927 | 100.8 | 21.5 | 0.312 | 1 | ||
| p-HO | – | HIFI | 752.033 | 136.9 | 28.2 | 0.230 | 1 | ||
| o-HO | – | HIFI | 1153.127 | 249.4 | 18.4 | 0.352 | 1 | ||
| o-HO | – | HIFI | 1097.365 | 249.4 | 19.3 | cc for the broad and medium components is and K km s-1. | 0.342 | 2 | |
| p-HO | – | HIFI | 1893.687 | 410.4 | 11.2 | 0.005 | 3 | ||
| p-HO | – | HIFI | 994.675 | 100.6 | 21.3 | 0.005 | 1 | ||
| p-HO | – | PdBI | 203.408 | 203.7 | 0.83 | 42 | 4 | ||
| o-HO | – | HIFI | 1095.627 | 248.7 | 19.4 | 0.078 | 2 | ||
| o-HO | – | APEX | 390.608 | 322.0 | 16.0 | 0.205ddThe intensity predicted for a fictitious ALMA beam is 76.4 K km s-1 | 5 | ||
| o-HO | – | 489.054 | 429.6 | 0.83 | 331 | ||||
| o-HO | – | 692.079 | 727.6 | 0.83 | 1.74 | ||||
| p-HO | – | HIFI | 1107.167 | 53.1 | 19.2 | 0.007 | 2 | ||
| o-HO | – | HIFI | 1096.414 | 249.1 | 19.3 | 0.005 | 2 | ||
| C18O | 9–8 | HIFI | 987.560 | 237.0 | 21.5 | 0.043eeFor an H2O/CO ratio of unity above 100 K. Most of the observed C18O emission originates in gas below 100 K, which is not included in the model. | 6 | ||
| C18O | 10–9 | HIFI | 1097.163 | 289.7 | 19.3 | 0.035eeFor an H2O/CO ratio of unity above 100 K. Most of the observed C18O emission originates in gas below 100 K, which is not included in the model. | 2 |
3.1. New Data
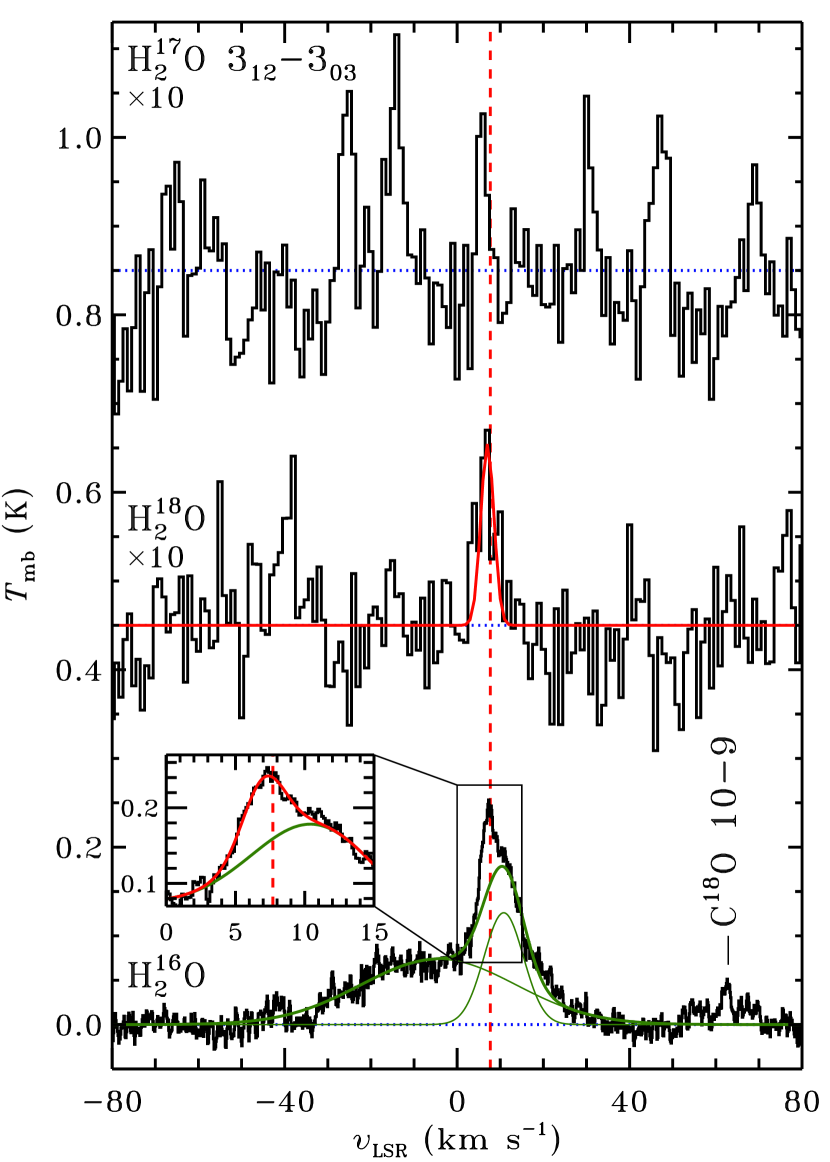
The full HIFI spectrum as recorded with the WBS backend is shown in Figures 6 and 7 in the appendix. The strongest feature is the – line of HO, peaking at 230 mK. The – spectrum for each water isotopolog is plotted in LABEL:312spectra. Thanks to the excellent signal-to-noise ratio from the long integration (8 mK rms in 0.5 km s-1 bins), the HO spectrum now shows a distinct narrow emission feature on top of the medium and broad features detected by Kristensen et al. (2010). The three components have full widths at half maximum (FWHMs) of , , and km s-1. Table 1 lists the integrated intensities. The broad and medium FWHMs are the same as those reported by Kristensen et al. for lower-excitation water lines. These components arise in shocked gas and are not considered here any further.
The HO spectrum shows a weak emission feature () in both polarization filters, with the same intensity in the WBS and HRS recordings. The JPL and CDMS spectral line databases (Pickett et al., 1998; Müller et al., 2001) show no other plausible features at this position in either the upper or the lower sideband. LABEL:312spectra shows a Gaussian fit with an FWHM fixed at 3.6 km s-1 (taken from the HO decomposition), because the feature is too weak for a reliable independent measurement of its width. The constrained fit has a peak intensity of mK and an integrated intensity of mK km s-1 (Table 1).
The HO spectrum in LABEL:312spectra shows an apparent emission feature blueshifted by 2 km s-1 from the source velocity, along with four features of similar strength at larger offsets. Three of them could represent lines of CH2DOH (–294 K), which has been detected before in single-dish spectra of IRAS2A (Parise et al. 2006; see also Figures 6 and 7). The JPL and CDMS databases offer no plausible identification for the fourth feature. We consider the – line undetected in HO, but our analysis in Section 4 is unaffected by the question of weather it is real or not. The potential CH2DOH lines are not considered any further.
The only other confirmed feature in the entire spectral setting is the C18O 10–9 line at 1097.163 GHz. It appears to be a blend of a narrow and a medium component, but the detection is too weak for an accurate decomposition. The intensity integrated over the full profile is mK km s-1, split roughly halfway between the two components. Narrow and medium features have been detected previously in various low- and high- CO isotopolog lines (Yıldız et al., 2010). The C18O 10–9 line is analyzed as part of a larger sample of lines and sources by San Jose-Garcia et al. (2013) and Yıldız et al. (2013).
The full spectrum in Figures 6 and 7 appears to contain a few more lines, but their nature is uncertain and not of interest to this paper. We merely mention two possible identifications: H2CO at 1094.590 GHz ( K) and CH3OH at 1095.063 GHz ( K). Both species have been detected previously in single-dish and interferometric studies of IRAS2A (Maret et al., 2005; Parise et al., 2006; Jørgensen et al., 2007).
3.2. Complementary Data
IRAS2A has been targeted in various other water lines with Herschel. Visser et al. (2012) detected about a dozen spectrally unresolved lines with the PACS instrument (60–180 micron; up to 1750 K), attributed to shocked gas on 100-1000 AU scales and unrelated to the narrow emission analyzed here. No narrow emission has been detected in any of the water lines previously observed with HIFI (Kristensen et al., 2010). Upper limits on such emission may be useful and are reported in Table 1. Another HIFI upper limit is available for HO – at 1894 GHz, observed alongside C+ 2P3/2–2P1/2 (Benz et al. in prep.). In most cases, the upper limit in Table 1 is the limit computed from the rms noise in 0.5 km s-1 bins. This method does not work for the HO – and – lines, where the broad and medium emission features can hide a narrow feature stronger than three times the noise. Instead, we forced a three-Gaussian fit on these spectra, with the position and width of the narrow feature fixed at the values found for the – line. The adopted upper limit is twice the integrated intensity of the force-fitted narrow component. In doing so, we assume the broad and medium components do not shield any narrow emission. The –, –, and – lines show narrow absorption due to cold water vapor in the outer envelope (Kristensen et al., 2010) and are excluded from our analysis.
Ground-based observations exist for two HO lines: – at 203 GHz ( K) and – at 391 GHz ( K). The latter was undetected with APEX in a beam, with a upper limit of 410 mK km s-1 (Table 1; F. Wyrowski priv. comm.). Persson et al. (2012) detected spatially resolved compact and extended emission in the – line with the Plateau de Bure Interferometer (PdBI). The extended component is associated with the outflow and is ignored here. The compact component has an FWHM of km s-1, comparable to the narrow component in the HO – spectrum in LABEL:312spectra. The compact PdBI component has an integrated intensity of 0.98 Jy km s-1 or 42 K km s-1. Its spatial extent was marginally resolved to a diameter of , probing material out to a radius of 100 AU. Persson et al. attributed the compact emission to a flattened inner envelope or pseudo-disk dominated by infall rather than rotation.
4. Analysis
4.1. Spherical Model
The HIFI – lines have upper-level energies of 249 K. The bulk of the water in IRAS2A is present at temperatures below 100 K, where it generally exists as ice rather than vapor. The low gas-phase abundance in the cold envelope (; Kristensen et al., 2010; Liu et al., 2011), coupled with the low excitation temperatures, falls orders of magnitude shy of reproducing the observed narrow intensities (van Kempen et al., 2008).
That leaves two options for the narrow – emission: a maser or the hot core. Furuya et al. (2003) observed maser emission towards IRAS2A at 22 GHz, with intensities varying by an order of magnitude on timescales of about a year. The maser lines were seen sometimes at the source velocity and sometimes blue-shifted by a few km s-1, with FWHMs from 1.2 to 2.3 km s-1. The HIFI – and PdBI – spectra show no such blue-shifted emission and the emission at the source velocity is 2–3 times as broad as the 22 GHz maser lines. Furthermore, our two epochs of HIFI data (LABEL:312spectra and Kristensen et al., 2010) show no signs of variability on a one-year baseline. Hence, we conclude that the narrow – emission is not associated with maser activity. Persson et al. (2012) employed similar arguments to reach the same conclusion for their PdBI data.
Instead, the narrow HIFI and PdBI lines are thermal and likely originate in the inner 100 AU of IRAS2A, in quiescent gas above 100 K. If the circumstellar material in IRAS2A is approximated as a spherical envelope with a power-law density profile, the 100 K radius lies at 94 AU (Kristensen et al., 2012). While this matches the size of the emitting region seen with the PdBI, continuum interferometry of IRAS2A has shown that the assumptions of spherical symmetry and a single power-law density profile break down inside a radius of or 350 AU (Jørgensen et al., 2004, 2005).
A simple test reveals that the spherical model also fails to reproduce the HIFI and PdBI data simultaneously. The test consists of synthesizing the – and – spectra from a step abundance profile, as described in detail by van Kempen et al. (2008). Kristensen et al. (2012) constructed a source model for IRAS2A to fit the spectral energy distribution and sub-millimeter brightness profiles. The model envelope has a total mass of 5.1 , distributed along an power law. The temperatures of the gas and dust are coupled and decrease from 250 K at the inner edge (36 AU) to 10 K at the outer edge (17 000 AU). The step abundance profile consists of a high abundance above 100 K (at 94 AU) and a lower abundance below 100 K. The HIFI and PdBI emission originate above 100 K, so the question we want to answer is whether the spherical envelope model can reproduce both data sets with a single .
The molecular excitation and line emission are computed with the 1D radiative transfer code RATRAN (Hogerheijde & van der Tak, 2000). This is a standard approach for interpreting molecular line spectra; see e.g. Yıldız et al. (2010), Liu et al. (2011), and Coutens et al. (2012) for recent examples of C18O, HDO, and H2O. We set the gas-to-dust ratio to 100 and use OH5 opacities (Ossenkopf & Henning, 1994), appropriate for dust grains with thin ice mantles. The ortho/para ratio of H2 is thermalized and that of water is fixed at 3. Collision rates are taken from Dubernet et al. (2006, 2009) and Daniel et al. (2010, 2011) as compiled in the LAMDA database (Schöier et al., 2005). The outer HO abundance does not affect the – and – lines and is fixed at , derived from absorption seen with HIFI in lower rotational lines of water (Kristensen et al., 2010; Liu et al., 2011). The inner HO abundance is varied from to ( to for HO) to cover the full range from a “dry” to a “wet” hot core. Finally, the synthetic spectra are convolved to the appropriate beam size and compared to the available observations.

LABEL:ratran shows the convolved intensities for the HO – and – lines as function of the inner abundance. The horizontal dotted lines and bars mark the observed intensities and uncertainties: red for – and black for –. The abundances required to fit each line individually are marked by the vertical dotted lines and bars. Within the confines of the spherical envelope model, the HO – spectrum from LABEL:312spectra requires an inner HO abundance of . However, this underproduces the observed PdBI line intensity by a factor of 200. Matching the PdBI line requires a much higher inner HO abundance of , but then the – line comes out a factor of 6 too strong. The estimated uncertainty on the – intensity for HO is 17% (10% calibration, 14% statistical; Sections 2 and 3.1), so a factor of 6 is away. The RATRAN test clearly fails: a spherical envelope model with a single power-law density profile, such as used in previous attempts to derive hot core water abundances, cannot reproduce the single-dish and interferometric hot water observations simultaneously.
4.2. LTE Analysis
The mismatch of best-fit abundances to single-dish and interferometric data has also been seen for methanol in IRAS2A (Jørgensen et al., 2005) and for deuterated water in the Class 0 protostar IRAS (Coutens et al., 2012; Persson et al., 2013). We thus have several pieces of evidence that simple spherical models break down on the spatial scales of the hot core. Until more appropriate source models can be generated – for example from sub-arcsecond PdBI and ALMA observations of protostellar dust and gas – it is better to take a step back and see what we can learn about hot water in IRAS2A irrespective of the underlying density and temperature structure.
4.2.1 PdBI Emission: Optically Thin
In analyzing the PdBI data, Persson et al. (2012) assumed optically thin emission in local thermodynamic equilibrium (LTE) and considered gas temperatures between 50 and 250 K. The – line has a critical density of a few cm-3. The critical density of the HIFI – line is about a factor of 1000 higher, but with densities in the inner envelope easily exceeding cm-3 (Visser et al., 2009), the assumption of LTE is probably justified and we adopt it here as well.
The dust and gas temperatures are likely coupled at these high densities, so temperatures below 100 K can be excluded because of freeze-out. This also means that the emitting region resolved with the PdBI represents the entire reservoir of quiescent (i.e., non-shocked) hot gas in IRAS2A. The PdBI observations have a field of view of , a little larger than the HIFI beam of at 1097 GHz. Hence, if any other hot gas had been present within the HIFI beam but outside the central , it would have been detected with the PdBI.
Following Goldsmith & Langer (1999), the optical depth of a molecular line is
| (1) |
with the frequency of the transition, the Einstein A coefficient, and the observed FWHM. In LTE, the upper-level column density is
| (2) |
with the total column density, the degeneracy, and the partition function. The PdBI line is optically thin with . For a water ortho/para ratio of 3, the observed PdBI intensity requires cm-2 regardless of the exact temperature between 100 and 250 K (Persson et al., 2012). The – lines have Einstein A coefficients a few thousand times faster than the – line (Table 1) and are optically thick for all three isotopologs. For example, at 100 K, for HO, 34 for HO, and 19 000 for HO. The optical depths decrease by about 50% if the temperature is increased to 250 K.
4.2.2 HIFI Emission: Optically Thick
If the HIFI emission in all three isotopologs is indeed optically thick and characterized by the same temperature, the – lines would have had the same intensities. This is clearly inconsistent with the data (LABEL:312spectra). However, the size of the optically thick region (approximately the surface) may be different for each isotopolog, leading to different beam-filling factors. As argued below, this can explain the factor of 4.4 difference in observed intensities for HO and HO as well as the non-detection of HO.
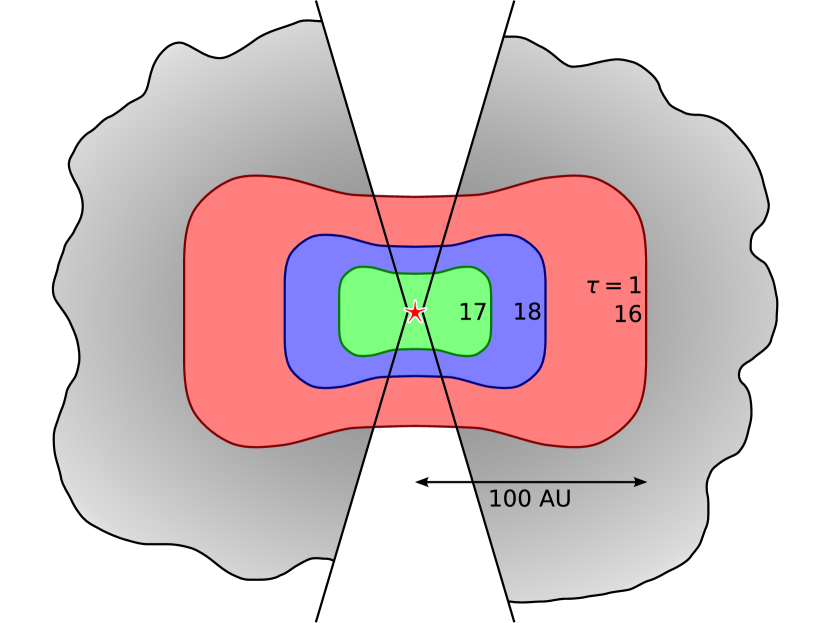
LABEL:tau=1 shows a sketch of the flattened inner envelope of IRAS2A with the different emitting areas for the optically thick – lines. The HO – line observed with the PdBI is optically thin and traces the entire hot core to its outer radius of 100 AU. The extreme optical depth of 19 000 for HO – means that its surface, measured from the outside, essentially lies right at the hot core’s outer edge. HO therefore emits at close to 100 K. This is somewhat lower than the excitation temperature of 170 K assumed by Persson et al. (2012), but the difference has no substantial effect on our analysis. The temperature structure on these small scales is unknown, so we assume for simplicity that HO and HO also emit at 100 K. The radius of the HO surface then has to be a factor of smaller ( AU) than that of HO (LABEL:tau=1). The size difference would be smaller if we take a higher temperature for HO, but the available data do not allow for a more precise estimate.
4.2.3 Water Distribution
For an HO column density of cm-2, the optical depth in the HO – line is 34 at 100 K (Equation 1). If the water is distributed uniformly throughout the hot core, the surface for HO would lie at th of the way in from the outer edge at 100 AU, i.e., at AU. The surface has to be at AU to explain the observed HO/HO intensity ratio from LABEL:312spectra, so the water cannot be distributed uniformly with radius.
A power-law distribution, , offers a simple solution. This does not necessarily imply an abundance gradient, because it can be the total gas density itself that increases toward smaller radii (Visser et al., 2009). We need to know the inner radius of the water reservoir in order to compute the power-law exponent , but the inner radius cannot be measured from the PdBI data. A rough estimate would be 0.1 AU, the typical inner edge of accretion disks around T Tauri stars (Akeson et al., 2005). The requirement that only th (3%) of the HO column lie at AU then yields . The slope steepens to 1.4 if the inner radius is placed at 1 AU instead.
LABEL:tau312 shows the resulting optical depth profiles ( as function of ) for HO and HO. The surface for HO (not plotted) lies at 100 AU, consistent with LABEL:tau=1. HO reaches at 47 AU, as needed to fit the – observations. The surface for the least abundant isotopolog, HO, ends up at 9.4 AU, providing 110 times more beam dilution than experienced by HO. This places the observable HO – intensity about a factor of 10 below the upper limit from LABEL:312spectra and Table 1.

4.2.4 Summary of LTE Analysis
In summary, the – emission observed with HIFI and the – emission observed with the PdBI can be explained simultaneously through an LTE analysis. The PdBI emission is spatially resolved and marks the outer boundary of the hot core in IRAS2A, with a radius of about 100 AU. The – line is optically thin and implies column densities of cm-2 for HO, cm-2 for HO, and cm-2 for HO (Persson et al., 2012). The 1097 GHz HIFI lines are optically thick in all three isotopologs. The observed line intensities are nonetheless different because each isotopolog becomes optically thick at a different radius, so that HO experiences less beam dilution than HO and HO (Figures 3 and 4).
The precise three-dimensional distribution of water within the hot core cannot be ascertained from the HIFI and PdBI data. The simplest solution is a radial power-law dependence, , with an exponent of about 1.2. We emphasize, however, that this power law is nothing more than a convenient approximation to the real 3D source structure in the hot core. The spherical radiative transfer model from Section 4.1 fails not because its density power law in the inner 100 AU is a little too steep, but because the assumption of spherical profiles for the density, temperature, and abundance does not hold on scales smaller than a few 100 AU. The implications of this conclusion are discussed in Section 4.5.
4.3. Dust Shielding and Observable Line Intensities
The scenario from the previous section matches the line intensity ratios for the HIFI – isotopolog lines, but what about the absolute intensities of those and other lines? For optically thick emission in LTE, the intrinsic line intensity is the intensity of a blackbody at the gas temperature:
| (3) |
The optically thin equation is taken from Goldsmith & Langer (1999):
| (4) |
with all symbols as defined as in Equation 1. The observable intensity is the intrinsic intensity divided by the relevant beam-filling factor.
For a gas temperature of 100 K, the optically thick HO – emission has an integrated intensity of 320 K km s-1 before applying beam dilution. The beam dilution factor is , reducing the intensity to 590 mK km s-1. This is still a factor of 1.7 stronger than observed (Table 1), which we attribute to extinction by dust. The implied optical depth of the dust is at 1097 GHz.
Single-dish and interferometric continuum data of IRAS2A provide a lower and upper bound to the observed dust optical depth. The single-dish data, processed through the spherical model of Kristensen et al. (2012), give a pencil-beam H2 column density of cm-2 and at 1097 GHz. The interferometric data reveal an embedded pseudo-disk with a gas mass of 0.056 within 100 AU (Jørgensen et al., 2009), which translates to . The actual optical depth encountered by molecular line emission from the hot core has to lie between these two limits, so a value of 0.55 is quite reasonable.
The final test is to check whether our hot core scenario also matches the upper limits on narrow emission in other water lines. Again assuming a gas temperature of 100 K, we repeat the above exercise to estimate intrinsic line intensities. Most lines are optically thick, so the location of their surfaces is calculated for the same power-law water distribution as in LABEL:tau312. The observable line fluxes, corrected for beam dilution and dust extinction (based on OH5 opacities; Ossenkopf & Henning, 1994), are listed in Table 1. The predicted intensity of the HO – line at 988 GHz is right at the upper limit of how much narrow emission can be hidden in the observed broad and medium components. All other predictions fall below the upper limits. Our scenario of a 100 AU hot core with a power-law distribution of water (Figures 3 and 4) is therefore consistent with the combined PdBI, APEX, and Herschel data sets.
The high optical depths for the water isotopolog lines accessible with HIFI are not unique to IRAS2A. For example, spatially resolved data from the Atacama Large Millimeter/submillimeter Array (ALMA) show that the column density of hot water in IRAS is a factor of 30 higher than in IRAS2A (Persson et al., 2013). The HIFI water lines observed in this source (Coutens et al., 2012) therefore likely suffer from the same problem. A combined analysis of the ALMA and HIFI data is recommended for the best overall understanding.
The conclusions from this paper can be tested with ALMA, in particular regarding the excitation and spatial distribution of hot water. The – line of HO at 692 GHz ( K) is accessible in band 9 and has been observed in the hot core of IRAS (Persson et al., 2013). Within a few years, receivers in band 8 (385–500 GHz) will be able to access the – and – lines of HO at 391 and 489 GHz ( and 430 K). All three lines are predicted to be optically thin in IRAS2A and strong enough to be observable (Table 1). ALMA’s spatial resolution of or better in bands 8 and 9 will enable an investigation of the hot water in IRAS2A at an unprecedented level of detail.
4.4. Water Abundance and Deuteratium Fractionation in the Hot Core
Persson et al. (2012) derived an HO abundance of in the inner 100 AU of IRAS2A by comparing their HO column density from the PdBI to the dust mass measured in a similar beam by Jørgensen et al. (2009). However, this is not the same as the hot core abundance: the simple picture painted in LABEL:tau=1 belies a more complicated three-dimensional structure, in which much of the gas and dust may be below 100 K. We present here an alternative approach to derive the real hot core water abundance, i.e., relative to only the gas above 100 K.
H2 cannot be observed directly, so CO is used as a proxy for the hot core mass. The best available tracers of the hot CO column are the optically thin 9–8 and 10–9 lines of C18O ( and 290 K), observed with HIFI in IRAS2A. There are two caveats, however: the hot CO abundance itself is uncertain by a factor of a few and some fraction of the 9–8 and 10–9 line intensities originates at temperature below 100 K (Yıldız et al., 2010, 2013). We address the latter issue first.

The 9–8 and 10–9 lines have critical densities of about cm-3, so the assumption of LTE is justified. Invoking again an excitation temperature of 100 K, Equation 4 is used to predict the C18O column density required to match a certain line intensity. In the hypothetical case that all of the observed 9–8 and 10–9 emission arises in the hot core (about 150 mK km s-1 for each line; Table 1), we get cm-2 (corrected for beam dilution and dust extinction) or an H2O/CO abundance ratio of 0.2. LABEL:h2o/co shows how the derived H2O/CO ratio changes if only a certain fraction of the 9–8 and 10–9 emission arises in the hot core. For example, the H2O/CO ratio is 0.5 for a fraction of 50%.
Full radiative transfer calculcations on the spherical envelope model of IRAS2A show that about 10–30% of the observed C18O 9–8 and 10–9 emission originates above 100 K (Yıldız et al., 2010, 2013). This range is marked by the shaded area in LABEL:h2o/co and implies an H2O/CO abundance between 0.8 and 3.6. However, as noted in Section 4.1, the spherical model is reliable only for radii larger than about 350 AU, where the dust temperature is 45 K (Kristensen et al., 2012). This can be used for a firm limit: the real fraction of 9–8 and 10–9 emission arising above 100 K cannot be larger than the fraction arising above 45 K in the spherical radiative transfer models. That latter fraction is 65–80% for the 9–8 line and 90% for the 10–9 line (Yıldız et al., 2010, 2013). According to LABEL:h2o/co, the lower limit on the hot core H2O/CO abundance ratio is then 0.25.
Yıldız et al. (2010) derived a C18O abundance of ( for CO) for all gas above 25 K, a factor of 3 below the carbon and oxygen elemental abundances. This value is well constrained for the bulk of the gas between 25 and 100 K, but remains somewhat uncertain for the hot core above 100 K: the hot core represents only a small mass fraction and contributes little emission even to the C18O 9–8 and 10–9 lines (Yıldız et al., 2010, 2013), so varying the hot core CO abundance by a factor of a few would not affect the overall line intensities significantly.
Taking the CO abundance of in IRAS2A at face value, the results from LABEL:h2o/co yield a lower limit to the hot core water abundance of . This is a conservative estimate, as the actual fraction of C18O 9–8 and 10–9 emission arising above 100 K is likely to be smaller than the fraction of 90% derived from the 45 K cutoff above. The available PdBI and HIFI observations are entirely consistent with a water abundance of (1– in the hot core, as expected for the evaporation of water ice above 100 K (Rodgers & Charnley, 2003) and as typically found in high-mass protostars (van der Tak et al., 2006; Chavarría et al., 2010; Herpin et al., 2012). The uncertainties in the H2O/CO ratio and the hot core CO abundance also allow for water abundances down to about . Hot water abundances of less than , as derived previously for IRAS2A (Kristensen et al., 2010; Liu et al., 2011) or reported for other low-mass sources (Ceccarelli et al., 2000; Maret et al., 2002; Coutens et al., 2012), are possible only if the inner CO abundance is significantly overpredicted by spherical models.
Lastly, we revisit the question of deuterium fractionation in the hot core of IRAS2A. Liu et al. (2011) presented five rotational lines of HDO measured with single-dish facilities. The best tracer of hot HDO is the – line at 226 GHz with an upper-level energy of 168 K. Once more invoking LTE at 100 K, the observed intensity of 0.50 K km s-1 translates to an HDO column density of cm-2 (Equation 4). Liu et al. derived a hot HDO/H2O ratio of based on a preliminary water abundance of , which is now known to be too low. A more reliable deuterium fraction can be computed directly from the water column density of Persson et al. (2012), bypassing the uncertainties in the H2O/CO ratio and the CO abundance. With , the new HDO/H2O abundance ratio in the hot core of IRAS2A is . This is the same level of deuterium fractionation as in IRAS (Persson et al., 2013) and a factor of 2 higher than the upper limit for NGC1333 IRAS4B (Jørgensen & van Dishoeck, 2010a), both of which are based on interferometric data alone.
4.5. Implications
Continuum interferometry of IRAS2A and other low-mass embedded protostars has revealed the presence of a compact density enhancement, typically on 100 AU scales, that is not accounted for by simple spherical envelope models (Jørgensen et al., 2004, 2005, 2007; Chiang et al., 2008). For a given column density of hot water, correcting for the higher density would lead to a lower water abundance than what is found from the spherical models. Our conclusion in the previous section is exactly opposite: the new hot water abundance, based on the combined PdBI and HIFI data for HO and C18O, is higher than that obtained previously from single-dish data only.
The reason for this apparent discrepancy is the temperature structure in the inner 100 AU of IRAS2A. With an HO column density of cm-2 and an HO abundance of or higher, the column density of hot H2 is cm-2 or lower. The total gas column within 100 AU, based on continuum interferometry, is cm-2 (Jørgensen et al., 2009). From this we reach the same conclusion as Persson et al. (2012): only a limited fraction of all quiescent material inside of 100 AU is hotter than 100 K. Persson et al. derived a hot fraction of 4% for an assumed water abundance of . Given the uncertainty in the water abundance, the actual hot fraction can be anything from 2 to 20%.
The corresponding physical picture is not that of a spherical hot core, because in such a geometry it would be difficult to have the bulk of the material at temperatures below 100 K, while still keeping some hotter gas out to 100 AU. An embedded disk or pseudo-disk is more likely, with a few per cent of its mass heated to above the evaporation temperature of water. This scenario is qualitatively consistent with predictions from evolutionary models (Brinch et al., 2008; Visser et al., 2009; Ilee et al., 2011; Harsono et al., 2013). Specifically, it suggests that the bulk of the disk starts cold, with little water ice evaporating as material accretes from the larger-scale envelope (Visser et al., 2009).
Regarding the chemistry, the lower limit on the hot core water abundance is consistent with the value of expected from the evaporation of water ice above 100 K. Stäuber et al. (2006) presented models of hot and cold envelope chemistry in the presence of UV and X-ray fields. For an X-ray flux of erg s-1 cm-2 (equivalent to an isotropic X-ray luminosity of erg s-1 at 100 AU), the hot water abundance is reduced from to on a timescale of yr. However, the gas above 100 K is essentially in freefall, leading to a dynamical timescale of perhaps only 100 yr (Schöier et al., 2002; Visser et al., 2009). That is still long enough for water to evaporate from the grains, but not for it to be destroyed by X-rays. Our relatively high hot water abundance can be sustained by continuous replenishment of icy grains from further out in the envelope.
Several complex organic species have been observed in IRAS2A, including CH3OH, CH3CN, and CH3OCH3 (Maret et al., 2005; Parise et al., 2006; Bottinelli et al., 2007; Jørgensen et al., 2007; Persson et al., 2012). The line widths of a few km s-1 and the excitation temperatures of about 100 K mark IRAS2A as a prototypical hot core or hot corino. This is in contrast to other protostars such as NGC1333 IRAS4A and 4B, where the observed complex organics appear to be associated with outflow-induced shocks (Jørgensen et al., 2007). The aforementioned dynamical timescale of 100 yr in the hot core of IRAS2A is too short for the formation of complex organics in the gas phase after evaporation of the icy grain mantles. Instead, the organics observed in IRAS2A are likely to be so-called first-generation species (Herbst & van Dishoeck, 2009), formed via grain-surface chemistry in the cold outer envelope and released into the gas phase in the hot core.
5. Conclusions
This paper presents Herschel-HIFI spectra of the – lines of HO, HO, and HO (1097 GHz; K) in the low-mass Class 0 protostar NGC1333 IRAS2A. The deep 5.1-hr integration brings out a narrow emission feature ( km s-1) in the HO spectrum on top of two broader components. The HO spectrum shows a narrow feature only and the line is not detected in HO. The broad components seen in HO are associated with shocked gas and are not discussed here further.
Guided by spatially resolved HO – emission detected with the PdBI (Persson et al., 2012), we attribute the narrow emission from the HIFI HO and HO spectra to a hot core ( K) with a radius of about 100 AU. A spherical envelope model with a power-law density profile and a step abundance for water is unable to reproduce the HIFI and PdBI intensities simultaneously. This is consistent with previous comparisons between single-dish and interferometric data (Jørgensen et al., 2004, 2005) and is additional proof that these simple models cannot be used for an accurate analysis of protostellar hot cores.
We present an alternative scenario where the HIFI lines are optically thick and the difference in observed intensities is due to different areas of the surfaces of the three isotopologs. The hot core is moderately shielded by dust with an optical depth of 0.55 at 1097 GHz. The beam-diluted and extinction-corrected emission from the hot core matches the intensities of the PdBI line, the two detected – HIFI lines, as well as upper limits on various other lines targeted with HIFI.
Because the detected HIFI emission is optically thick, the column density of water in the hot core (100 AU radius) is unchanged from the values of cm-2 for HO or cm-2 for HO derived by Persson et al. (2012). We derive CO column densities above 100 K from C18O –8 and 10–9, and find a conservative lower limit to the H2O/CO abundance ratio of 0.25. The hot CO abundance is (Yıldız et al., 2010), so the water abundance in the hot core can be anywhere from to . Abundances of less than , as previously derived from a spherical model, are only possible if the CO abundance above 100 K is significantly lower than that between 25 and 100 K. The revised water abundance implies a hot HDO/H2O ratio of , an order of magnitude lower than earlier estimates and similar to interferometric HDO/H2O measurements in other Class 0 protostars.
Appendix A Full Spectrum
The full spectrum from our Herschel-HIFI observations of NGC1333 IRAS2A covers frequencies from 1094 to 1098 GHz in the lower sideband (LSB) and 1106 to 1110 GHz in the upper sideband (USB). With a total integration time of 5.1 hr, this is one of the deepest spectra obtained with Herschel for a low-mass embedded protostar. The full spectrum, rebinned to a velocity resolution of 1.0 km s-1, is shown in Figures 6 and 7. The molecular line frequencies from Table 1 are red-shifted by the source velocity of 7.7 km s-1 and marked with dotted lines. Also marked are the positions of six other transitions located within the two sidebands: one of H2CO, one of CH3OH, and four of CH2DOH.


References
- Akeson et al. (2005) Akeson, R. L., Walker, C. H., Wood, K., et al. 2005, ApJ, 622, 440
- André et al. (2000) André, P., Ward-Thompson, D., & Barsony, M. 2000, Protostars and Planets IV, 59
- Bottinelli et al. (2007) Bottinelli, S., Ceccarelli, C., Williams, J. P., & Lefloch, B. 2007, A&A, 463, 601
- Brinch et al. (2008) Brinch, C., Hogerheijde, M. R., & Richling, S. 2008, A&A, 489, 607
- Ceccarelli (2004) Ceccarelli, C. 2004, in ASP Conf. Ser. 323: Star Formation in the Interstellar Medium: In Honor of David Hollenbach, ed. D. Johnstone, F. C. Adams, D. N. C. Lin, D. A. Neufeld, & E. C. Ostriker (San Francisco: ASP), 195
- Ceccarelli et al. (2000) Ceccarelli, C., Castets, A., Caux, E., et al. 2000, A&A, 355, 1129
- Ceccarelli et al. (1996) Ceccarelli, C., Hollenbach, D. J., & Tielens, A. G. G. M. 1996, ApJ, 471, 400
- Chavarría et al. (2010) Chavarría, L., Herpin, F., Jacq, T., et al. 2010, A&A, 521, L37
- Chiang et al. (2008) Chiang, H.-F., Looney, L. W., Tassis, K., Mundy, L. G., & Mouschovias, T. C. 2008, ApJ, 680, 474
- Coutens et al. (2012) Coutens, A., Vastel, C., Caux, E., et al. 2012, A&A, 539, A132
- Daniel et al. (2011) Daniel, F., Dubernet, M.-L., & Grosjean, A. 2011, A&A, 536, A76
- Daniel et al. (2010) Daniel, F., Dubernet, M.-L., Pacaud, F., & Grosjean, A. 2010, A&A, 517, A13
- de Graauw et al. (2010) de Graauw, T., Helmich, F. P., Phillips, T. G., et al. 2010, A&A, 518, L6
- Dubernet et al. (2009) Dubernet, M.-L., Daniel, F., Grosjean, A., & Lin, C. Y. 2009, A&A, 497, 911
- Dubernet et al. (2006) Dubernet, M.-L., Daniel, F., Grosjean, A., et al. 2006, A&A, 460, 323
- Emprechtinger et al. (2013) Emprechtinger, M., Lis, D. C., Rolffs, R., et al. 2013, ApJ, 765, 61
- Furuya et al. (2003) Furuya, R. S., Kitamura, Y., Wootten, A., Claussen, M. J., & Kawabe, R. 2003, ApJS, 144, 71
- Goldsmith & Langer (1999) Goldsmith, P. F., & Langer, W. D. 1999, ApJ, 517, 209
- Harsono et al. (2013) Harsono, D., Visser, R., Bruderer, S., van Dishoeck, E. F., & Kristensen, L. E. 2013, A&A, subm.
- Herbst & van Dishoeck (2009) Herbst, E., & van Dishoeck, E. F. 2009, ARA&A, 47, 427
- Herpin et al. (2012) Herpin, F., Chavarría, L., van der Tak, F., et al. 2012, A&A, 542, A76
- Hirota et al. (2008) Hirota, T., Bushimata, T., Choi, Y. K., et al. 2008, PASJ, 60, 37
- Hogerheijde & van der Tak (2000) Hogerheijde, M. R., & van der Tak, F. F. S. 2000, A&A, 362, 697
- Ilee et al. (2011) Ilee, J. D., Boley, A. C., Caselli, P., et al. 2011, MNRAS, 417, 2950
- Jørgensen et al. (2005) Jørgensen, J. K., Bourke, T. L., Myers, P. C., et al. 2005, ApJ, 632, 973
- Jørgensen et al. (2004) Jørgensen, J. K., Hogerheijde, M. R., van Dishoeck, E. F., Blake, G. A., & Schöier, F. L. 2004, A&A, 413, 993
- Jørgensen & van Dishoeck (2010a) Jørgensen, J. K., & van Dishoeck, E. F. 2010a, ApJ, 725, L172
- Jørgensen & van Dishoeck (2010b) Jørgensen, J. K., & van Dishoeck, E. F. 2010b, ApJ, 710, L72
- Jørgensen et al. (2009) Jørgensen, J. K., van Dishoeck, E. F., Visser, R., et al. 2009, A&A, 507, 861
- Jørgensen et al. (2007) Jørgensen, J. K., Bourke, T. L., Myers, P. C., et al. 2007, ApJ, 659, 479
- Kristensen et al. (2010) Kristensen, L. E., Visser, R., van Dishoeck, E. F., et al. 2010, A&A, 521, L30
- Kristensen et al. (2012) Kristensen, L. E., van Dishoeck, E. F., Bergin, E. A., et al. 2012, A&A, 542, A8
- Liu et al. (2011) Liu, F., Parise, B., Kristensen, L., et al. 2011, A&A, 527, A19
- Maret et al. (2002) Maret, S., Ceccarelli, C., Caux, E., Tielens, A. G. G. M., & Castets, A. 2002, A&A, 395, 573
- Maret et al. (2005) Maret, S., Ceccarelli, C., Tielens, A. G. G. M., et al. 2005, A&A, 442, 527
- Melnick et al. (2000) Melnick, G. J., Ashby, M. L. N., Plume, R., et al. 2000, ApJ, 539, L87
- Müller et al. (2001) Müller, H. S. P., Thorwirth, S., Roth, D. A., & Winnewisser, G. 2001, A&A, 370, L49
- Ossenkopf & Henning (1994) Ossenkopf, V., & Henning, T. 1994, A&A, 291, 943
- Ott (2010) Ott, S. 2010, in ASP Conf. Ser. 434: Astronomical Data Analysis Software and Systems XIX, ed. Y. Mizumoto, K.-I. Morita, & M. Ohishi (San Francisco: ASP), 139
- Parise et al. (2006) Parise, B., Ceccarelli, C., Tielens, A. G. G. M., et al. 2006, A&A, 453, 949
- Persson et al. (2012) Persson, M. V., Jørgensen, J. K., & van Dishoeck, E. F. 2012, A&A, 541, A39
- Persson et al. (2013) Persson, M. V., Jørgensen, J. K., & van Dishoeck, E. F. 2013, A&A, 549, L3
- Pickett et al. (1998) Pickett, H. M., Poynter, R. L., Cohen, E. A., et al. 1998, J. Quant. Spec. Radiat. Transf., 60, 883
- Pilbratt et al. (2010) Pilbratt, G. L., Riedinger, J. R., Passvogel, T., et al. 2010, A&A, 518, L1
- Rodgers & Charnley (2003) Rodgers, S. D., & Charnley, S. B. 2003, ApJ, 585, 355
- Roelfsema et al. (2012) Roelfsema, P. R., Helmich, F. P., Teyssier, D., et al. 2012, A&A, 537, A17
- San Jose-Garcia et al. (2013) San Jose-Garcia, I., Mottram, J. C., Kristensen, L. E., et al. 2013, A&A, in press (arXiv: 1301.4658)
- Sandell et al. (1994) Sandell, G., Knee, L. B. G., Aspin, C., Robson, I. E., & Russell, A. P. G. 1994, A&A, 285, L1
- Schöier et al. (2002) Schöier, F. L., Jørgensen, J. K., van Dishoeck, E. F., & Blake, G. A. 2002, A&A, 390, 1001
- Schöier et al. (2005) Schöier, F. L., van der Tak, F. F. S., van Dishoeck, E. F., & Black, J. H. 2005, A&A, 432, 369
- Stäuber et al. (2006) Stäuber, P., Jørgensen, J. K., van Dishoeck, E. F., Doty, S. D., & Benz, A. O. 2006, A&A, 453, 555
- van der Tak et al. (2000) van der Tak, F. F. S., van Dishoeck, E. F., & Caselli, P. 2000, A&A, 361, 327
- van der Tak et al. (2006) van der Tak, F. F. S., Walmsley, C. M., Herpin, F., & Ceccarelli, C. 2006, A&A, 447, 1011
- van Dishoeck & Blake (1998) van Dishoeck, E. F., & Blake, G. A. 1998, ARA&A, 36, 317
- van Dishoeck et al. (2011) van Dishoeck, E. F., Kristensen, L. E., Benz, A. O., et al. 2011, PASP, 123, 138
- van Kempen et al. (2008) van Kempen, T. A., Doty, S. D., van Dishoeck, E. F., Hogerheijde, M. R., & Jørgensen, J. K. 2008, A&A, 487, 975
- Visser et al. (2009) Visser, R., van Dishoeck, E. F., Doty, S. D., & Dullemond, C. P. 2009, A&A, 495, 881
- Visser et al. (2012) Visser, R., Kristensen, L. E., Bruderer, S., et al. 2012, A&A, 537, A55
- Walmsley & Schilke (1992) Walmsley, C. M., & Schilke, P. 1992, in IAU Symp. 150: Astrochemistry of Cosmic Phenomena, ed. P. D. Singh (Kluwer Academic Publishers), 251
- Yıldız et al. (2010) Yıldız, U. A., van Dishoeck, E. F., Kristensen, L. E., et al. 2010, A&A, 521, L40
- Yıldız et al. (2013) Yıldız, U. A., Kristensen, L. E., van Dishoeck, E. F., et al. 2013, A&A, subm.